How Debt Got to 100% of GDP: A From Riches to Rags Update
Since gross national debt crossed $40 trillion last month – and the more meaningful debt held by the public as a share of Gross Domestic Product (GDP) hit 100% – there has been much discussion over how the debt got this high. Despite efforts to pin the high debt on a single cause, claims attributing it to deficit-financed tax cuts, unpaid-for spending increases, and unchecked growth of entitlement programs for health and retirement are all in some ways correct.
As recently as 2001, debt held by the public was 32% of GDP and falling, while the federal government was running annual surpluses of about 1% to 2% of GDP. Today, debt held by the public is 100% of GDP and rising, while deficits are running around 6% of GDP annually.
Based on our 2024 analysis, “From Riches to Rags: Causes of Fiscal Deterioration Since 2001,” we show:
- Either tax cuts or spending increases enacted since 2001 can explain virtually all the growth of the debt-to-GDP ratio not related to recession-fighting measures.
- Without deficit-financed tax cuts, unpaid-for spending increases, or recession-fighting measures, the national debt would be fully paid off today; without any two of the three, it would be roughly at 2001 levels.
- Debt-to-GDP growth can also be explained by the growth of health and retirement programs that was largely (though not fully) built into the law back in 2001 and earlier.
- Neither the Inflation Reduction Act (IRA) nor the One Big Beautiful Bill Act (OBBBA) have yet played a major role in the growth in debt since 2001, though OBBBA will significantly worsen future debt levels.
High Debt has Many Causes
By definition, high debt and deficits are caused by a disconnect between spending and revenue. Trying to blame one specific part of the budget has been likened to describing which side of the scissors does the cutting.
While it is therefore impossible to attribute the debt itself to one part of the budget or another, it is possible to explain what has caused changes in the debt and deficits, at least relative to counterfactuals.
In our 2024 paper, “From Riches to Rags: Causes of Fiscal Deterioration Since 2001,” we evaluated these changes in two different ways. One way was to look at how fiscal policy has changed since 2001 due to laws and regulations; another was to look at how the budget itself has changed over time.
Using these different approaches, we constructed a number of counterfactuals to help attribute “causes” for the rising debt.
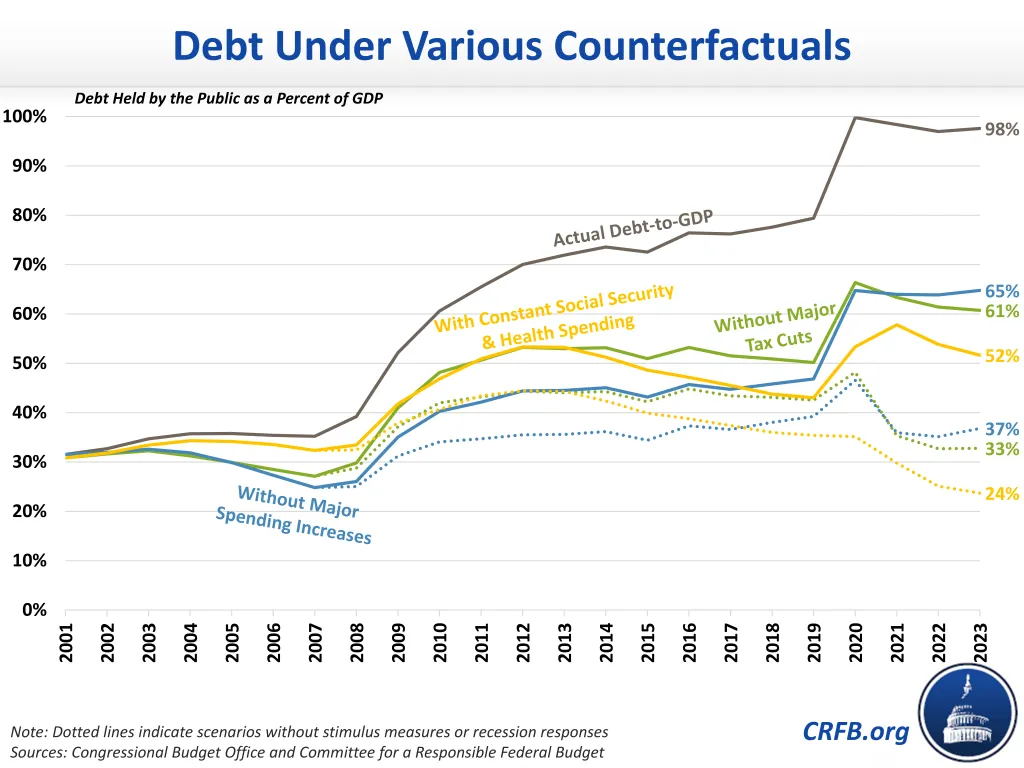
Since 2001, debt held by the public has tripled as a share of the economy, from 32% to 100% of GDP. It was 98% of GDP at the end of 2023.
Had none of the major spending increases enacted between 2001 and 2023 ever occurred, we estimate debt would have been 65% of GDP in 2023. Similarly, if none of the major tax cuts enacted between 2001 and 2023 had ever occurred, debt would have been 61% of GDP. Alternatively, had the costs of Social Security and federal health programs been held constant as a share of GDP, debt would have been 52% of GDP in 2023.
Removing the impact of stimulus measures and COVID relief under the last major recessions, debt under these scenarios – assuming either no spending increases, no tax cuts, or constant Social Security and health spending – would have been 37%, 33%, or 24% of GDP in 2023, respectively.
In other words, major spending increases, major tax cuts, and growth in entitlement programs can each individually explain most of the growth in debt-to-GDP not related to economic downturns. Although these counterfactuals only run through 2023, we expect very similar outcomes through 2026.
Tax Cuts and Spending Increases Have Exploded the Debt
One way to understand the rise in the debt is to estimate the impact of legislative and regulatory changes. Absent any major spending increases, major tax cuts, or recession responses since 2001, our Riches to Rags paper found debt would be paid off today. Absent any two of the three, debt-to-GDP would be around 2001 levels.
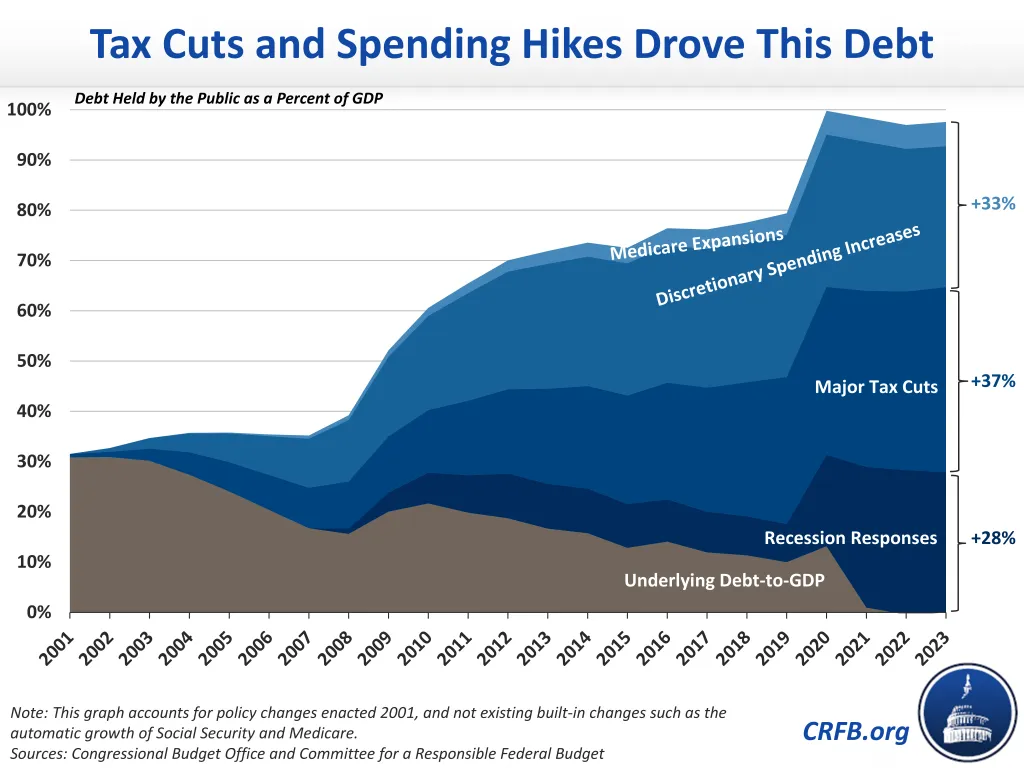
In our analysis, we estimated that net defense and nondefense discretionary spending increases enacted starting in 2001 added about $6 trillion to debt, or 28% of GDP, while Medicare expansions added another $1 trillion, or 5% of GDP. Discretionary increases include not only normal appropriations but also spending on the wars in Iraq and Afghanistan as well as other one-time spending for wars, natural disasters, emergencies, and other initiatives. Medicare expansions were mainly related to the establishment of Medicare Part D and replacement of Medicare’s Sustainable Growth Rate.
On the tax side of the ledger, five major pieces of tax legislation – the 2001 and 2003 tax cuts, their extensions and modifications in 2010 and 2013, and the 2017 Tax Cuts and Jobs Act – added over $8 trillion to debt between 2001 and 2023, accounting for 37% of GDP of debt in 2023.
Finally, legislation and executive actions enacted in response to the 2007-2009 Great Recession and the COVID-19 pandemic and related recession accounted for more than $6 trillion in debt added between 2001 and 2023, or about 28% of GDP.
Although nominal debt has grown substantially since 2023, debt-to-GDP has only increased by 2 percentage points as unexpected high inflation has eroded the debt. For this and other reasons, we expect an analysis through 2026 would look similar to one through 2023 – though tax cuts would likely explain a slightly larger portion of the total.
Rising Spending and Falling Revenues Have Exploded the Deficit
Although it is useful to understand how legislative and regulatory changes have impacted the debt, this approach has a built-in bias associated with the laws already in effect at the beginning of the analysis window (in this case, 2001). Any built-in growth in the budget is taken as a given under this approach.
Another approach is to look at how spending and revenue levels have changed over time. “Rather than estimating the effects of policy changes compared to a counterfactual,” our paper explains, “this type of analysis focuses on fiscal outcomes and how they have changed over time.”
Between Fiscal Years (FY) 2001 and FY 2025, the country went from running a 1.2% of GDP surplus to a 5.8% of GDP deficit – a 7.1% of GDP swing (numbers do not sum due to rounding). Of this change, about three-quarters (5.4% of GDP) was the result of higher spending and one-quarter (1.7% of GDP) from lower revenue. The higher cost of Medicare, Medicaid, and other federal health programs explains a full two-fifths (2.8% of GDP) of the increase, while the growth in Social Security and interest costs each explain another one-sixth of the change.
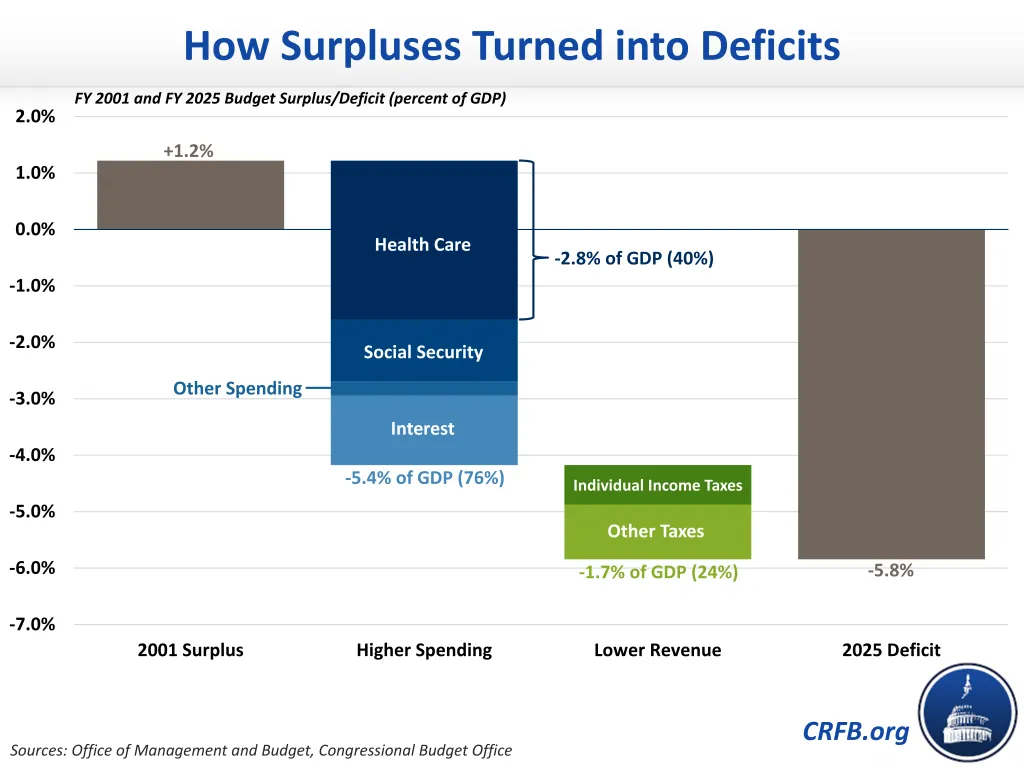
All other spending has barely increased as a share of GDP – and this increase is more than entirely driven by the growth in spending on veterans’ programs. We estimate mandatory and discretionary veterans’ programs have grown by 0.8% of GDP since 2001 (explaining 12% of deficit growth), while all other mandatory and discretionary spending has actually declined by 0.6% of GDP.
IRA and OBBBA Aren’t to Blame…At Least Not Yet
Because our Riches to Rags paper was published in early 2024 and only analyzed debt changes through 2023, it did not incorporate the impact of the Inflation Reduction Act of 2022 (IRA) or the One Big Beautiful Bill Act of 2025 (OBBBA). However, these bills have not yet added enough to the debt to meaningfully change the findings of our 2024 report.
Based on original scores from the Congressional Budget Office and Joint Committee on Taxation, the IRA was projected to add about $25 billion to the debt through FY 2026 (and was projected to reduce deficits by $238 billion over a decade), while OBBBA was projected to add about $475 billion. Importantly, the IRA’s energy and Medicare Part D redesign provisions both appear to be much more costly than originally scored, but even after adjustments it is unlikely the IRA as written has added more than $200 billion to debt since its enactment (because much of the IRA has subsequently been repealed, it is impossible to measure ‘actual’ impact). Taken together, this suggests OBBBA and the IRA might be responsible for about 2% of GDP of debt by the end of FY 2026 (and less than 1% through the end of FY 2025).
While 2% of GDP is certainly a meaningful figure – and is one way to explain the growth in debt since 2023 – it is a very small share of the growth in debt-to-GDP since 2001.
Although neither of these laws have had a major impact on the debt thus far, OBBBA is likely to substantially increase the debt as time goes on. CBO projects that OBBBA will add $4.7 trillion to the debt through FY 2035 even after accounting for its economic effects; we find it would set the stage for more like $6.5 trillion in debt if its temporary provisions are made permanent. This would amount to 10% to 14% of GDP by 2035. The IRA may also add modestly to the debt going forward, depending on how successful drug price negotiations are at reducing long-term costs.
* * * * *
As deficits and debt approach increasingly unsustainable levels, many Americans are reasonably asking the question of how we got here. As our analysis shows, tax cuts, spending increases, recession responses, and automatic growth of entitlement programs can all help explain why debt has risen so dramatically over the past quarter century.
But the question of how we got into this mess is much less important than the question of how we get out of it. Rather than casting blame across the aisle, policymakers should focus on working together to reduce deficits by addressing both sides of the ledger in order to bring deficits toward the 3% of GDP target and put debt on a sustainable path.
What's Next
-
Image

-
Image

-
Image