From Riches to Rags: Causes of Fiscal Deterioration Since 2001
In 2001, the federal government ran a $128 billion budget surplus and was projected to pay off the national debt by 2009. Since then, the government has borrowed an additional $23 trillion, bringing the national debt held by the public to a near-record 98 percent of GDP and transforming that surplus into a $1.7 trillion deficit.
Some have claimed this fiscal deterioration was entirely caused by tax cuts or was completely due to spending growth. In reality, both spending increases and revenue reductions can explain the growth in deficits and debt.
The growth in deficits and debt can be explained both by the automatic growth in mandatory spending and by the enactment of tax cuts and spending increases. Absent any of these phenomena, debt would be on a far more sustainable path.
In this analysis, we assess the causes of this fiscal deterioration in two different ways: by estimating the impact of significant policy changes since 2001 and by comparing spending and revenue levels as a share of GDP in 2001 to those in 2023.1
Looking at the policy changes enacted since the beginning of 2001, we find:
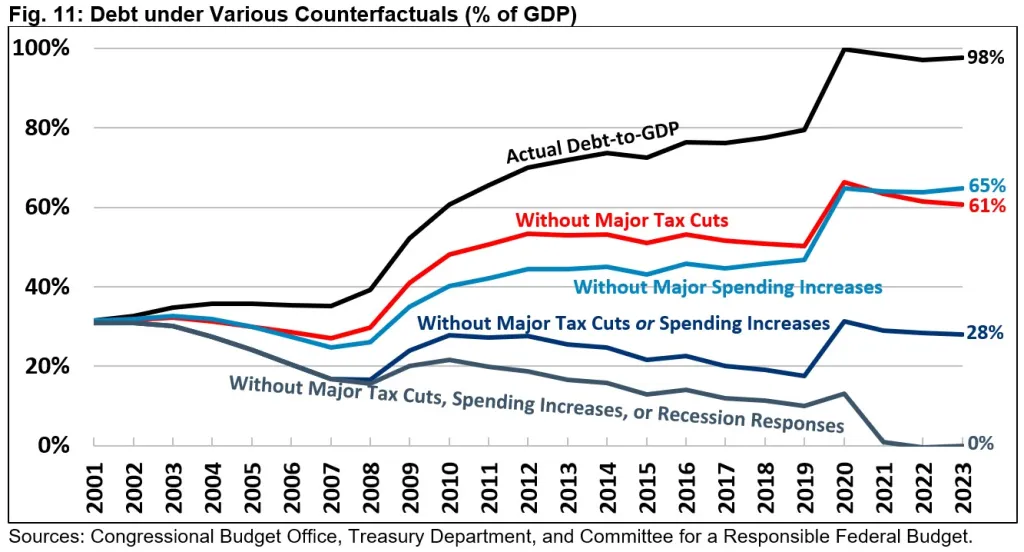
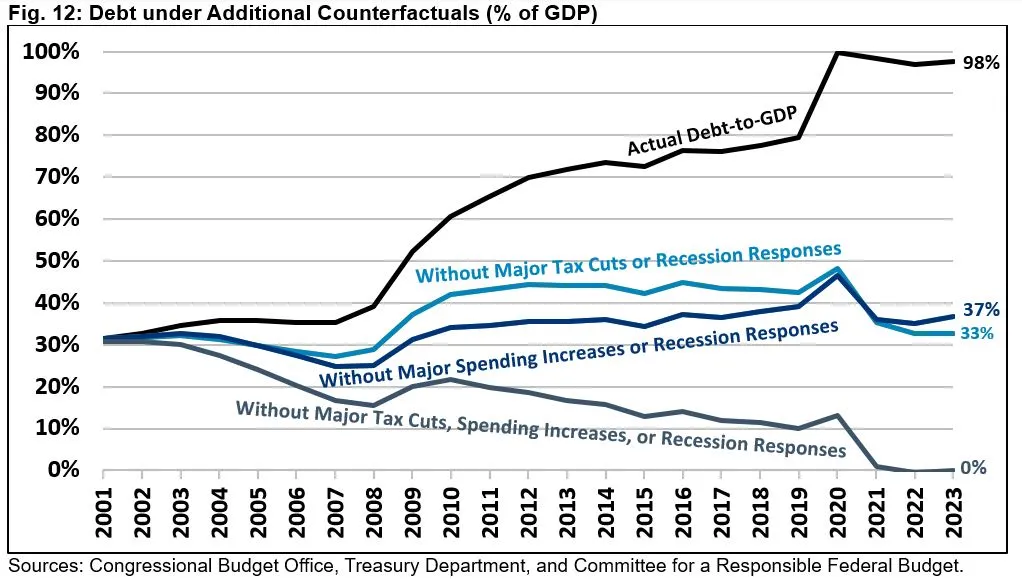
- Debt is 37 percent of GDP higher due to major tax cuts, 33 percent higher due to major spending increases, and 28 percent higher due to recession responses.
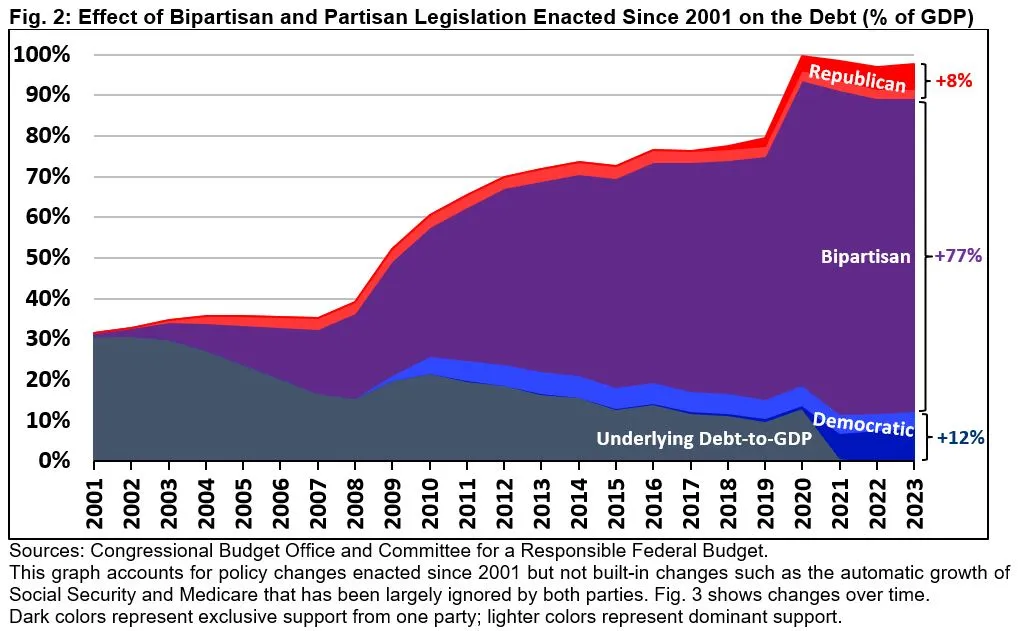
- Most debt – 77 percent of GDP – can be attributed to bipartisan legislation.
- Absent these tax cuts and spending increases, the debt would be fully paid off.
Comparing spending and revenue as a share of the economy over time, we find:
- Rising spending relative to GDP explains about two-thirds of the growth in annual budget deficits since 2001, while declining revenue explains one-third.
- Had revenue remained stable as a share of the economy, the debt would be half its size; had primary spending been stable, it would be nearly paid off.
Under any of these counterfactuals, the deficit would currently be much smaller, and in some scenarios the budget would have been balanced or in surplus.
Showing how things have changed does not necessarily explain the cause of debt – which is the disconnect between spending and revenue – nor does it always offer easy solutions. And notably, our analysis does not account for all causes of rising debt. Still, knowing how we got here can be useful in helping determine where to go next. Any realistic plan to fix the debt will require addressing both revenue and spending.
How Has Legislation Affected the National Debt?
In 2001, the Congressional Budget Office (CBO) projected that the national debt would effectively be paid off in full by the end of Fiscal Year (FY) 2009.2 Instead, federal debt held by the public grew from 32 percent of Gross Domestic Product (GDP) at the end of FY 2001 to 98 percent of GDP at the end of FY 2023.
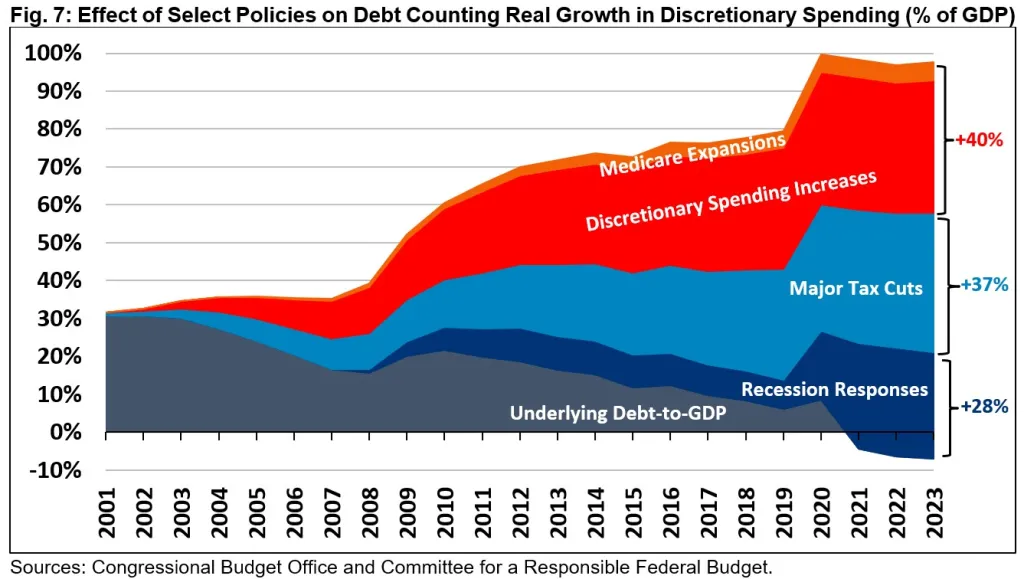
Reviewing major deficit-increasing legislation and executive actions over the past 22 years, 3 we find that major tax cuts are responsible for 37 percentage points of debt-to-GDP, net discretionary spending increases and major Medicare expansions are responsible for 33 percentage points, and response measures to the Great Recession and the COVID-19 pandemic and recession – before accounting for economic feedback – explain 28 percentage points.
Absent any two of these sets of policies, the debt-to-GDP ratio would be near the FY 2001 level. Absent these tax cuts, spending increases, and recession responses, debt would be fully paid off.
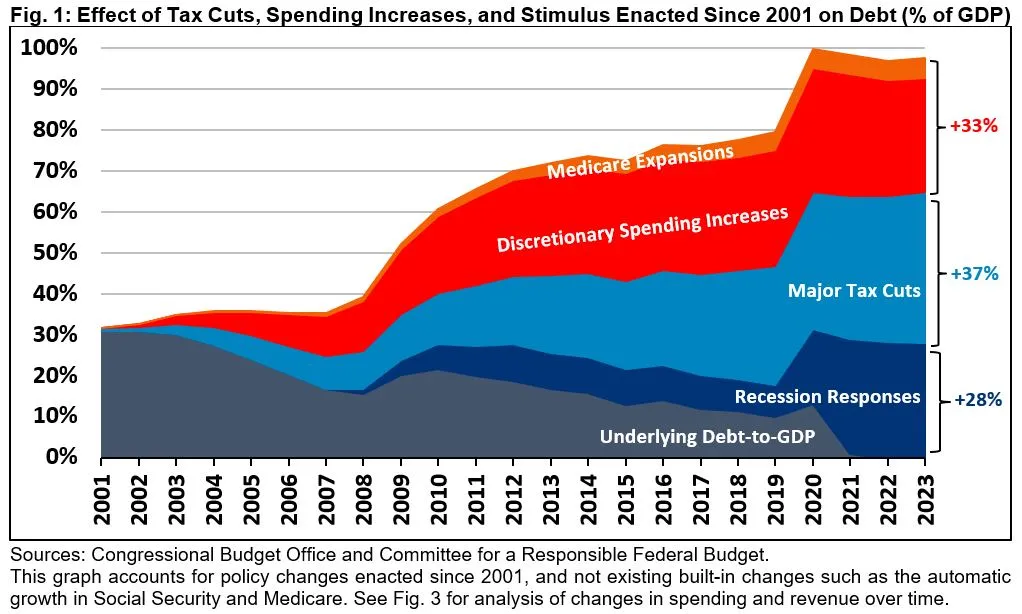
Our analysis focuses on five pieces of tax legislation, including the 2001 and 2003 tax cuts, their extensions and modifications in 2010 and 2013, and the 2017 Tax Cuts and Jobs Act. These bills have cost nearly $8.4 trillion through 2023, of which $6.5 trillion was at least somewhat bipartisan (though skewed Republican) and $1.8 trillion was passed overwhelmingly by Republicans.
In terms of discretionary spending, we estimate there were about $5.9 trillion of net spending increases – nearly all bipartisan – including normal appropriations increases as well as one-time spending for wars, natural disasters, emergencies, and other initiatives. Spending increases were split roughly evenly between non-war defense and nondefense. Our estimates are generated relative to a baseline that assumes spending growth with inflation over a decade and with GDP over the long term (see Appendix I) as in many CBO Long-Term Budget Outlooks. Total real (above-inflation) increases in discretionary spending have cost $7.6 trillion, including roughly $2 trillion in funding related to the wars in Iraq and Afghanistan, and boosted debt by 35 percent of GDP.
Our Medicare estimates cover the establishment of Medicare Part D and the net cost of actions to modify or replace Medicare’s Sustainable Growth Rate. These cost roughly $1.1 trillion, of which $900 billion was bipartisan and $200 billion came from Democratic executive actions.
Finally, we tallied the legislative and executive actions in response to the 2007-2009 Great Recession and the COVID-19 pandemic and recession. We estimate these changes have cost $6.8 trillion through 2023, with nearly $4.8 trillion enacted on a bipartisan basis, nearly $2 trillion overwhelmingly from Democrats, and less than $100 billion from Republican executive actions.
Of the policies we reviewed, 77 percentage points of debt-to-GDP can be explained by legislation with some meaningful level of bipartisan support.4 Highly partisan Democratic actions explain 12 percentage points, and highly partisan Republican actions explain 8 percentage points.5 Many bipartisan actions extended policies that were originally more partisan in nature.
Notably, our analysis includes most of the deficit-increasing actions over the past 22 years but not all of them. Among the more significant actions not included are numerous one-time Alternative Minimum Tax (AMT) patches and tax extenders,6 expansions to veterans’ benefits, and expansions and modifications of the federal direct student loan program.7 We do not directly account for most fully offset or deficit-reducing legislation, though most deficit reduction has been on the discretionary side of the budget and is thus netted from our estimates.
How Have Spending and Revenue Changed Since 2001?
Although measuring the impact of legislation can help to explain why the debt is higher than it otherwise would have been, it is only one way to understand the fiscal deterioration over the past 22 years. In particular, the prior analysis does not account for the effects of the built-in spending growth in certain parts of the budget, while it takes for granted the built-in growth in revenue.
An alternative method is to study how revenue and spending as a share of GDP have changed since we were last running budget surpluses, and how those changes have impacted the budget. Rather than estimating the effects of policy changes compared to a counterfactual, this type of analysis focuses on fiscal outcomes and how they have changed over time.
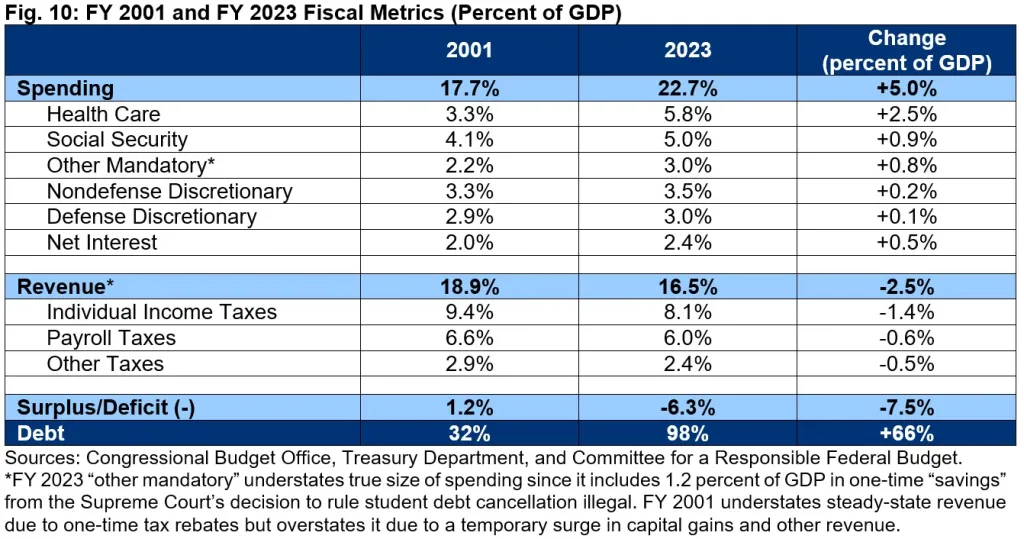
Between 2001 and 2023, annual deficits expanded by 7.5 percent of GDP – from a 1.2 percent of GDP surplus to a 6.3 percent of GDP deficit. Two-thirds of this deficit growth can be explained by rising spending as a share of the economy, while one-third of the deficit growth is from declining revenue as a share of GDP.8 See Appendix III for more detail.
Most of the 5.0 percent of GDP growth in spending comes from the growth in mandatory spending programs. Spending on health care programs has increased by a combined 2.5 percent of GDP, Social Security spending has grown by 0.9 percent of GDP, and other mandatory spending by 0.8 percent of GDP. While some of this growth was the result of legislation – including the establishment of Medicare Part D and the (fully offset) Affordable Care Act – most was the result of automatic spending growth based on built-in cost and eligibility growth.9
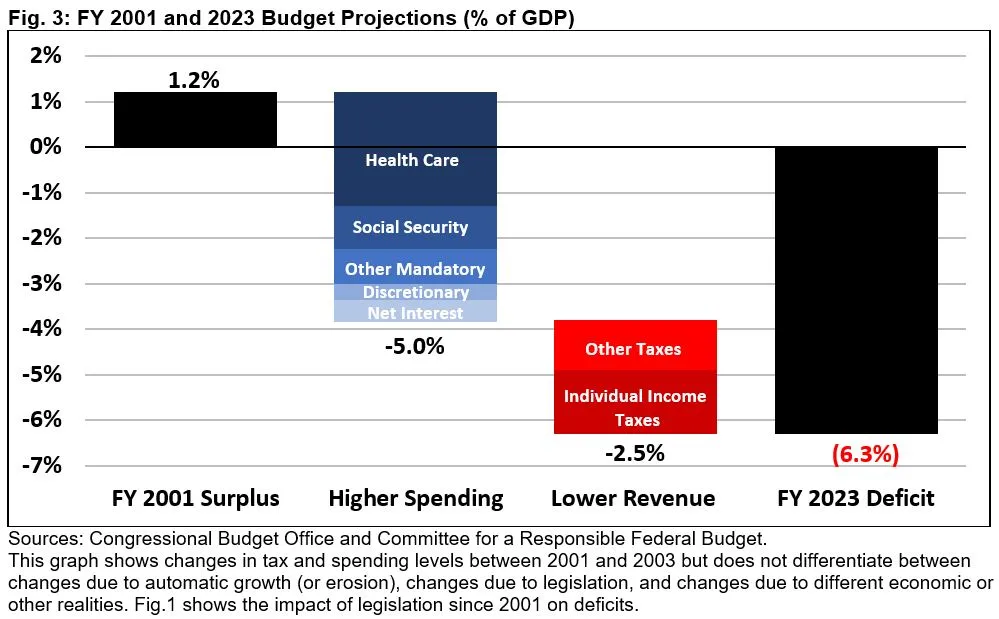
On the revenue side of the equation, more than half of the 2.5 percent of GDP decline is the result of falling income taxes and the rest a decline in payroll and other tax receipts. More than all of this decline can be attributed to enacted tax cuts – partially offset by some tax increases and real bracket creep – though economic differences and capital gains realizations also play a role.
Absent the decline in revenue since 2001, the national debt would only be half as large as it is today. Absent the increase in primary spending, the debt would be nearly paid off.
Had policymakers held revenue constant at 18.9 percent of GDP while spending at actual levels, we estimate debt would have been about 50 percent of GDP at the end of FY 2023 instead of 98 percent. Had they held primary spending constant at 15.7 percent of GDP while raising revenue at actual levels, debt would have been 6 percent of GDP and falling by the end of FY 2023.10
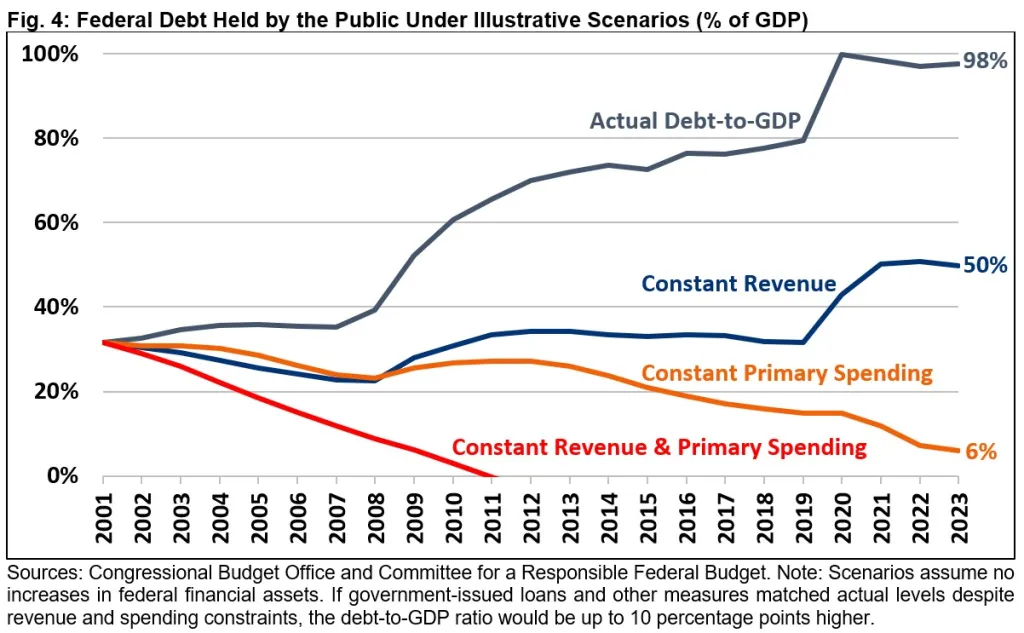
Finally, had revenue and primary spending both remained at 2001 levels, the national debt would have been paid off by 2011 and the government would have substantial wealth today.
Importantly, these scenarios are necessarily illustrative. Revenue was unusually high in FY 2001, given tax rates at the time, due to economic and stock market performance. Revenue and spending also fluctuate regularly based on changes in the economy, the need to respond to crises and challenges, and other factors. It would not have been achievable nor desirable to keep spending and revenue flat through a major terrorist attack, two wars, two recessions, many natural disasters, and a pandemic. Even achieving these results on average, yielding similar fiscal outcomes, would require substantially higher taxes and less benefits and spending than what Americans of all incomes have historically experienced. Nevertheless, these illustrations help to show the effect of rising spending and declining revenue on the nation’s fiscal position.
Could We Have Had a Balanced Budget?
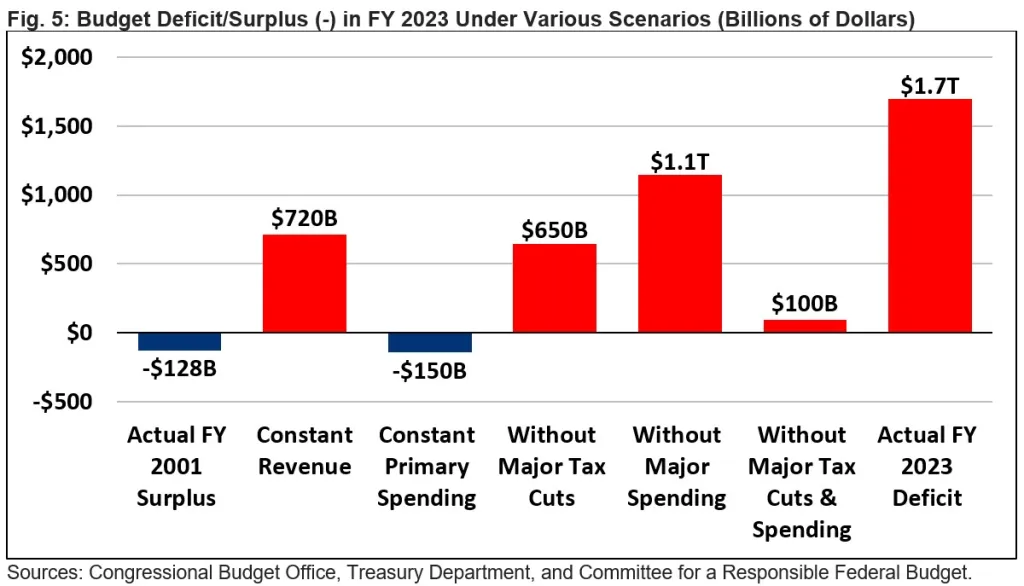
The budget deficit was $1.7 trillion in FY 2023. Had policymakers not enacted a series of tax cuts, boosted base and supplemental discretionary spending, or allowed built-in spending growth to continue, the budget deficit would be much closer to balance today, if not in surplus.
We estimate that if policymakers had held revenue constant at 18.9 percent of GDP as it was in FY 2001, the deficit would be nearly 60 percent smaller at about $720 billion in FY 2023. Had policymakers instead held primary spending constant at the FY 2001 level of 15.7 percent of GDP, the government would have run a roughly $150 billion budget surplus in FY 2023.
Had policymakers not enacted the five major pieces of tax cut legislation between 2001 and 2017, the budget deficit would have been $650 billion in FY 2023. Meanwhile, had they not increased discretionary spending and expanded Medicare, it would have been $1.1 trillion. And had they not enacted either the tax cuts or the spending increases, the deficit would be only $100 billion.
Other scenarios could have led to even larger surpluses. For example, had policymakers not enacted tax cuts, spending increases, or legislation in response to the Great Recession and COVID-19 pandemic – assuming no dynamic effects – the government would have run a $260 billion surplus in 2023. Had they held primary spending and revenue to FY 2001 levels and earned interest on accumulated wealth, the government would have run a $1.1 trillion surplus in 2023.
These estimates do not account for most dynamic effects of various policies on the economy.
Conclusion
Since 2001, the United States turned a modest budget surplus into a $1.7 trillion budget deficit and has tripled the debt-to-GDP ratio from 32 percent to 98 percent. While the nation was on course to pay off its debt back in 2001, it now faces high and rising debt with no end in sight.
These high and rising deficits and debt are caused by the disconnect between spending and revenue. Whether spending is “too high” or revenue is “too low” is a question of values and priorities that cannot be answered objectively. However, it is useful to understand whether changes in spending or revenue can explain our nation’s fiscal deterioration – and the clear answer is that both can. Increases in spending and reductions in revenue are both to blame for the rapid rise in deficits and debt that has occurred since 2001.
Unfortunately, understanding the drivers of the debt does not always lend itself to obvious solutions. Many of the legislative causes of debt have already ended or are soon scheduled to – for example, spending on Iraq and Afghanistan, COVID-19 relief, and parts of the 2017 tax law. And simply restoring policies to either 2001 levels or those consistent with 2001 law would have significant economic, distributional, welfare, and political consequences.
Yet just as spending increases and revenue reductions can help explain our current fiscal situation, slowing spending growth and enhancing revenue collection can help improve our fiscal outlook. The CRFB Fiscal Blueprint suggests a path forward that incorporates both spending and revenue changes. Congress should also establish a bipartisan fiscal commission that considers changes on both sides of the budget.
Appendix I: Methodology
To calculate the fiscal impact of policies in this analysis, we relied on data from the Congressional Budget Office (CBO), Joint Committee on Taxation (JCT), and our own calculations. Our analysis is not exhaustive, but includes all major deficit-increasing laws and executive actions.
For the tax bills, we used CBO/JCT scores of the fiscal impact of the Economic Growth and Tax Relief Reconciliation Act of 2001 (EGTRRA); the Jobs and Growth Tax Relief Reconciliation Act of 2003 (JGTRRA); the extension and modification of the EGTRRA and the JGTRRA under the Tax Relief, Unemployment Insurance Reauthorization, and Job Creation Act of 2010; the American Taxpayer Relief Act (ATRA) of 2012; and CBO’s April 2018 dynamic estimate of the TCJA. Our estimates include the full fiscal impact of the EGTRRA, the JGTRAA, and the TCJA, but exclude elements of the 2010 tax bill and the ATRA related to spending or economic stimulus – including titles five and six of both bills. We accounted for extensions of AMT patches and bonus depreciation as tax policies when included in these bills. Each law in this category was either enacted on a temporary basis or else scored through at least 2022; therefore, we relied exclusively on CBO estimates except for the 2023 cost of the ATRA (which we extrapolated).
For responses to the Great Recession and COVID-19 pandemic and recession, we included the fiscal impact of the Economic Stimulus Act of 2008; the Housing and Economic Recovery Act of 2008; the Unemployment Compensation Extension Act of 2008; the Troubled Asset Relief Program (TARP); the American Recovery and Reinvestment Act of 2009 (ARRA); the Worker, Homeownership, and Business Assistance Act of 2009; the Temporary Extension Act of 2010; the Continuing Extension Act of 2010; the Unemployment Compensation Extension Act of 2010; the payroll tax holiday and unemployment provisions in the Tax Relief, Unemployment Insurance Reauthorization, and Job Creation Act of 2010; the Temporary Payroll Tax Continuation Act of 2011; the Middle Class Tax Relief and Jobs Creation Act of 2012; the Families First Coronavirus Response Act; the CARES Act; the Paycheck Protection Program and Health Care Enhancement Act; divisions M and N of the Response and Relief Act; the American Rescue Plan Act of 2021; and the PPP Extension Act of 2021. In most cases, we incorporated CBO and JCT scores directly. In the case of TARP, we incorporated the actual recorded costs. For COVID-19 relief measures enacted in the first half of 2020, we relied on CBO’s September 2020 estimates of the relevant bills, with one adjustment for the substantially lower-than-projected take up of the voluntary employer payroll tax deferral. As with the tax bills included in our analysis, we counted AMT and expensing changes as economic relief when they were included in economic relief bills. Our estimates of relevant executive orders were based on data tracked at CovidMoneyTracker.org. Our estimates do not account for any macrodynamic effects on revenue, interest costs, or GDP.
For Medicare expansions, we included the net impact of the Medicare Prescription Drug, Improvement, and Modernization Act of 2003 that established Medicare Part D; a variety of “doc fixes” that overrode the Medicare Sustainable Growth Rate (SGR) between 2002 and 2014; a 2009/2010 rule change that removed physician-administered drugs from the SGR; and the Medicare Access and CHIP Reauthorization Act of 2015 (MACRA), which permanently repealed the SGR. We estimated the cost of Medicare Part D based primarily on the actual costs of the program itself, with an assumed offset – ultimately 33 percent once phased in – to account for savings to other parts of the budget. SGR changes were generally estimated based on CBO scores and estimates, including based on our own prior analysis. Our analysis includes any offsets used to pay for various doc fixes, subtracted against the costs.
For discretionary spending, we compared actual discretionary outlays to a CBO-style baseline with FY 2001 projected outlays growing at the rate of the Consumer Price Index (CPI-U) for a decade and then at the rate of nominal GDP thereafter. To avoid double counting, we subtracted discretionary appropriations included in the ARRA and COVID-19 relief bills. The discretionary spending increases themselves include ordinary defense and nondefense appropriations and additional spending to fund the wars in Iraq and Afghanistan, respond to emergencies and natural disasters, build and maintain highways and other infrastructure, and for other purposes. Our estimates implicitly include all discretionary spending and savings enacted since the beginning of 2001, and thus they are net of various deficit reduction packages. They do not account for a small amount of mandatory and revenue offsets to pay for some discretionary increases, nor do they account for discretionary funding that was implicitly or explicitly shifted to the mandatory side of the budget. These effects are largely offsetting.
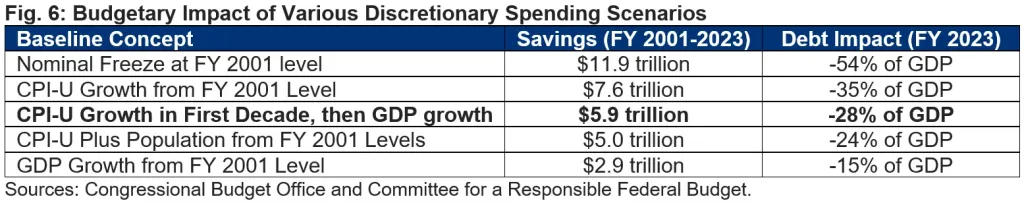
Importantly, discretionary spending is mostly appropriated on an annual basis, so there is technically no “current law” against which to score increases or decreases. For purposes of our estimates and in order to provide a conservative estimate, we compared spending to a baseline consistent with CBO’s long-term budget projections – one that grows with inflation for the first decade and with the overall economy thereafter.11 This methodology significantly understates the full cost of discretionary spending increases beyond 2011 by only counting real growth in excess of output growth at that point. We estimate that policymakers have increased discretionary spending by $7.6 trillion above real 2001 levels, compared to $5.9 trillion above our CBO-style baseline. Other alternative baselines could yield different results, as illustrated in the table below
To calculate debt service costs, we assume all new debt pays the average rate of interest on all federal borrowing. Although this assumption may modestly skew the distribution of interest between policy areas, it should prove far more accurate than relying on estimated interest costs at the time of passage – particular for a scenario that results in all debt being paid off. It is important to note that this ‘zero-debt’ scenario would be unlikely to occur in reality as it would require the federal government to repurchase outstanding debt. Rather, we’d expect a modest amount of government debt along with a similar amount of government assets.
Appendix II: Alternative Methods for Discretionary Spending and Revenue
Our estimates of the effects of policy changes are generated relative to a baseline consistent with CBO’s recent Long-Term Budget Outlooks. Under this baseline, revenue grows indefinitely relative to the economy as would occur under 2001 current law, but discretionary spending – which grows with inflation over the ten-year budget window – is held constant as a share of the economy after the end of the first decade. Although this treatment is common practice, it is somewhat internally inconsistent, especially as baselines shift over time. As a result, it creates some inconsistency in our analysis, which effectively charges policymakers the full cost of preventing the built-in growth of revenue relative to GDP but only charges them some of the cost of preventing built-in erosion of discretionary spending relative to the economy.
Below we've run several alternatives but with less sophistication than our base analysis. These estimates are rough and illustrative in nature and very sensitive to assumptions.
Under an alternative baseline concept where discretionary spending remains at real (inflation-adjusted) 2001 levels over the long run, we estimate major spending increases can explain 40 percentage points of debt-to-GDP as opposed to 33 percentage points in our base analysis.
Under a third baseline concept where discretionary spending and revenue both grow with GDP after the first decade, we estimate major tax cuts can explain about 28 percentage points of debt-to-GDP as opposed to 37 percentage points in our base analysis.12

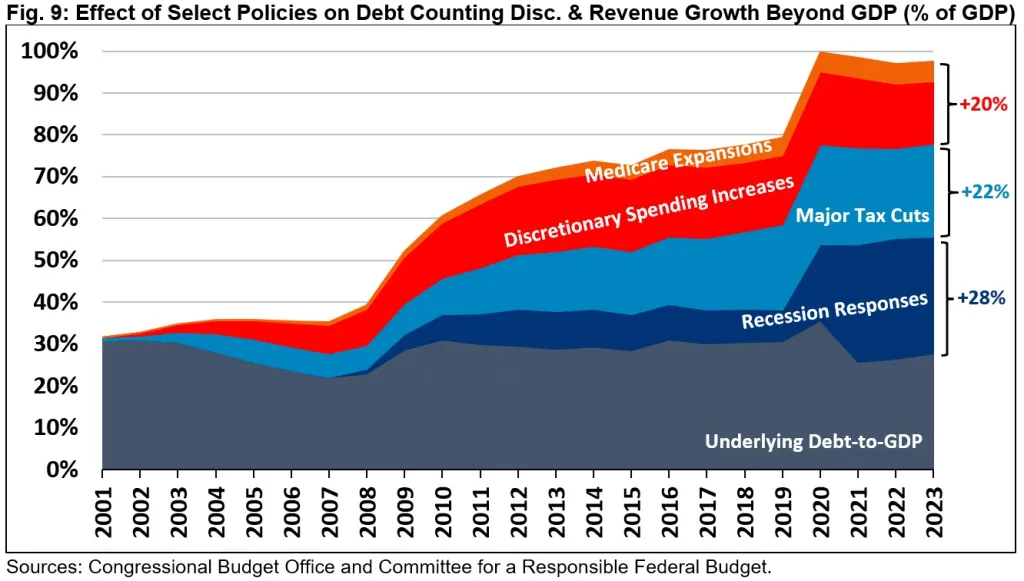
Under a final baseline concept where discretionary spending and revenue both grow with GDP beginning within the ten-year budget window, we estimate major tax cuts can explain 22 percentage points of debt-to-GDP (as opposed to 37 percentage points) and major spending increases can explain 20 percentage points (as opposed to 33 percentage points).13
Appendix III: Additional Charts
Between 2001 and 2023, federal spending as a share of GDP rose from 17.7 percent to 22.7 percent, while revenue fell from 18.9 percent to 16.5 percent.
Without major spending increases or tax cuts, debt would be one-third smaller. Without either, debt would be two-thirds smaller. Also excluding recession responses, debt would be paid off.
Appendix IV: Comparison to Other Estimates
Other analyses have estimated the drivers of the deteriorating fiscal outlook. Their estimates are generally similar to ours numerically, though the authors may reach different conclusions.
In his March 2023 piece “Tax Cuts are Primarily Responsible for the Increasing Debt Ratio,” Bobby Kogan estimates that major tax cuts added 38 percent of GDP to the debt while recession response added 26 percent. These figures closely match our estimates of 37 and 28 percent, respectively. Differences stem mainly from the fact that Kogan’s estimates account for more tax cut laws than ours and distributes AMT patches differently, that we account for COVID-19 related executive actions that he does not, and from different methods to calculate interest. Kogan’s analysis does not account for the cost of Medicare or discretionary spending increases, which would eliminate the debt if incorporated.
In its June 2012 analysis, “Changes in CBO’s Baseline Projections Since January 2001,” CBO estimated that discretionary legislative changes cost $2.9 trillion through 2011 – nearly identical to our estimate of $2.9 trillion through 2011. CBO estimated revenue and mandatory spending changes cost $4.2 trillion, compared to our $3.4 trillion for major changes. Differences stem mainly from the fact that CBO incorporates more legislation than we do but also because CBO estimates the effects of the TARP and Medicare Part D programs based on the original score while we adjust for actual costs. CBO’s discretionary estimates differ from ours in that it includes parts of the ARRA stimulus bill, which is roughly offset by the fact that CBO’s 2001 and subsequent baseline generally over-estimated future inflation and thus baseline spending.
In his November 2013 piece “Why We Have Federal Deficits: The Policy Decisions That Created Them,” Charles Blahous found that over three-quarters of the country’s long-term fiscal imbalance was the result of legislation enacted between 1965 and 1972 – mainly the establishment of Medicare and Medicaid without full offsets. Because Blahous’s piece takes a longer view and uses a completely different methodology than ours, it is not comparable.
In his December 2023 piece, “Nostalgia for 1990s Individual Income Tax Rates Is Misguided,” Kyle Pomerleau estimates that restoring the tax code to 1997 law would raise $724 billion in 2024. Similarly, we estimate major tax cuts lose about $800 billion of revenue in 2023. Differences likely stem mainly from the fact that we include corporate tax cuts and don’t assume the reversal of significant tax increases, and that we start at 2000 law rather than 1997 law.
Finally, in his chartbook “Spending, Taxes, and Deficits: A Book of Charts,” Brian Riedl shows that 64 percent of the growth in the deficit since 2000 is from higher spending (with 58 percent from mandatory spending), while 36 percent is from lower revenue. This is very similar to our estimate that 67 percent of deficit growth is from higher spending (with 56 percent from mandatory spending) and 33 percent from lower revenue. Differences stem from the fact that Riedl compares to 2000 and we compare to 2001, and from the fact that he adjusts the 2023 deficit for an accounting quirk related to student debt cancellation.
Endnotes
____________________________________________________________
1 One could also compare fiscal outcomes since 2001 to what was projected at the time. However, this exercise is unlikely to yield informative results about the impact of legislated or built-in changes in policy, particularly over a long time span. Differences between past and present projections, particularly over long time spans, are likely to be largely driven by projection errors and differences between assumed and actual economic, technical, and other outcomes. They are also driven by changes in estimating and forecasting methodology over time, including changes to how GDP was calculated for historic and projected data, and differences in forecasting methods within and outside of the ten-year window when it comes to non-health, non-retirement spending. As one example, primary spending in 2050 would be more than 2 percent of GDP lower than CBO’s 2012 projections if one adjusts for changes in how GDP is calculated and differences in how long-term discretionary and ‘other mandatory’ spending is extrapolated to match the most recent long-term budget outlook. Although recent projections of primary spending appear lower than CBO’s 2012 projections by 2040, spending is actually projected to be higher than previously projected once appropriate adjustments are made.
2 CBO’s January 2001 baseline projected the government would hold $939 billion of debt along with $1.6 trillion of uncommitted funds. Though the government would be able to pay off its debt at that point, CBO assumed the government would wait for outstanding debt to mature rather than using excess surpluses to buy back existing debt.
3 Our analysis focuses on five major tax cut bills enacted between 2001 and 2017, temporary and ongoing increases in discretionary spending since 2001, expansions of Medicare through the establishment of Medicare Part D and changes to the Sustainable Growth Rate, and legislative and executive actions in response to the Great Recession and the COVID-19 pandemic and recession. We measure discretionary increases relative to a CBO-style baseline that assumes discretionary spending levels would have grown with inflation in the first decade and with GDP in subsequent years. See Appendix I for more details.
4 We consider policy changes to be bipartisan if it had the support of at least 15 percent of voting Members from both parties in at least one chamber of Congress. We count it as mostly partisan if it was supported by at least one Member of each party. And we consider them fully partisan if they had support from only one party or were enacted through executive action. It is important to note that in many cases, broad bipartisan actions extended policies that were previously enacted on a more partisan basis.
5 If one were to count the 2001 tax cuts and the 2003 establishment of Medicare Part D as partisan – despite having support from 12 Senate Democrats (compared to 32 voting no) and 10 Senate Democrats (compared to 35 voting no), respectively – then Republican partisan actions could explain 20 percentage points of debt-to-GDP.
6 Our analysis does include the cost of AMT patches that were part of other major tax cut legislation, including the permanent indexation of the AMT parameters in 2013 and temporary modification to those parameters in 2017.
7 Although CBO has only scored veterans’ benefits and student loan changes with (relatively) modest costs, both have substantially increased the national debt in practice. Legislation to dramatically expand the direct loan program in place of loan guarantees has increased government debt by $1 trillion to $2 trillion (while also increasing government assets). The increase in the generosity of veterans’ benefits and number of eligible veterans – especially due to the wars in Iraq and Afghanistan – has been a significant factor in boosting the cost of mandatory veterans’ programs from $23 billion in 2001 to $172 billion by 2023.
8 These results are somewhat sensitive to methodological and analytical choices. We estimate the growth in spending relative to the economy explains 67 percent of the deficit growth between 2001 and 2023. Excluding interest, the growth in spending would explain 65 percent. Adjusting the 2023 deficit to remove an accounting quirk regarding the legality of student debt cancellation, spending growth would explain 72 percent of the deficit growth. And using FY 2000 as the base year, spending growth would explain 59 percent of the deficit growth.
9 The Affordable Care Act (ACA) expanded non-Medicare health care spending, offset by a reduction in the growth of Medicare spending and by increases in revenue – some of which were reversed in subsequent legislation. On net, the ACA likely explains less than one-tenth of the increase in health care spending as a share of GDP between 2001 and 2023. Absent the ACA and subsequent tax reversal, revenue would have likely fallen more than a tenth further.
10 The scenarios implicitly assume no increases in federal financial assets after 2001. If government-issued loans and other measures matched actual levels – especially bolstered by the federal direct student loan program – despite revenue and spending constraints, the debt-to-GDP ratio could be up to 10 percentage points higher.
11 For purposes of its ten-year baseline, CBO generally assumes personnel costs will grow with the Employment Cost Index and other costs with the GDP price index. We approximate this blended inflation rate by using the CPI-U.
12 For purposes of this analysis, we construct a baseline that removes all significant legislative changes to revenue through 2011 and then holds revenue as a share of the economy flat at the implied 2011 level of 18.2 percent of GDP thereafter. We then adjust this baseline downward to account for revenue loss as a result of recession-response legislation and upward to account for tax increases imposed to finance new spending – especially under the Affordable Care Act. We then tally the annual revenue loss of each of the major tax cuts only to the extent they contribute to the difference between actual revenue levels and revenue levels implied by this baseline (we also count the outlay effect of these tax cuts, regardless of size). In years where actual revenue was above levels of this baseline, we assume tax cuts had no effect on revenue levels rather than attributing “savings” to the tax cuts.
13 For purpose of this analysis, we constructed a baseline and estimated costs in a manner like that described in the above endnote. However, we assumed revenue stayed flat at 17.8 percent of GDP after 2002 as our starting point. We use 2002 since those revenue levels more closely matched historic norms and 2001 revenue levels were unusually high due to record capital gains in the prior year and other temporary factors. A different starting point could dramatically change the results of these estimates, which are necessarily illustrative.


