Trump CEA Projections Tracker
Before the passage of the One Big Beautiful Bill Act (OBBBA), the White House Council of Economic Advisers (CEA) released economic and fiscal projections showing considerable expected economic and budgetary improvements. These estimates are far more optimistic than those of the Congressional Budget Office (CBO) and other credible estimates.
To compare these projections to future outcomes, the below tracker maps each of CEA’s predictions on an annual basis, along with actual outcomes.1 It also shows CBO’s February 2026 Baseline – their first baseline since OBBBA – along with the latest Administration projections from the President's FY 2027 Budget.2
Including assumed macroeconomic effects, CEA estimated that when incorporating the effects of OBBBA, tariffs, discretionary cuts, energy reforms, and deregulation:
- Real Gross Domestic Product (GDP) will grow about 4% annually through 2028 and 2% per year thereafter.
- Debt will fall to 97% of GDP by the end of Fiscal Year (FY) 2026 and 94% by 2034.
- Deficits will fall to $1.7 trillion (5.2% of GDP) by 2026 and $1.5 trillion (3.2% of GDP) by 2034.
- Primary deficits will fall to $660 billion (2.0% of GDP) by 2026 and turn to a $30 billion primary surplus (0.1% of GDP) by 2034.
- Implied nominal revenue will grow to above $5.5 trillion (17.0% of GDP) by 2026 and $8.2 trillion (17.7% of GDP) by 2034.
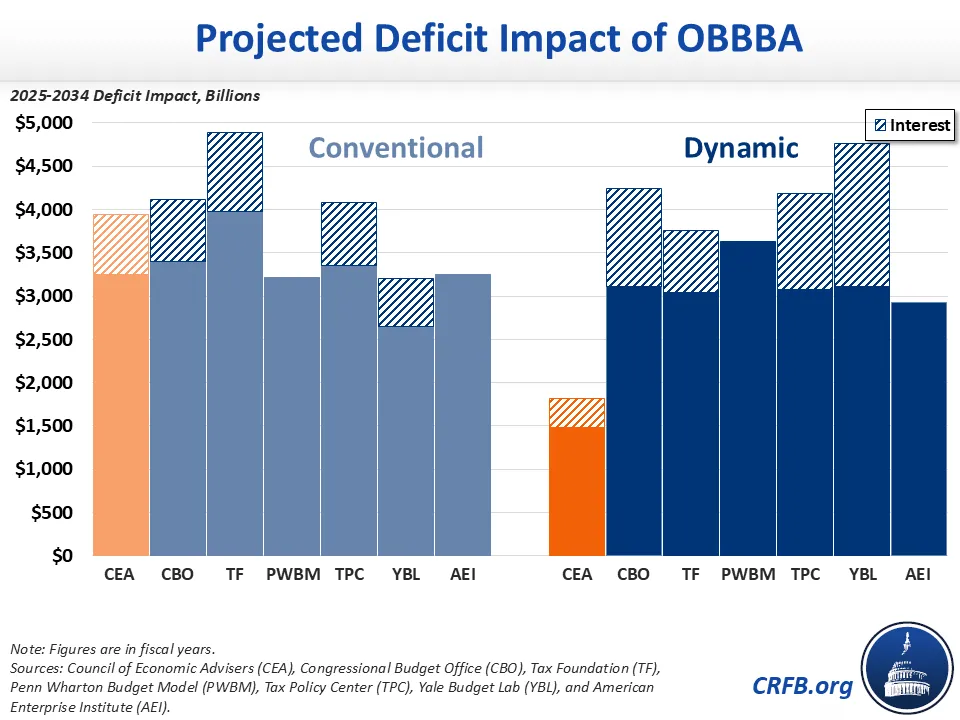
- The reconciliation bill will be responsible for adding $1.8 trillion to deficits between 2025 and 2034, net of dynamic effects.
CRFB will track these claims over time in the blog below, as well as in the linked Google Sheet. We will update this tracker and public spreadsheet in real time as new projections and data are released.
Importantly, whether actual outcomes are similar or different from projections is not necessarily indicative of the quality or accuracy of projections – in particular, the projected impact of specific legislative changes. Many changes unrelated to OBBBA or tariff policy – including legislative, administrative, and economic changes – can lead to different fiscal and economic outcomes.
All the projections currently included were made before the Supreme Court ruled that tariffs imposed under the International Emergency Economic Power Act (IEEPA) are unconstitutional. The Administration has said it will impose new tariffs under different legal authority, but tariff policy remains uncertain.
Last Updated: May 5, 2026
Gross Domestic Product
CEA projected that the economy, as measured by real GDP, will grow roughly 4% per year for the next four years (2025 through 2028) and 2% per year thereafter.3
Actual real GDP growth was around 2.2% for FY 2025 and grew at an annualized rate of 0.5% in the fourth quarter of 2025, and 2.0% in the first quarter of 2026.
CBO’s February 2026 Baseline projects real GDP growth of 2.3% and 2.0% in FY 2026 and 2027, respectively, before falling to 1.8% in 2028 and afterwards. These projections are in line with Federal Reserve forecasts – though the Fed expects 2% steady-state growth.
In the President’s Budget, OMB projected that real GDP will grow by 2.7% in fiscal year 2026 and 3.2% in 2027, and 2.9% per year in 2032 and beyond.
Roughly speaking, CEA foresees that real GDP will be 4% above CBO’s forecast (at $31 trillion in 2024 dollars) by the end of 2026 and 8% above that forecast (at $34 trillion) by the end of 2028. CEA’s projections are 5% above OMB’s by 2028, though below OMB’s by 2034.
Debt-to-GDP
CEA projected that debt held by the public as a share of the economy will hold steady around 98% of GDP for the next couple of years, decline to 96% by FY 2028, and further fall to 94% of GDP by 2034. Actual debt-to-GDP exceeded 99% in FY 2025 and is now above 100% of GDP.
Under CBO’s February 2026 Baseline that accounts for the estimated budgetary effects of OBBBA and other legislative and administrative actions taken in 2025 – but not changes to tariff policy since November 2025 (particularly as a result of the Supreme Court ruling) nor the recent bout of inflation – debt is projected to grow to 101% by the end of FY 2026 and 116% by 2034. OMB projects debt held by the public will peak at 102% of GDP in 2029 fall to 98% by 2034.
Deficits
CEA projected deficits would fall from $1.8 trillion in FY 2024 to $1.6 trillion in 2025, $1.7 trillion by 2026, and $1.5 trillion by 2034.
The actual deficit was $1.8 trillion in FY 2025.
Under CBO’s February 2026 Baseline, deficits will reach $1.9 trillion in 2026 and rise to $2.8 trillion by 2034. Under the President’s Budget, OMB projected deficits will peak at $2.1 trillion in 2026 before declining to $1.7 trillion by 2034.
As a share of the economy, CEA projected deficits will decline from 6.3% of GDP in FY 2024 to 5.2% in 2025 and 3.2% by 2034.
Actual deficits were 5.8% of GDP in FY 2025.
Under CBO’s February 2026 Baseline, deficits will hold steady at 5.8% in 2026, before rising to 6.5% by 2034. OMB projected deficits will rise to 6.4% of GDP in 2026 before falling to 3.6% by 2034.
Primary Deficits
CEA projected primary deficits – that is, deficits excluding interest – will fall from $950 billion in FY 2024 to $640 billion in 2025 and $660 billion by 2026; by 2034, CEA projected a $30 billion primary surplus.
The actual primary deficit was $805 billion in FY 2025.
Under CBO’s February 2026 Baseline, primary deficits will rise to $814 billion in 2026 and to $915 billion by 2034. OMB projects primary deficits will surpass $1.0 trillion in 2026, before falling to $195 billion by 2034.
As a share of the economy, CEA projected primary deficits will decline from 3.3% of GDP in FY 2024 to 2.1% in 2025, 2.0% by 2026, and a 0.1% primary surplus by 2034.
Actual primary deficits were 2.7% of GDP in FY 2025.
Under CBO’s February 2026 Baseline, primary deficits will total 2.6% in 2026 and 2.1% in 2034. OMB projects primary deficits will reach 3.3% of GDP in 2026, before falling to 0.4% by 2034.
Implied Revenue Levels
Although CEA did not project revenue levels explicitly, we can approximate them based on CEA’s projected changes in primary deficits and the details behind those projections.4
Based on this approximation, CEA projected nominal revenue levels would grow from $4.9 trillion in 2024 to $5.3 trillion in 2025, $5.5 trillion by 2026, and $8.2 trillion by 2034.
Actual revenue in 2025 was $5.2 trillion.
Under CBO’s February 2026 Baseline, nominal revenue will grow to $5.6 trillion in 2026 and $7.7 trillion by 2034. In the President’s Budget, OMB projects nominal revenue will total $5.5 trillion in 2026 and $8.9 trillion by 2034.
All of these figures include tariffs enacted by the Trump Administration under IEPPA authority which have since been ruled illegal by the Supreme Court.
As a share of the economy, CEA projections implied revenue will remain steady around 17% of GDP through 2029 and grow to 17.7% of GDP by 2034. These figures are in line with actual revenue and revenue projections – as CEA’s above-consensus revenue projections are roughly offset by their above-consensus GDP projections.
Federal revenue was 17.2% of GDP in 2025. CBO’s February 2026 Baseline projects revenue will rise to 17.5% of GDP in 2026 and to 17.7% of GDP by 2034. OMB projected revenues will fall to 17.1% of GDP in 2026 before rising to 18.6% of GDP by 2034.
All projections were made before the Supreme Court ruled that tariffs imposed under the IEEPA are illegal and before the Trump Administration responded with a new round of tariffs.
Deficit Impact of OBBBA
CEA estimated OBBBA will increase deficits by $1.8 trillion on a dynamic basis through 2034, with dynamic feedback covering over half of the $4.0 trillion conventional cost. CBO included a dynamic estimate of OBBBA in its February 2026 Baseline, which projects the law will cost slightly $4.2 trillion through 2034 on a dynamic basis (more than their $4.1 trillion conventional estimate). Other dynamic scores have ranged from $3.5 trillion to $4.0 trillion through 2034.
* * *
As new projections and data become available, we will continue to update our CEA Tracker and make adjustments where appropriate. The data will also remain available on our CEA Tracker Google Sheet, which will be updated as well.
1 CRFB's calculations are derived from the CEA’s “One Big Beautiful Chart Book.” Numeric values were reconstructed from the published graphics using hand measurement and thus might not precisely match CEA’s exact numbers, as CEA has not released the underlying data. In some cases, the figures do not appear to match stated numbers exactly -- for example, CEA’s graphics imply primary deficit reduction of more than $5.2 trillion through 2034, while they claim $5.1 trillion. Our figures are based on the graphs and not the claims.
2 OMB’s baseline projections can be found in chapter 12 of the Analytical Perspectives of the President’s FY 2017 Budget. By convention, baseline fiscal projections do not include the conventional fiscal impacts of policies proposed in the budget; but economic projections do assume these proposals are enacted, and there is dynamic feedback on the fiscal projections.
3 These annual growth rates are inferred from CEA’s report using constructed nominal and percent of GDP values. This method introduces an additional level of uncertainty when it comes to growth rates, so individual year figures may prove inexact, though estimates should be close over multi-year periods.
4 We assume deficit reduction from economic growth only effects revenue – this is a conservative assumption, as additional economic growth is likely to boost both revenue and spending and therefore increase revenue by more than the total deficit reduction.


