Our Top 21 Fiscal Charts of 2021
2021 was a busy year for fiscal policy, which gave us ample opportunities to conduct substantive policy analyses using charts and tables. This year, we published over 210 papers, blog posts, and other products. As we get ready to pop the champagne and ring in the new year, here are our top fiscal charts of 2021.
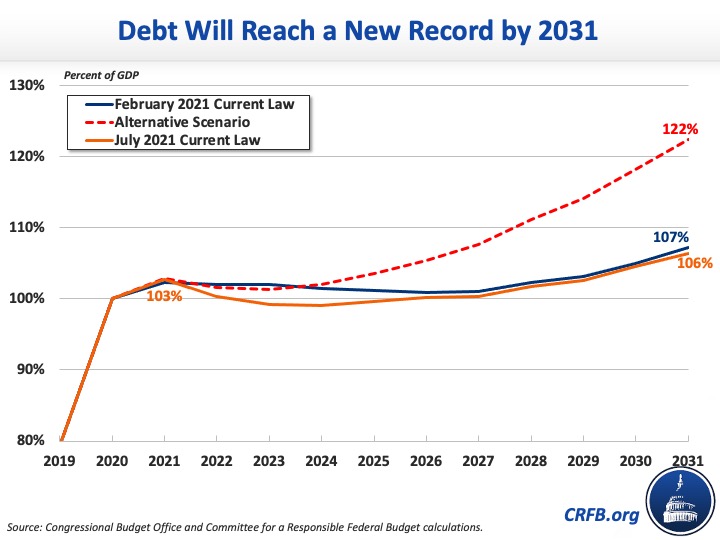
1. The National Debt is High and Rising
In July, the Congressional Budget Office (CBO) projected debt would rise from 100 percent of Gross Domestic Product (GDP) at the end of Fiscal Year (FY) 2020 to a record 106.4 percent of GDP by 2031. Under an alternative scenario where policymakers extend most expiring tax cuts and grow annual appropriations with the economy instead of inflation, debt would reach 122 percent of GDP by FY 2031.
Since this chart was published, we revised our debt projections to account for the enactment of the Infrastructure Investment and Jobs Act (IIJA), changes to Supplemental Nutrition Assistance Program (SNAP) benefits, and a lower-than-expected deficit in FY 2021. We estimate that under current law debt will reach a record 107.5 percent of GDP by the end of FY 2031.
2. The Budget Deficit Totaled $2.8 Trillion in 2021
In July, CBO projected the FY 2021 deficit would total $3.0 trillion. From there, CBO projected the deficit would fall to $1.2 trillion in FY 2022 and $753 billion in 2024 as COVID relief winds down and then rise gradually to $1.9 trillion by 2031. Since this chart was published, CBO updated its FY 2021 deficit figure to reflect the actual year-end deficit of $2.8 trillion.

3. Major Trust Funds Are Approaching Insolvency
In our paper “The Case for Trust Fund Solutions,” we estimated the Highway Trust Fund would become insolvent in FY 2022, the Medicare Hospital Insurance (HI) trust fund in FY 2026, the Social Security Old-Age and Survivors Insurance (OASI) trust fund in calendar year (CY) 2032, and the Social Security Disability Insurance (SSDI) trust fund in CY 2035.
Since this chart was published, the Medicare and Social Security Trustees released their annual reports. Now, the HI trust fund is expected to be insolvent in CY 2026, the OASI trust fund in CY 2033, and the SSDI trust fund in CY 2057. On a theoretical combined basis, the Social Security trust funds will be insolvent in CY 2034. Meanwhile, the insolvency date of the Highway Trust Fund has been pushed back due to enactment of the Infrastructure Investment and Jobs Act.

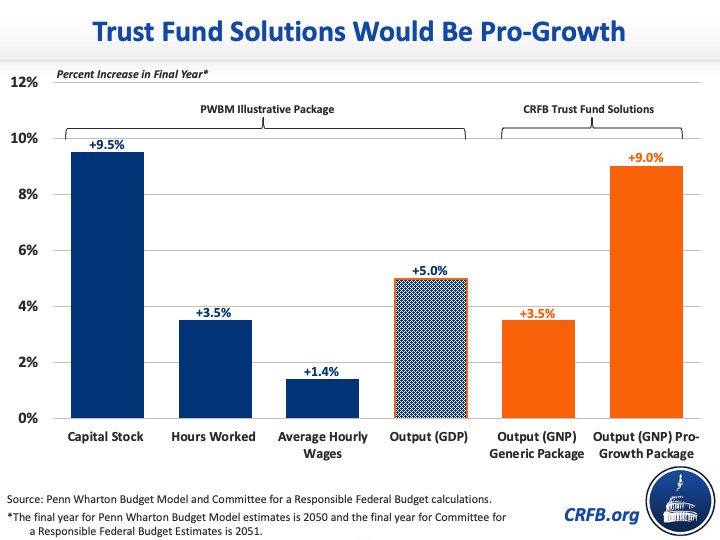
4. Trust Fund Solutions Would Be Pro-Growth
Making the Social Security, Medicare, and highway trust funds solvent would not only prevent sharp benefit cuts and improve the fiscal outlook, but would actually grow the economy. We found that trust found solutions would increase economic output by between 3.5 and 9.0 percent and reduce debt by between 65 and 80 percent of GDP by 2051.
5. You Can Now Set Priorities and Budget for the Future
In May, the Committee for a Responsible Federal Budget launched Budgeting for the Future, a suite of interactive games related to the federal budget and budget prioritization. The games are meant to inform users about the federal budget and give them an opportunity to share their own knowledge and express their own preferences. The five games are Budget Personality, Boomers vs Zoomers, Budget IQ, Paying the Tab, and More or Less.

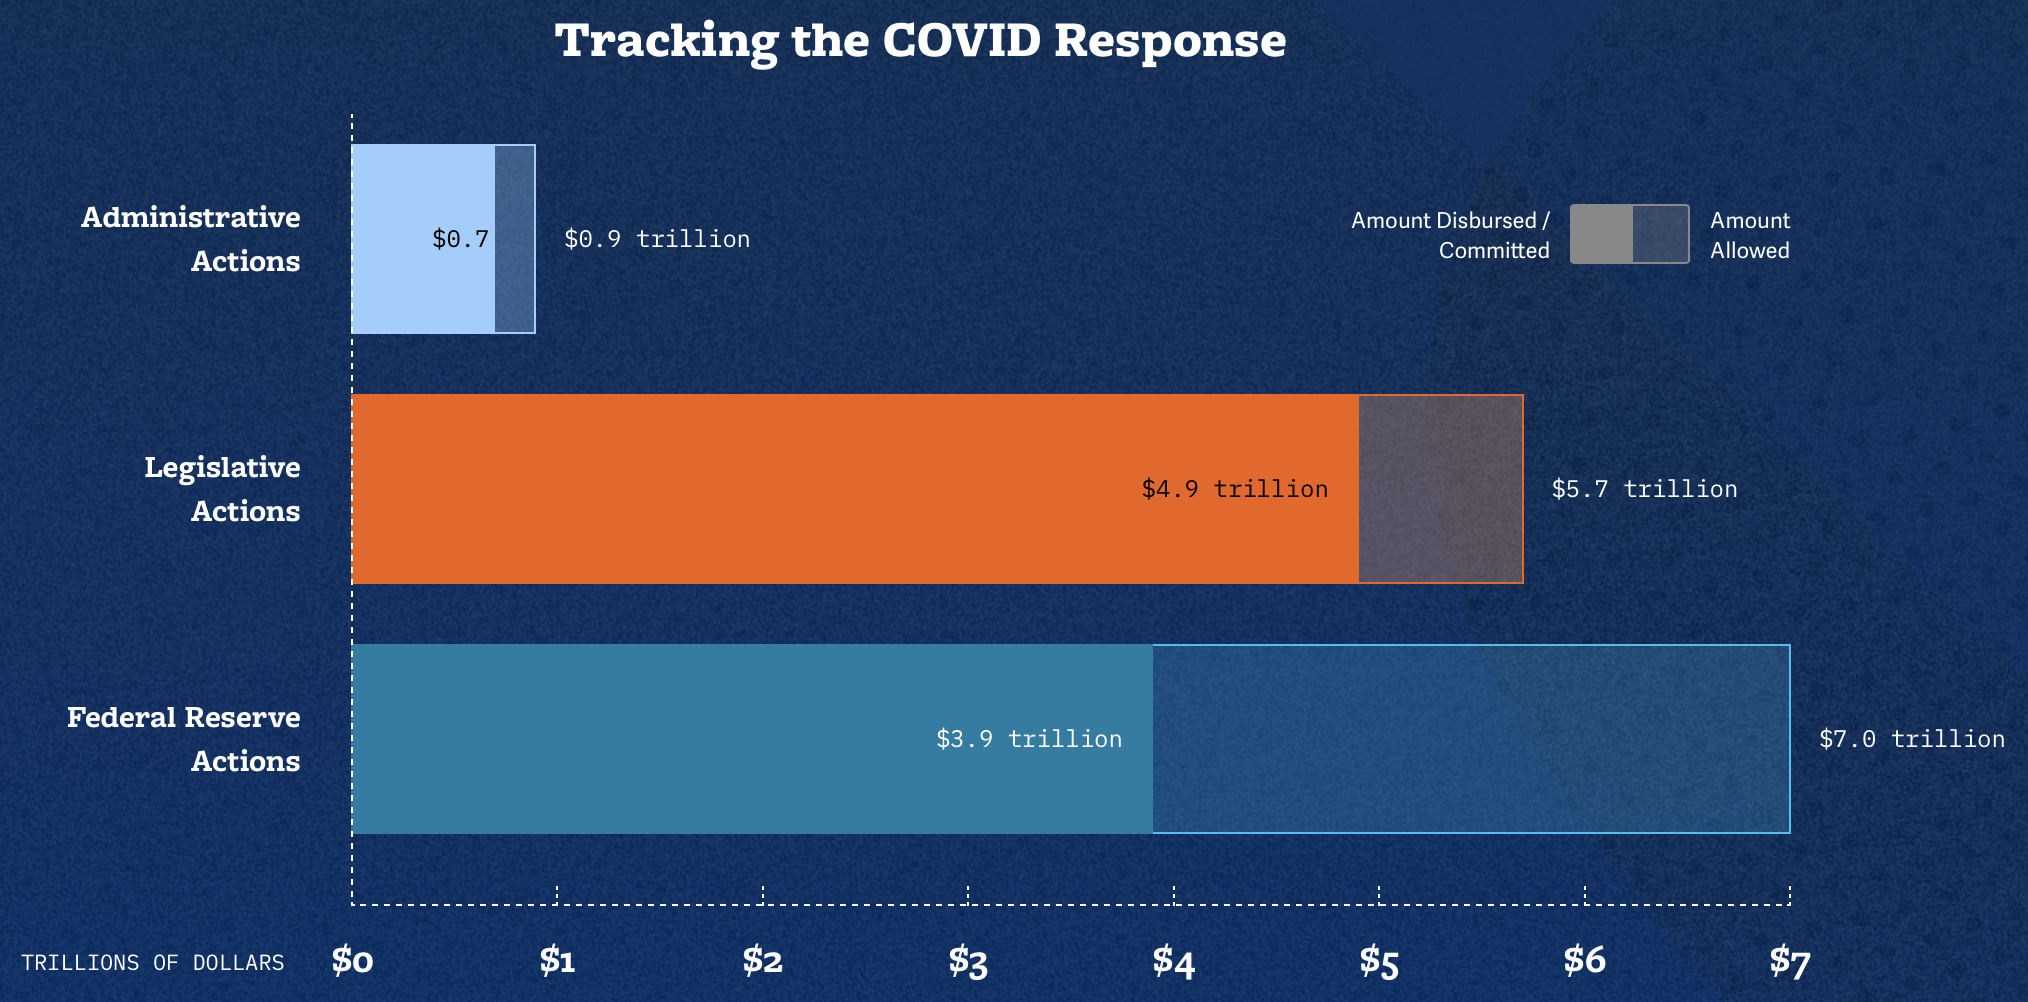
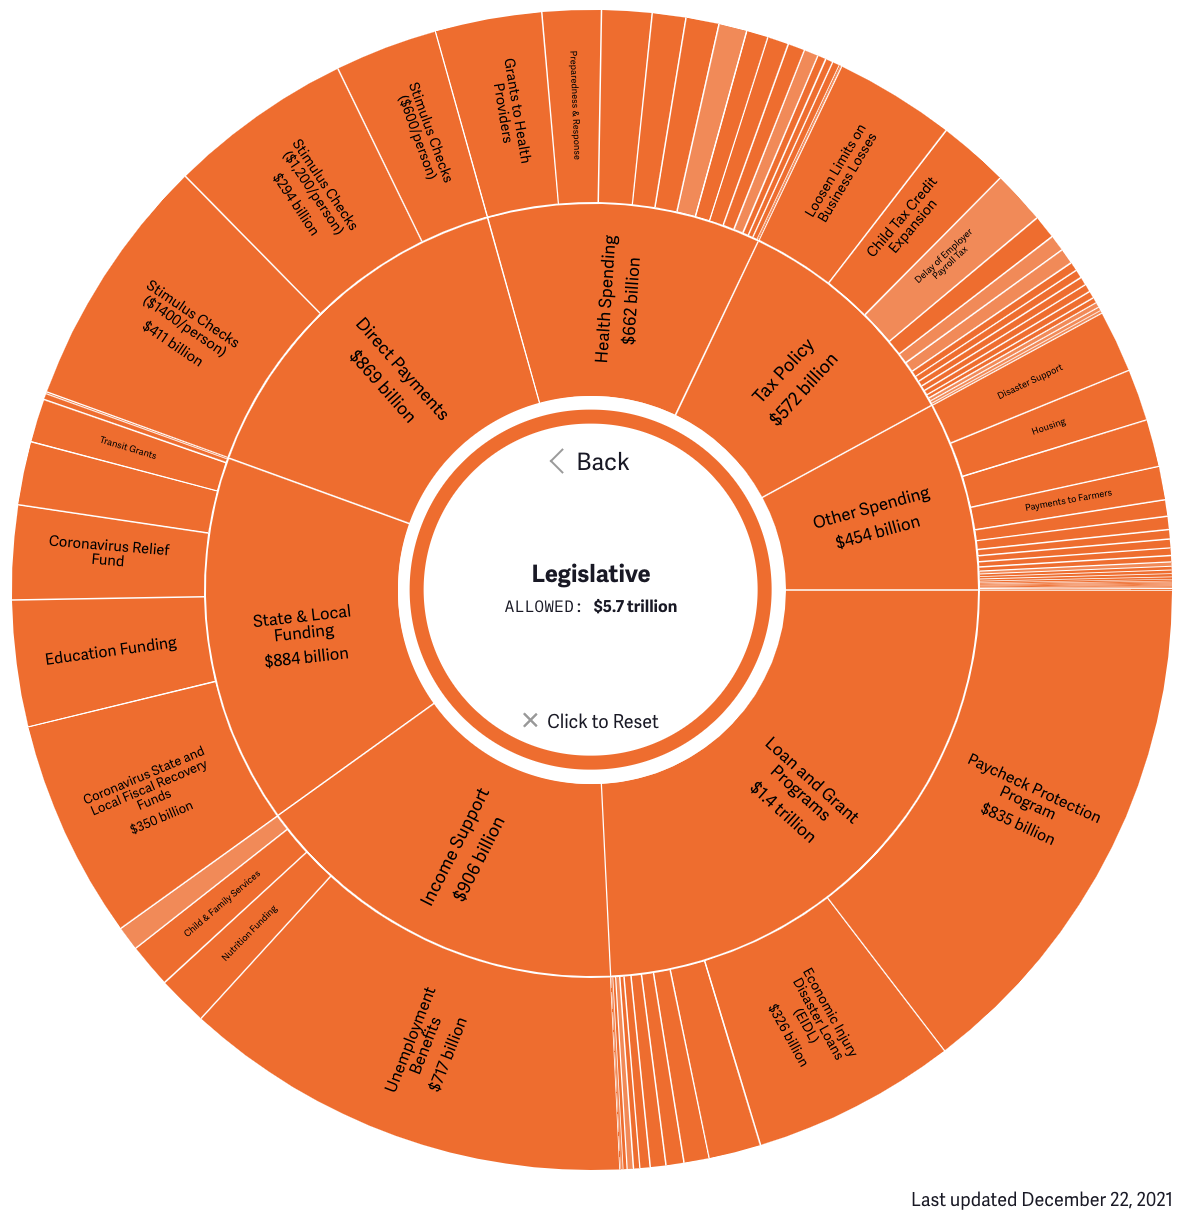
6. You Can Continue to Track COVID Relief Dollar by Dollar
The Committee for a Responsible Federal Budget continued to update our interactive COVID Money Tracker tool. At COVIDMoneyTracker.org, users can follow every major action taken by Congress, the Administration, the Federal Reserve, and various federal agencies in response to the COVID-19 pandemic. We updated the tool throughout 2021 to account for the COVID relief provisions in the December 2020 Response and Relief Act, COVID-related executive actions taken by President Biden, and the American Rescue Plan Act. Legislatively, Congress has allocated roughly $5.7 trillion for COVID relief, of which $4.9 trillion has already been spent or committed.
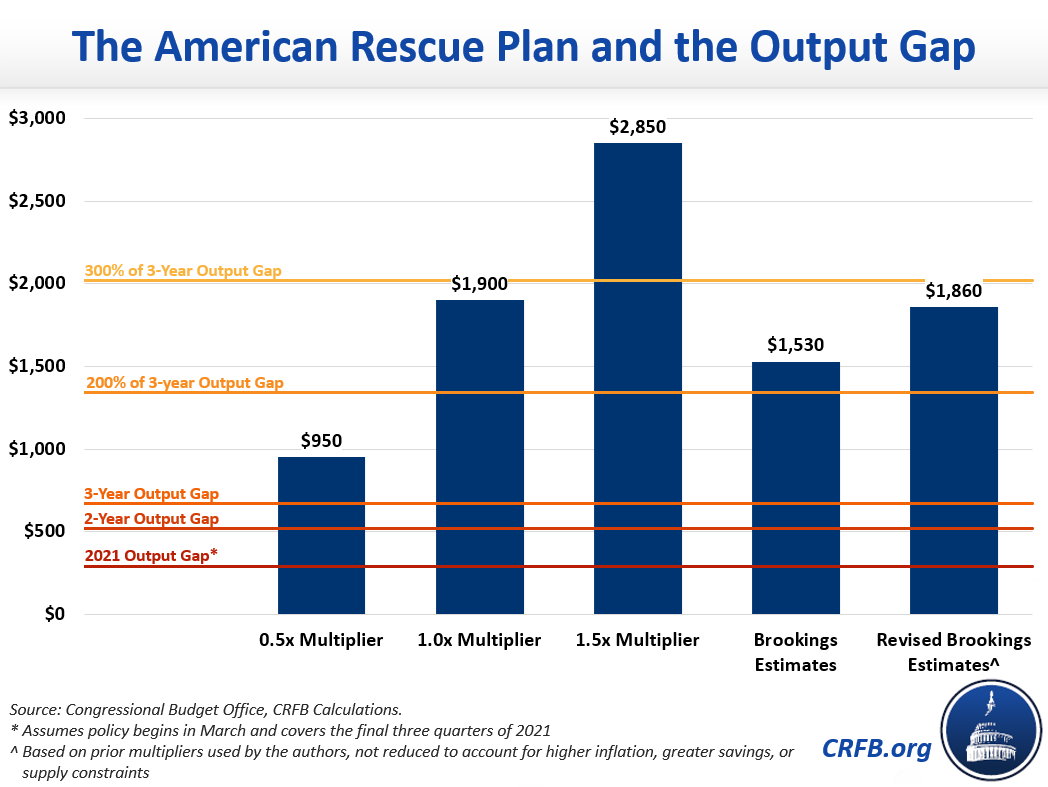
7. The American Rescue Plan Provided More Relief Than Was Needed
In February, we estimated the country faced a $380 billion output gap for the remainder of 2021 and a nearly $700 billion output gap through 2023. We estimated the $1.9 trillion American Rescue Plan would be enough to close the output gap several times over. While an overshoot was beneficial in some ways, we explained at the time that it could also add to the debt without improving the economy, lead to higher inflation, cause misallocations in the economy, and contribute to an economic cliff or crash.
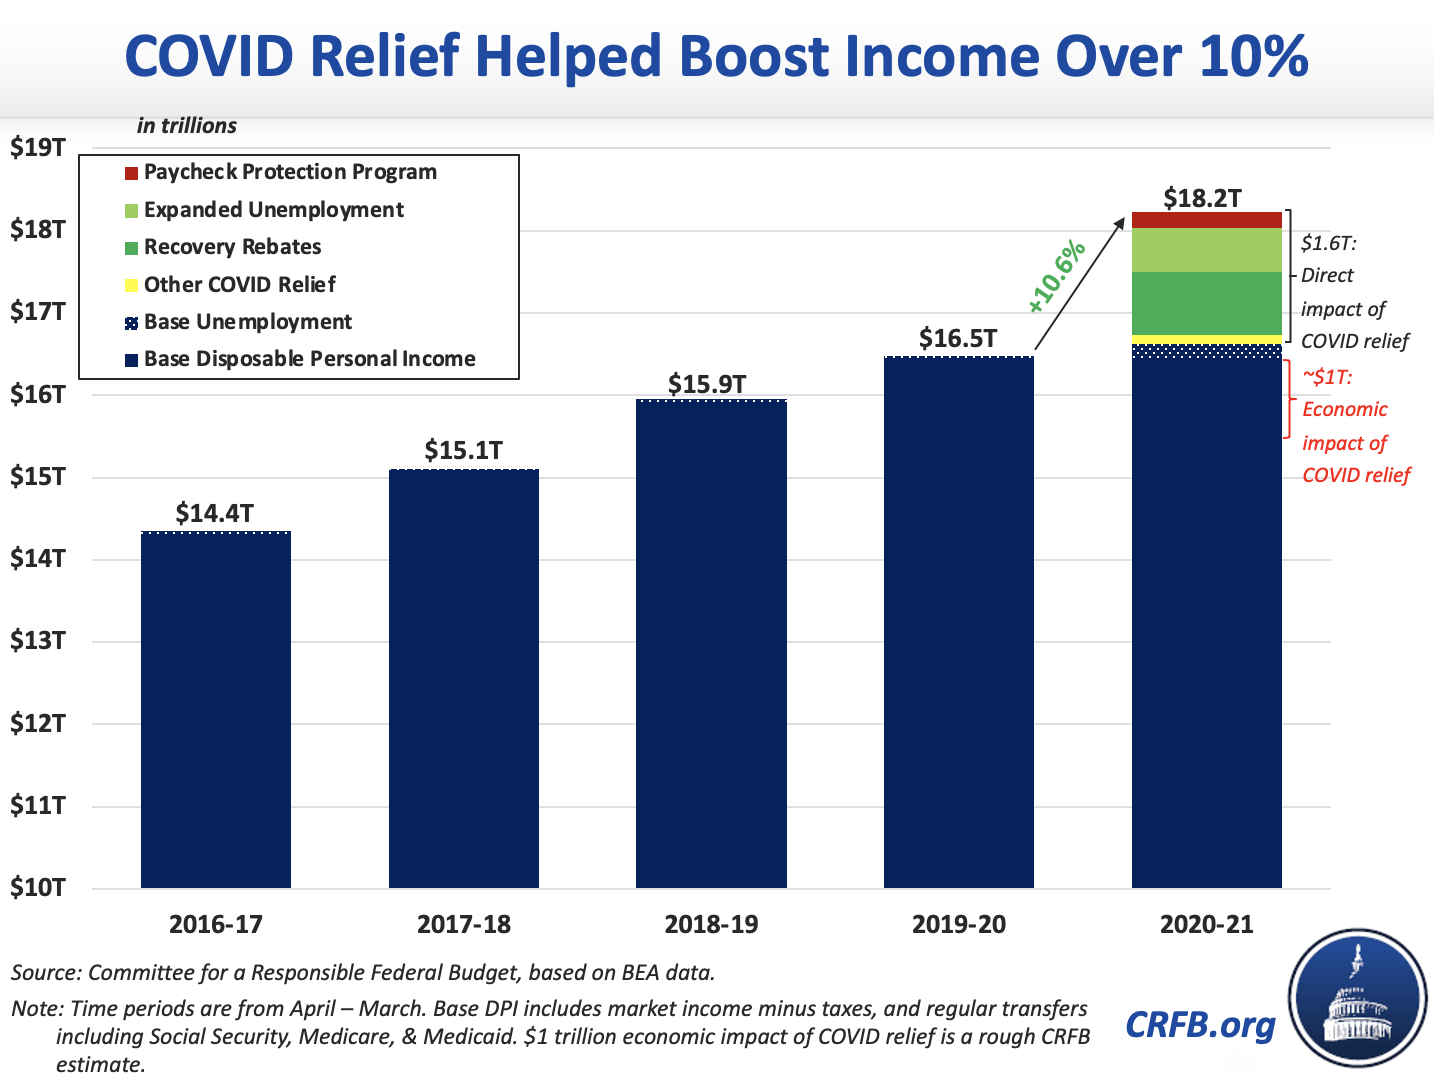
8. Personal Income Grew Massively During the COVID Pandemic
Total nominal Disposable Personal Income grew by 10.6 percent, or $1.8 trillion, from the 12 months before April 2020 to the 12 months through April 2021. This massive income growth was attributable to COVID relief and prior law unemployment benefits; absent these factors and their economic effects, we estimate personal income would have fallen by about 5 percent, or $1 trillion, over the April 2020 to April 2021 period.
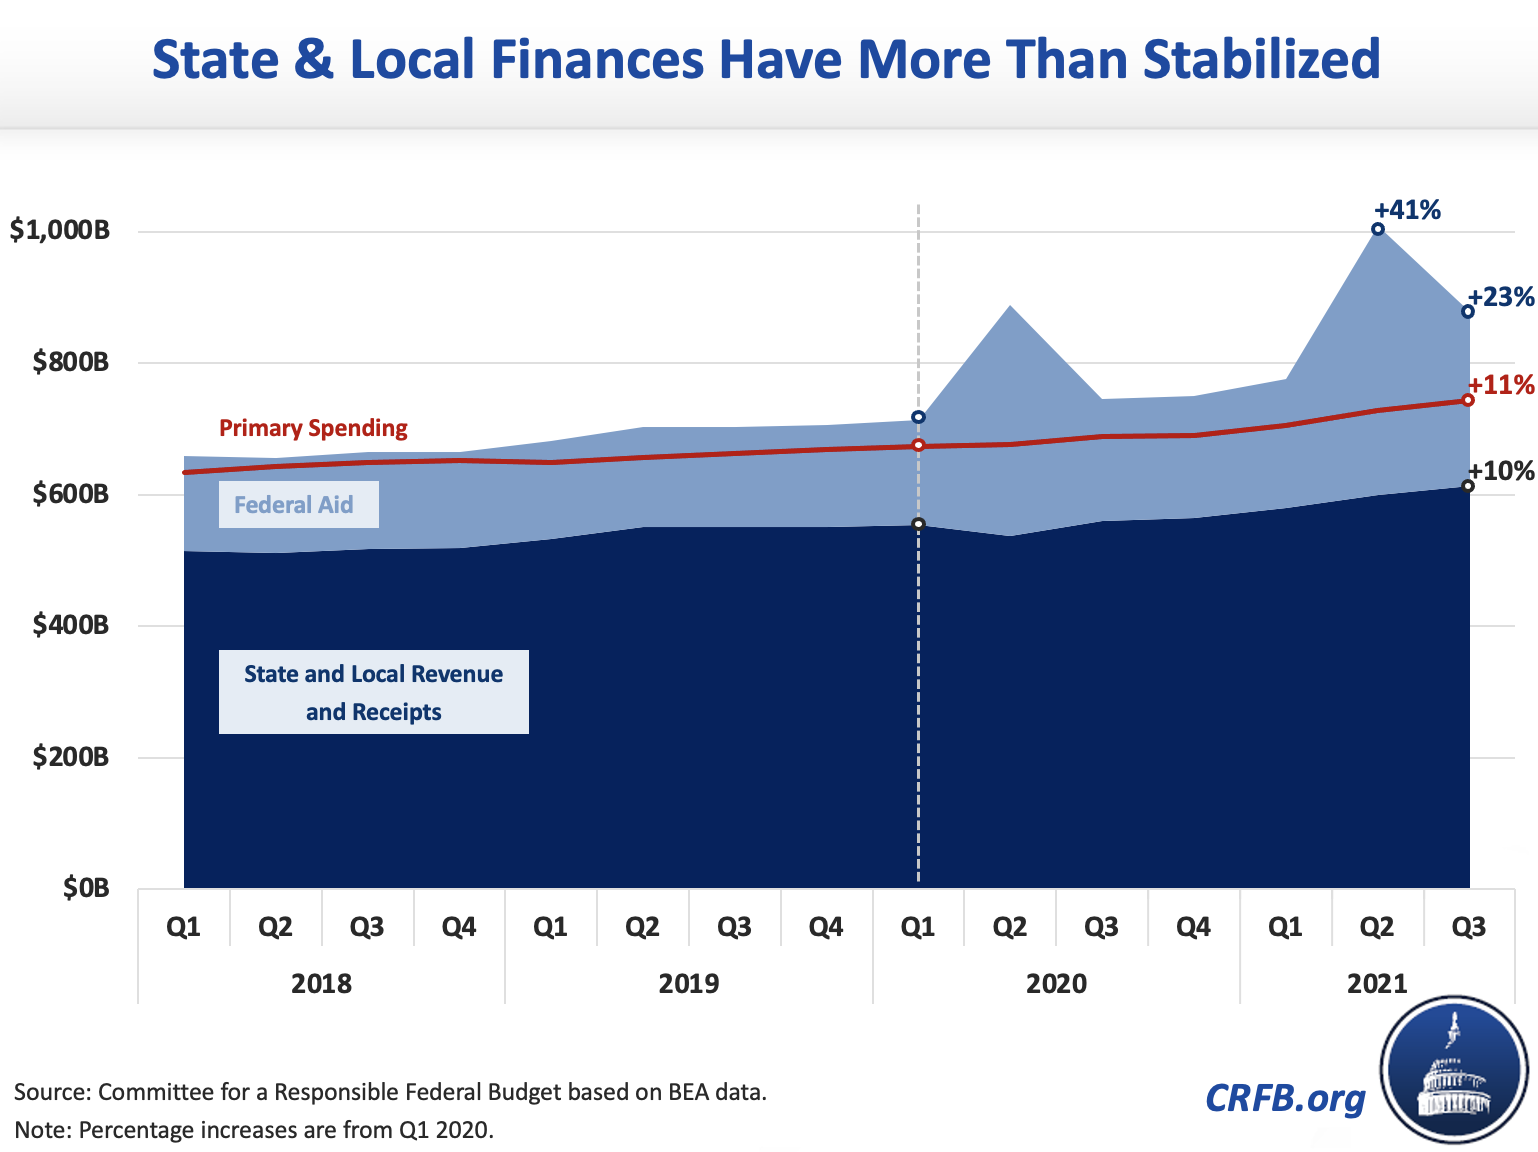
9. State and Local Governments Are Flush with Cash Thanks to COVID Relief
Bureau of Economic Analysis data for the third quarter of 2021 showed that state and local government spending was 23 percent above its pre-pandemic level and 16 percent above its pre-pandemic trend in the three-month period from July through September. This was the net result of massive federal transfer payments from COVID relief legislation and a strong economic recovery. In total, Congress allocated $885 billion of direct aid to state and local governments and entities through various COVID relief bills. You can explore all of this support broken down by state at COVIDMoneyTracker.org.
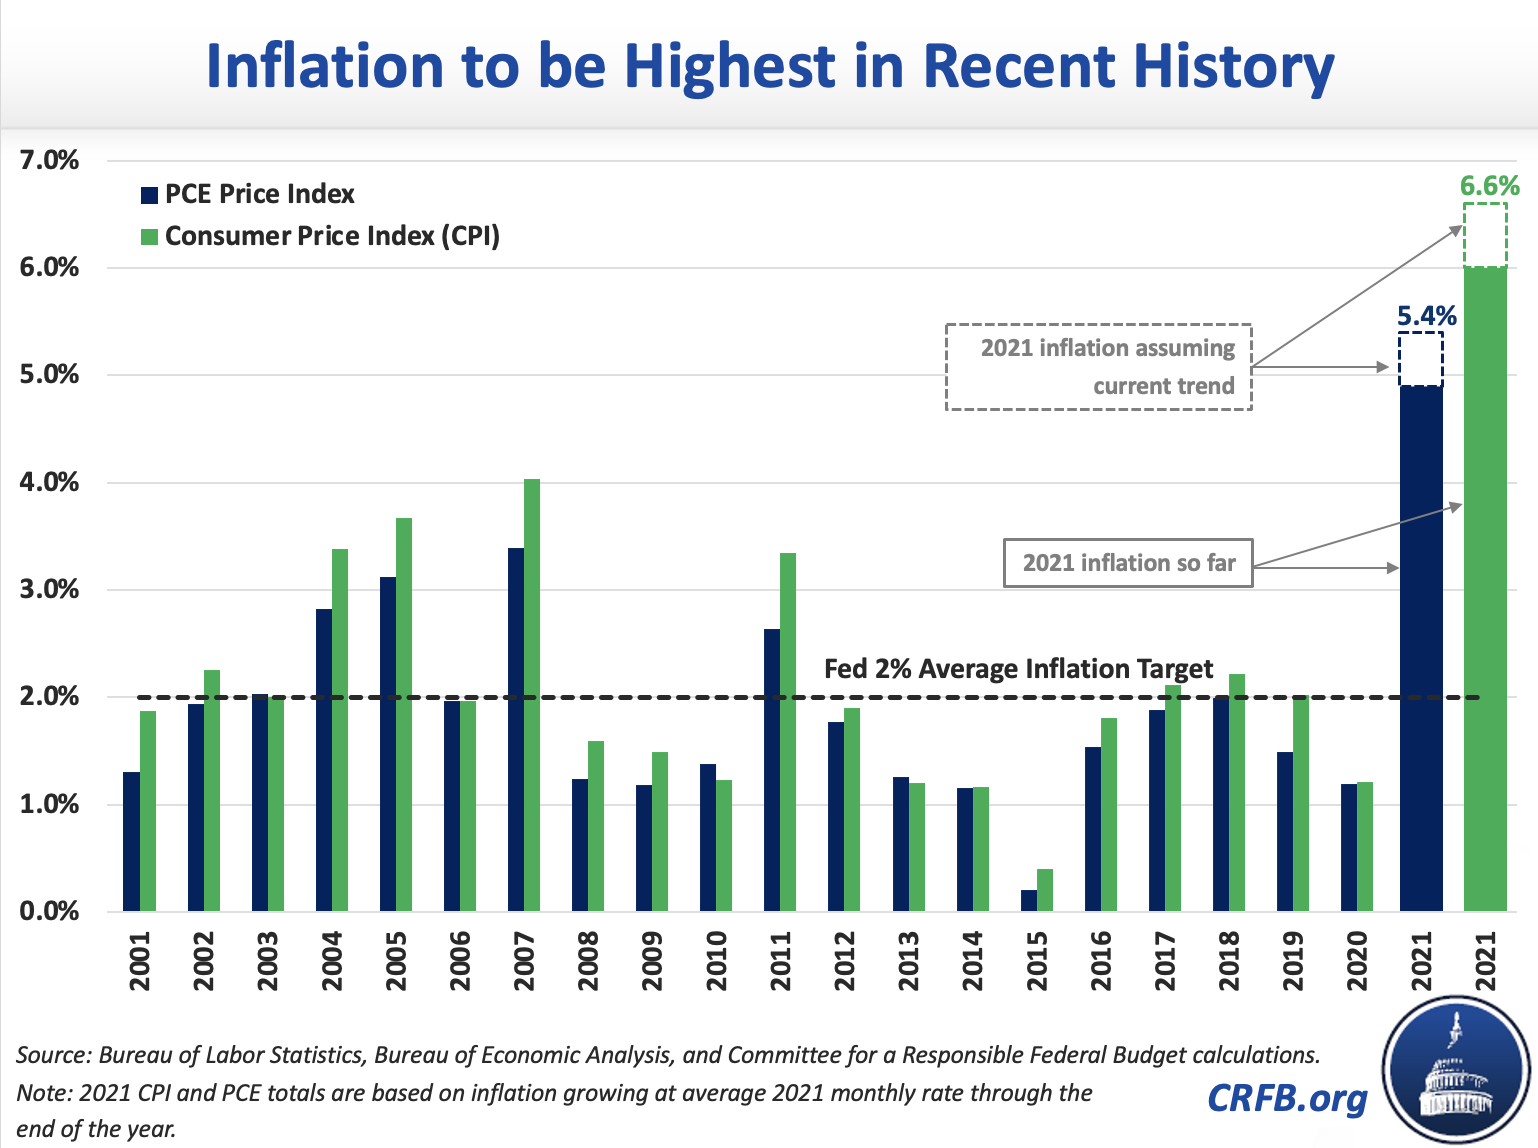
10. Inflation to be Its Highest Since 1990
For 2021, Consumer Price Index (CPI) inflation is likely to be between 6.0 and 6.6 percent, while the Personal Consumption Expenditure (PCE) price index is likely to grow by 4.9 to 5.4 percent. These inflation rates are extremely high when compared to their historic averages over the past decade, the Federal Reserve’s 2 percent inflation target, forecasts made earlier in 2021, or international comparisons.
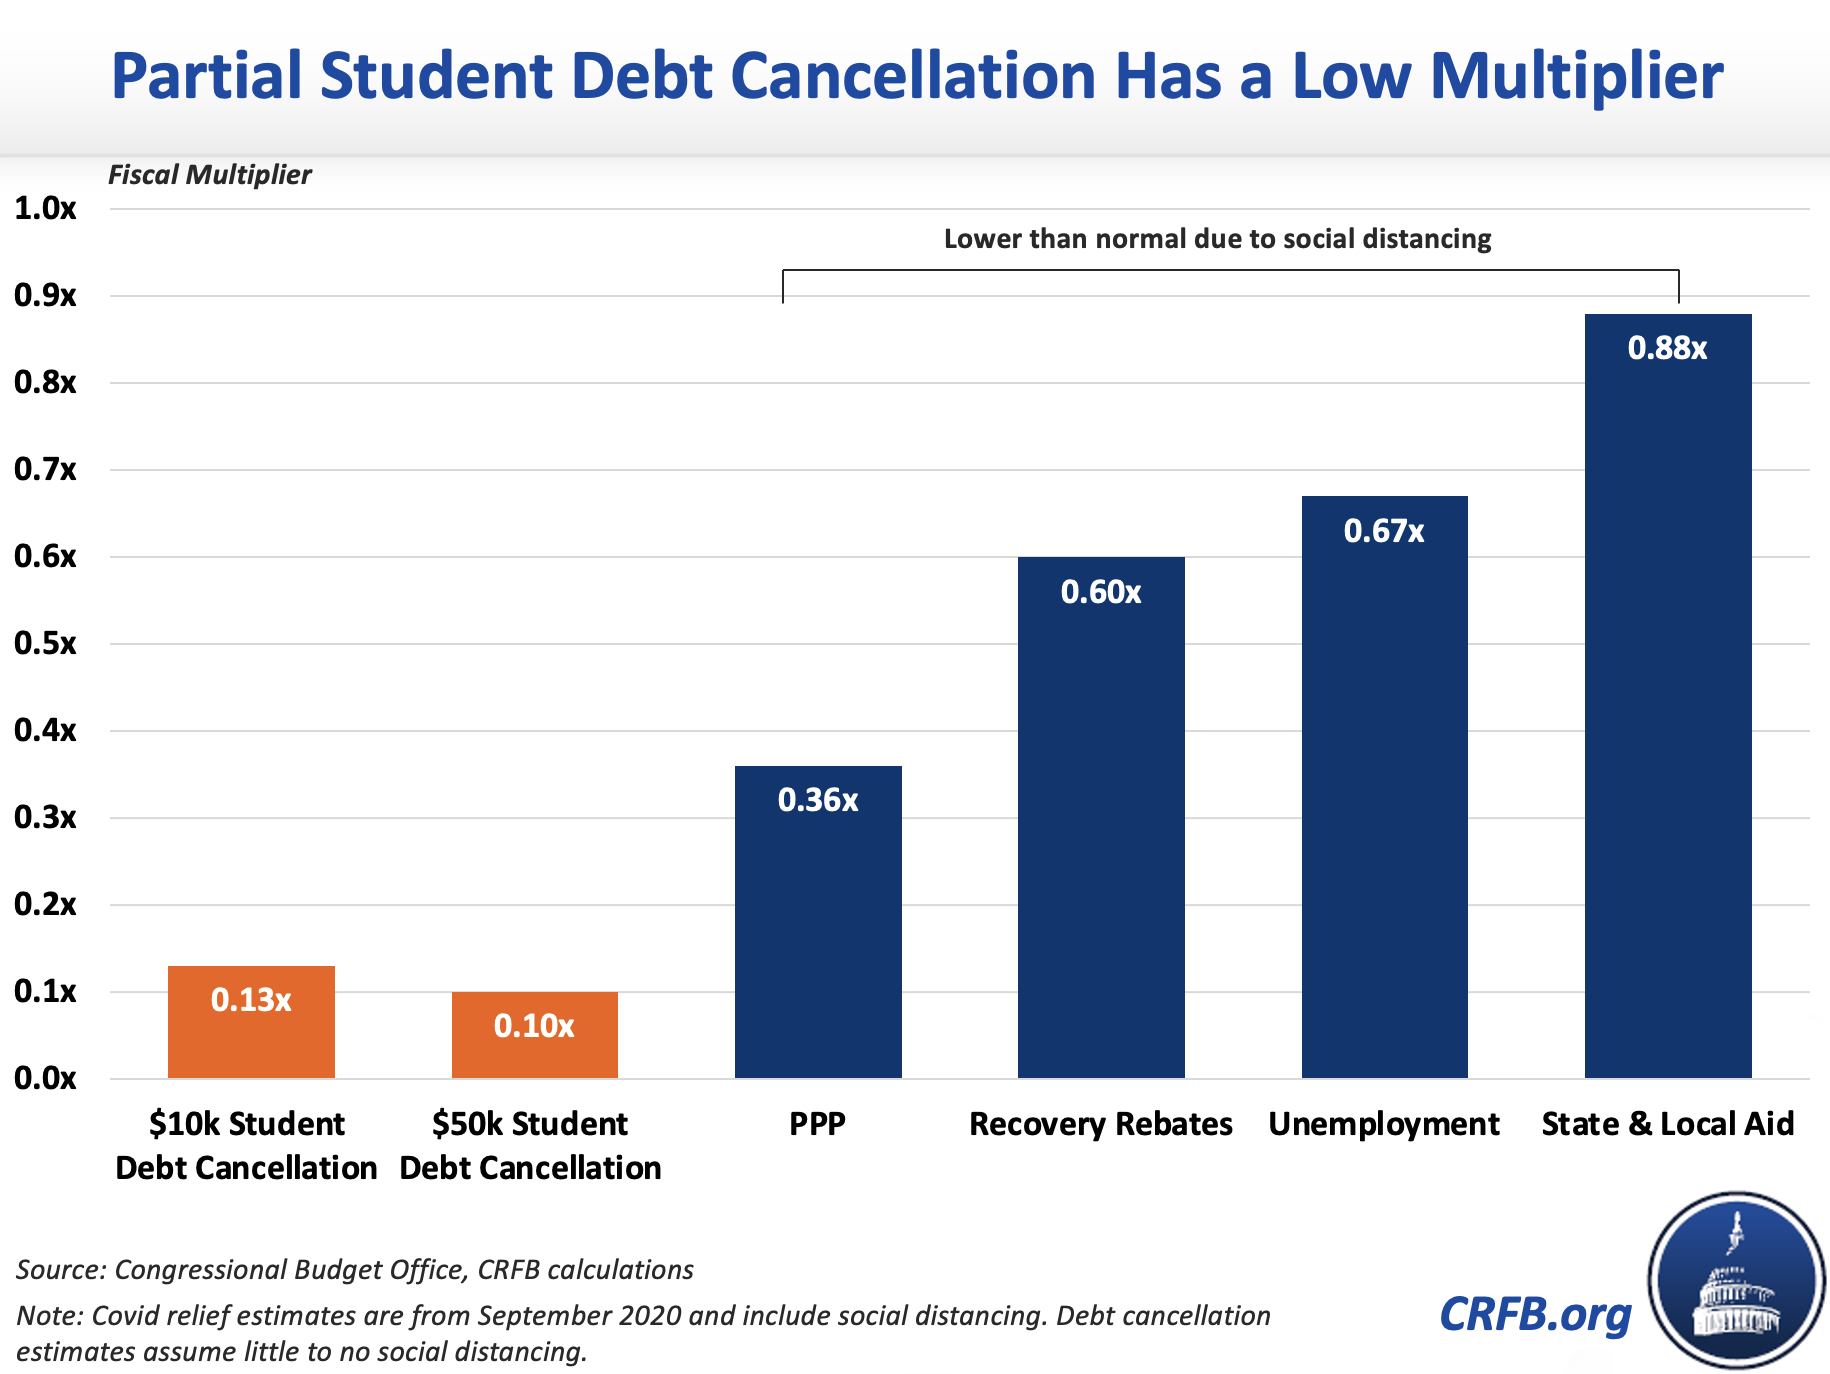
11. Partial Student Debt Cancellation is Poor Economic Stimulus
Proposals to cancel up to $10,000 or $50,000 of federal student loan debt were introduced as ways to support the recovery from the COVID-19 crisis. We estimated that $10,000 or $50,000 of student loan forgiveness would have fiscal multipliers of only 0.13x and 0.10x, respectively. Because debt forgiveness only boosts income slowly and is poorly targeted to those most likely to spend, it does not make for good economic stimulus – even when the economy is well below potential.
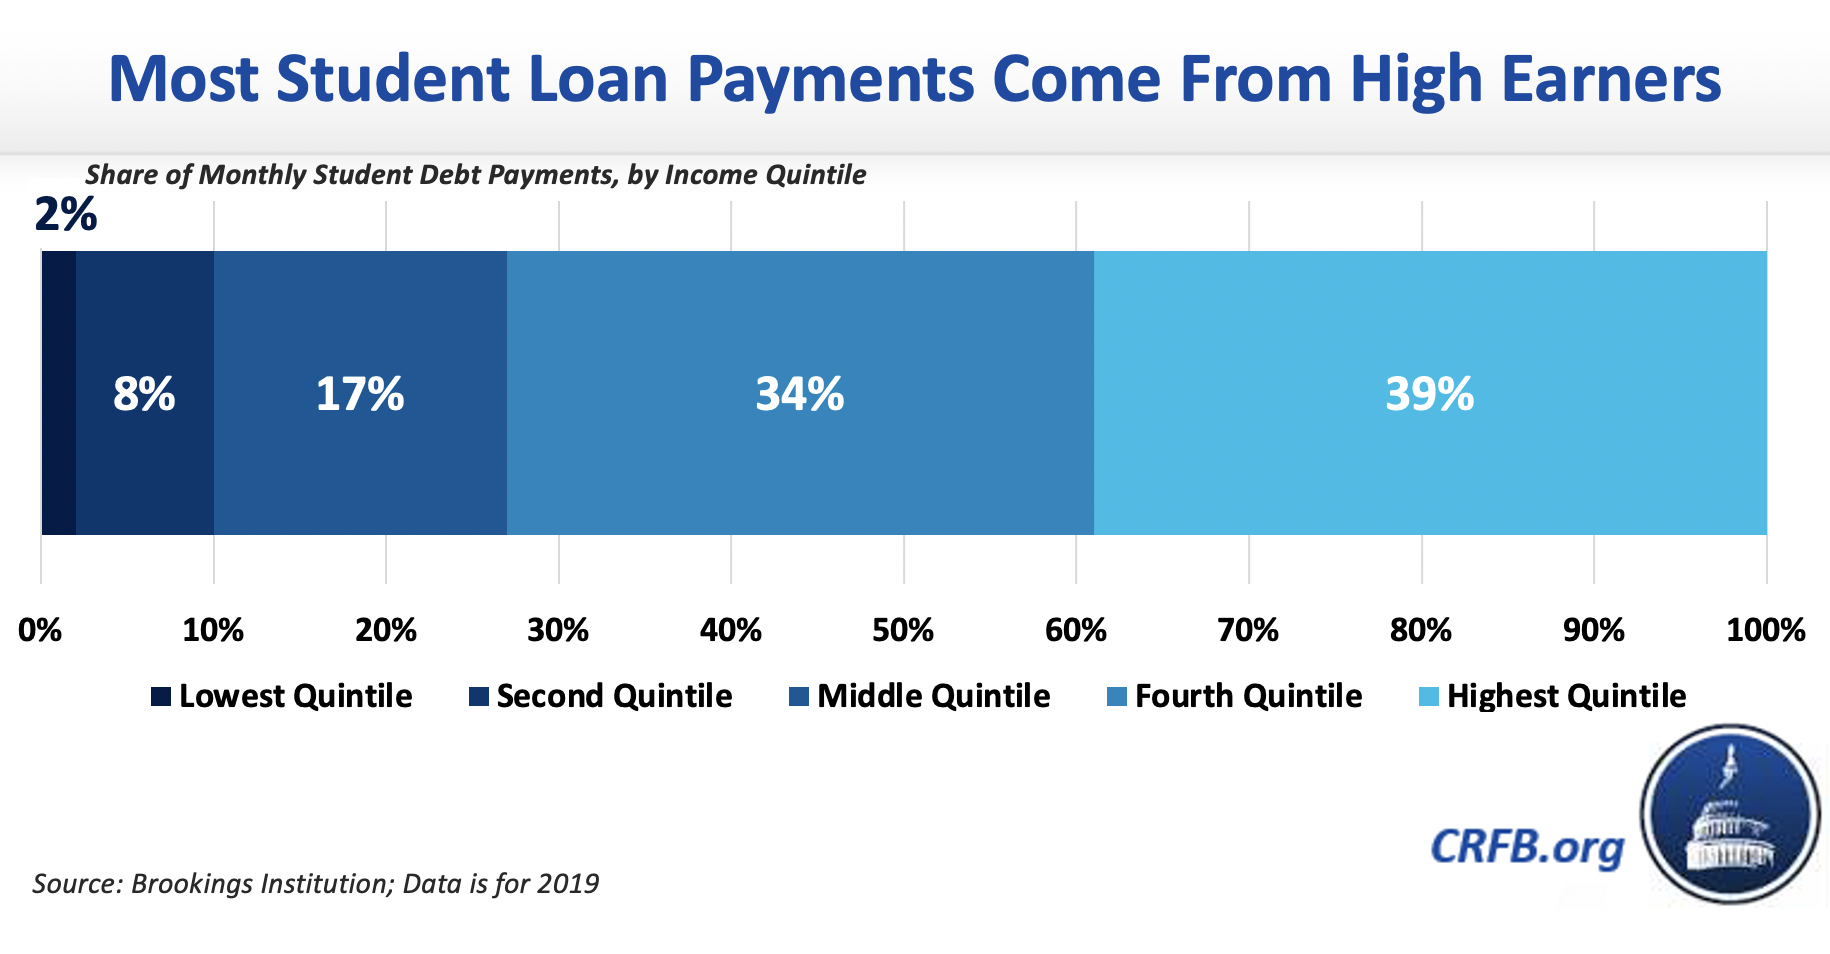
12. Student Loan Payment Pauses Benefit High Earners
The Biden Administration recently extended the student loan moratorium through May 1, 2022, under which student loan borrowers do not need to make payments on their loans and interest does not accrue. We showed that not only is this moratorium expensive, but it is also regressive since it benefits those who borrowed more, and those who borrowed more tend to be more highly-educated and have higher incomes.
13. The Tax Gap is Large
Every year, a large share of taxes owed are never paid. The Treasury Department estimated a “gross tax gap” of $630 billion in tax year 2019, with over $3.6 trillion of taxes owed but only about $3 trillion paid voluntarily. Once $76 billion of additional revenue from Internal Revenue Service (IRS) enforcement activities and late payment were included, the “net tax gap” totaled $554 billion in 2019. Closing the tax gap and improving tax compliance is a priority for the Biden Administration.

14. Republican and Democratic Presidents Support Reducing the Tax Gap
Reducing the tax gap is one of the fairest and most efficient ways to raise revenue, and it has a long history of bipartisan support. Earlier this year, President Biden put forth a robust set of proposals to reduce the tax gap in his FY 2022 budget. Before him, every President from Ronald Reagan to Donald Trump, regardless of party, has included proposals to reduce the tax gap in their budgets.

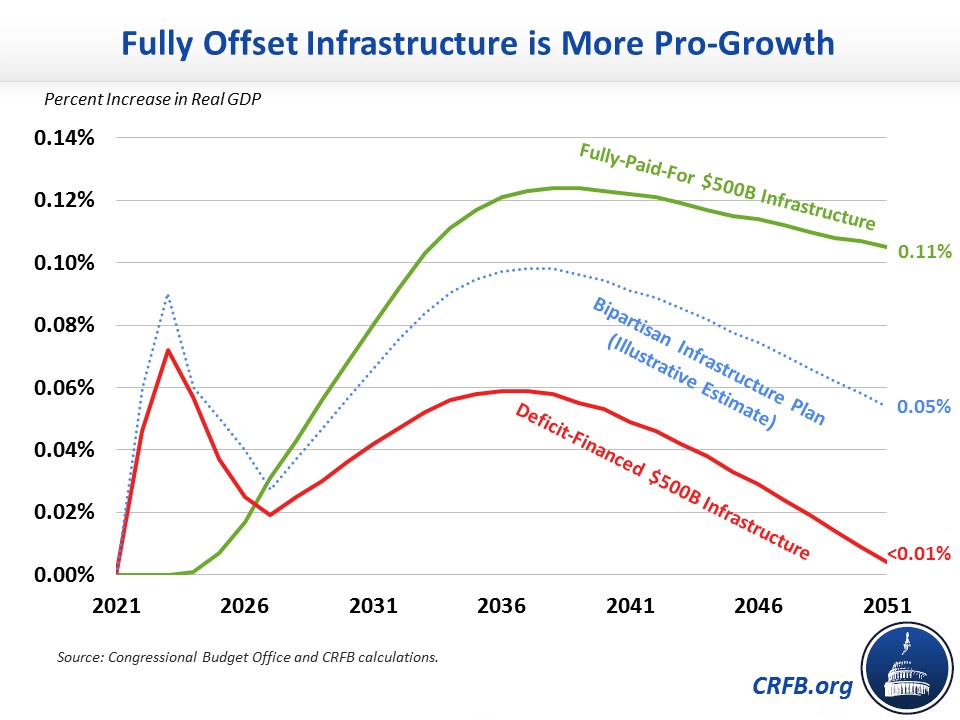
15. Infrastructure is More Pro-Growth When It's Paid For
While infrastructure investment can help boost economic growth, adding to the national debt burden will mute these gains. Recent CBO estimates find that $500 billion of paid-for infrastructure would boost GDP by 0.12 percent after 15 years and 0.11 percent after three decades. Meanwhile, $500 billion of deficit-financed infrastructure would increase GDP by only 0.06 percent after 15 years and almost nothing after three decades. Using this data, we estimated the Infrastructure Investment and Jobs Act – which is partially offset – would boost real GDP by 0.1 percent at peak and 0.05 percent by 2051.
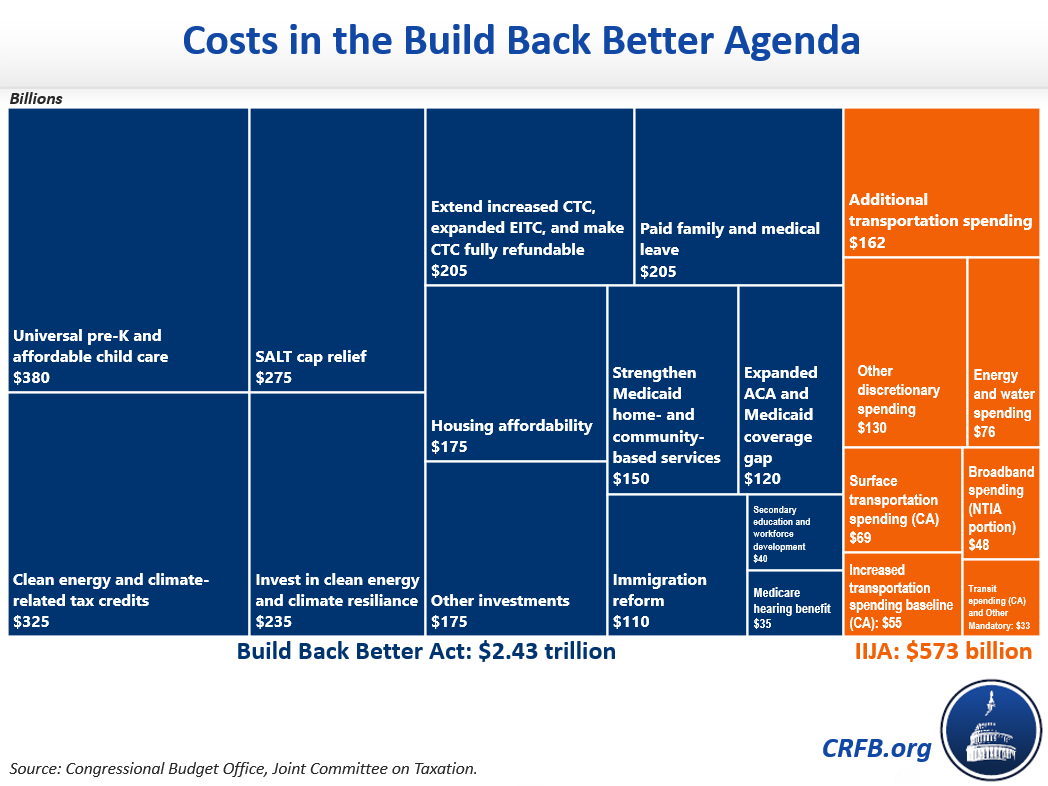
16. The Build Back Better Agenda Includes $3.0 Trillion of Costs
The House-passed Build Back Better Act and the Infrastructure Investment and Jobs Act constitute President Biden’s Build Back Better agenda in legislative form. To show the costs within the two bills, we created a visual breaking out the over $3.0 trillion of policies included in the agenda.
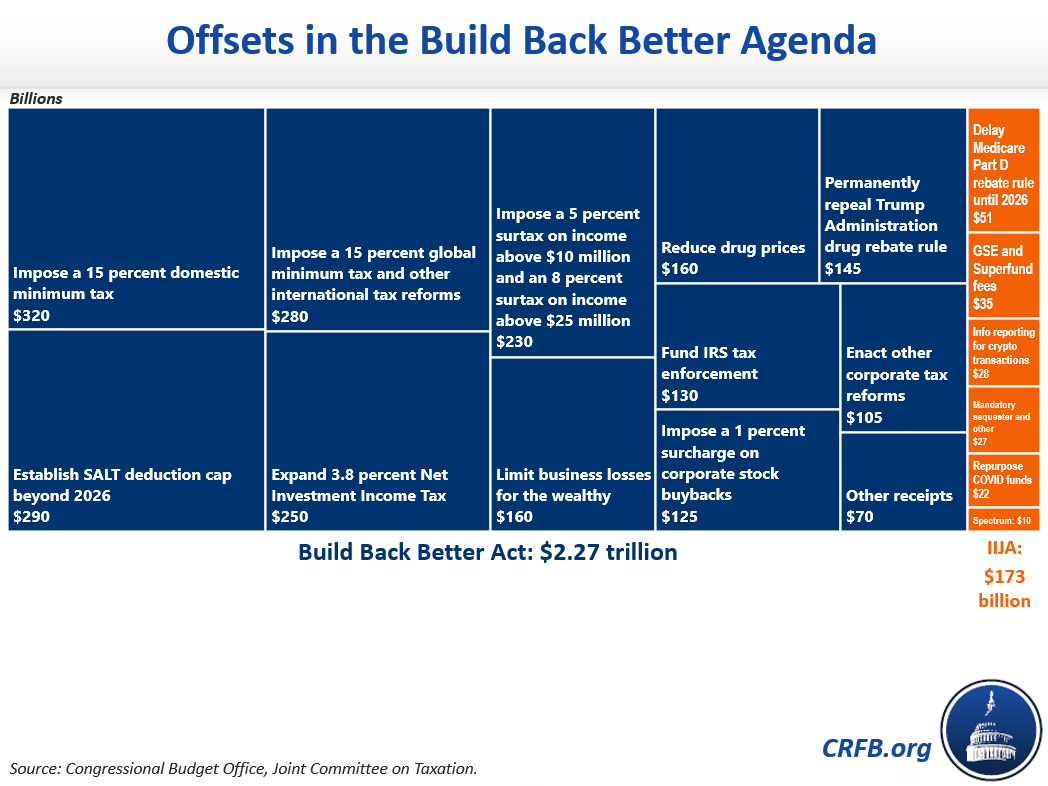
17. The Build Back Better Agenda Includes $2.4 Trillion of Offsets
The House-passed Build Back Better Act and the Infrastructure Investment and Jobs Act constitute President Biden’s Build Back Better agenda in legislative form. To show the offsets within the two bills, we created a visual breaking out the over $2.4 trillion of offsetting policies in the agenda.
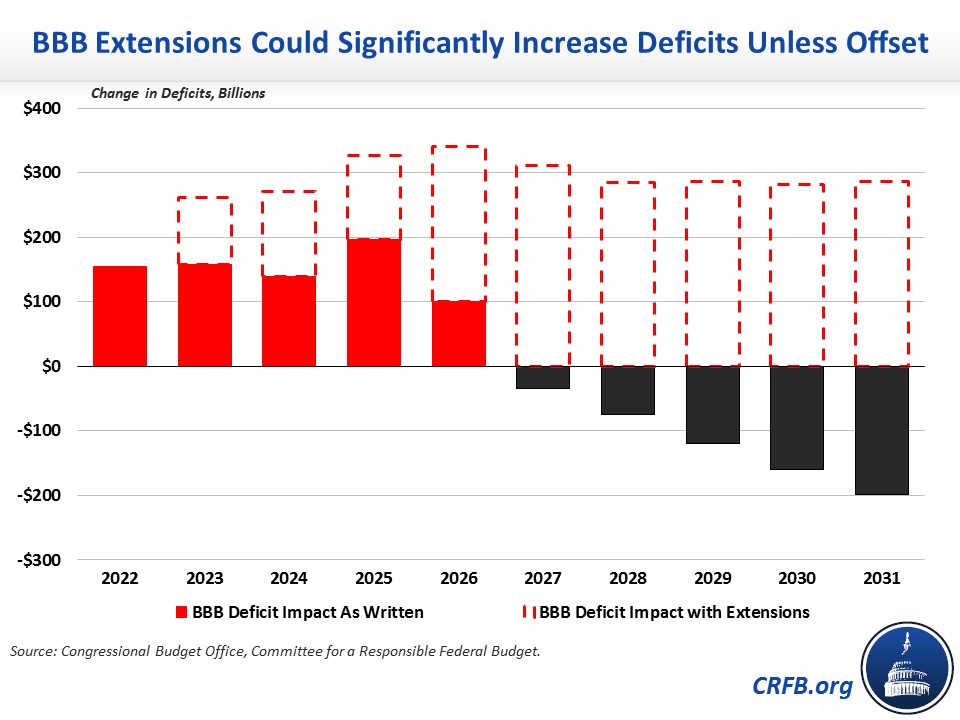
18. The Build Back Better Act Relies on Arbitrary Sunsets and Expirations to Reduce It's Reported Cost
The House-passed Build Back Better Act relies on a number of sunsets and arbitrary expirations to keep the legislation’s potential cost down. Based on CBO’s score of the House-passed Build Back Better Act, we found that making the bill’s temporary policies permanent would nearly double the cost of the legislation from over $2.4 trillion to nearly $4.8 trillion. As a result, the deficit impact would increase from $158 billion to $2.8 trillion.
Following this analysis, CBO released an estimate of how much it would cost to make most temporary provisions in the House-passed Build Back Better Act permanent. CBO found a permanent version of the Build Back Better Act with no further offsets would increase the gross cost of the bill from over $2.4 trillion to over $4.7 trillion. CBO found the deficit impact of a permanent Build Back Better Act would increase from $158 billion to $2.8 trillion without additional offsets.
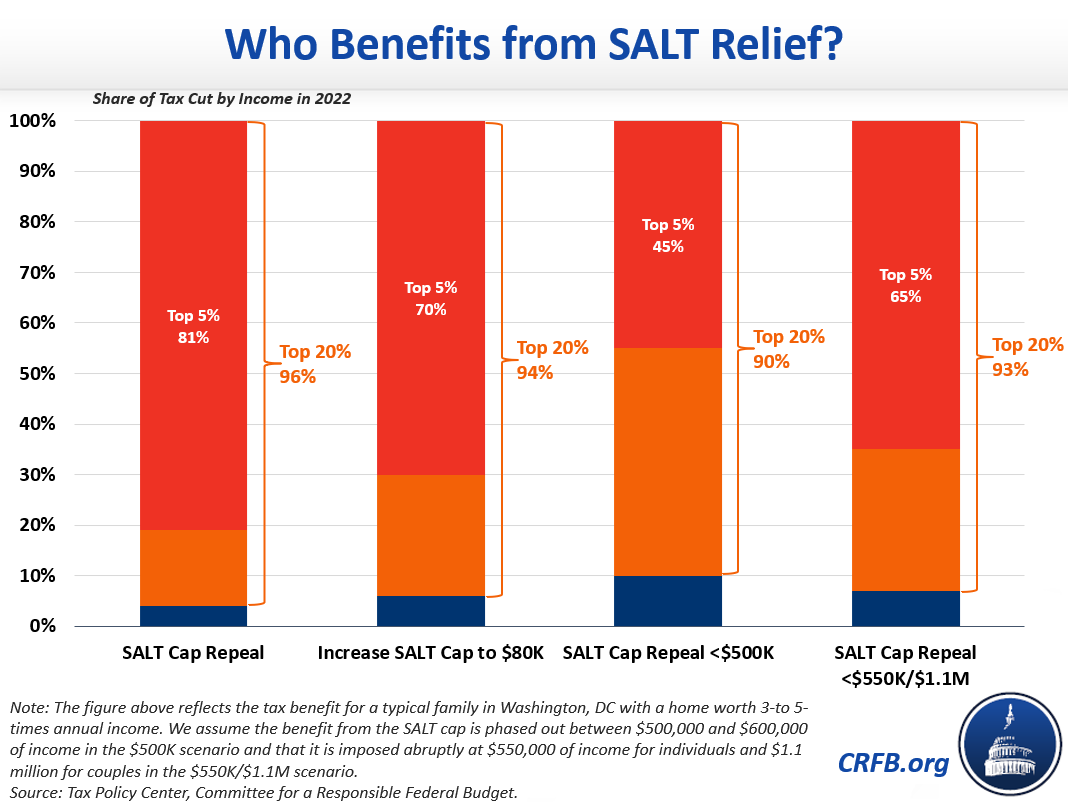
19. SALT Cap Relief is Regressive
So far, nearly every proposal introduced or suggested to change the current $10,000 state and local tax (SALT) deduction cap would be unnecessarily regressive. Ninety-six percent of the benefit of complete repeal would go to households in the top income quintile, while 94 percent of the benefit of raising the cap to $80,000 – as in the House-passed Build Back Better Act – would benefit the top 20 percent. Other proposals to repeal the SALT deduction cap for those earning less than $500,000 or for individuals earning up to $550,000 ($1.1 million for couples) would deliver 90 percent and 93 percent, respectively, to the top income quintile. For more, visit our SALT Deduction Resources page.
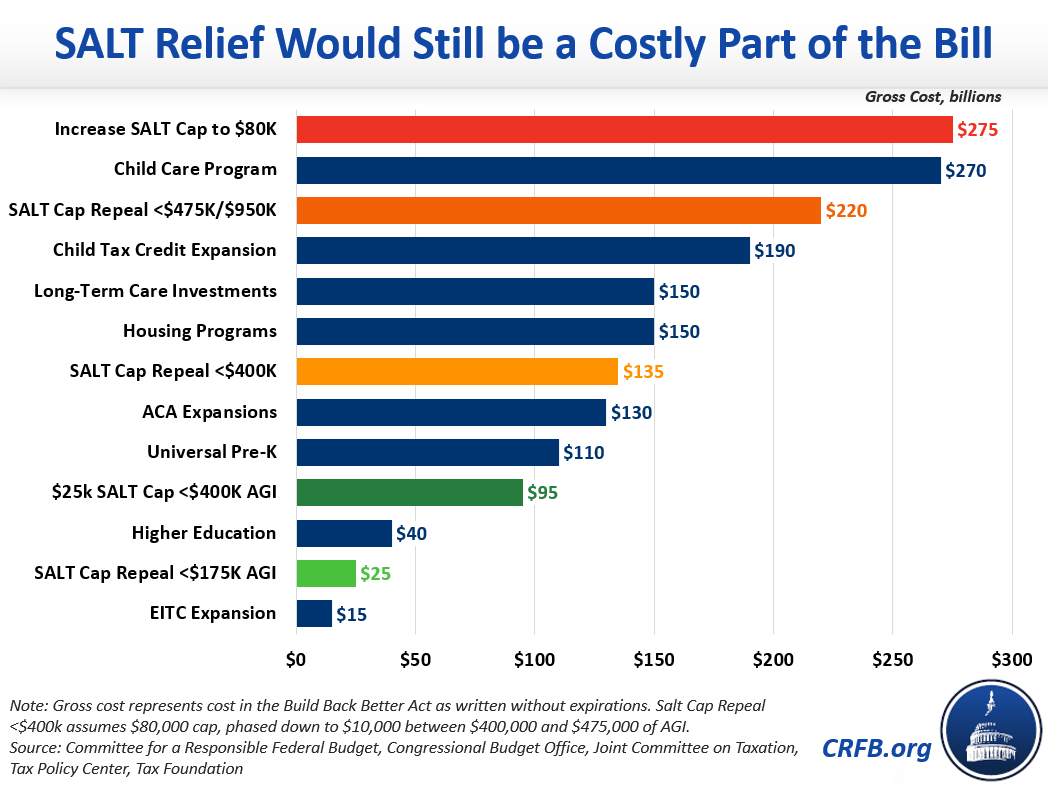
20. SALT Cap Relief is Costly
So far, nearly every proposal introduced or suggested to change the current $10,000 state and local tax (SALT) deduction cap would be a costly mistake. The proposal to raise the cap to $80,000 in the House-passed Build Back Better Act would cost $275 billion over five years, making it the costliest part of the bill. A more recent proposal to keep the SALT cap for those making over $1 million of annual income would cost $220 billion, making it the second costliest part of the bill. And even restricting SALT cap relief to those making under $400,000 would still cost $135 billion.
Holding the cost of SALT relief down requires a much narrower proposal, such as limiting relief to those making less than $175,000 per year. For more, visit our SALT Deduction Resources page.
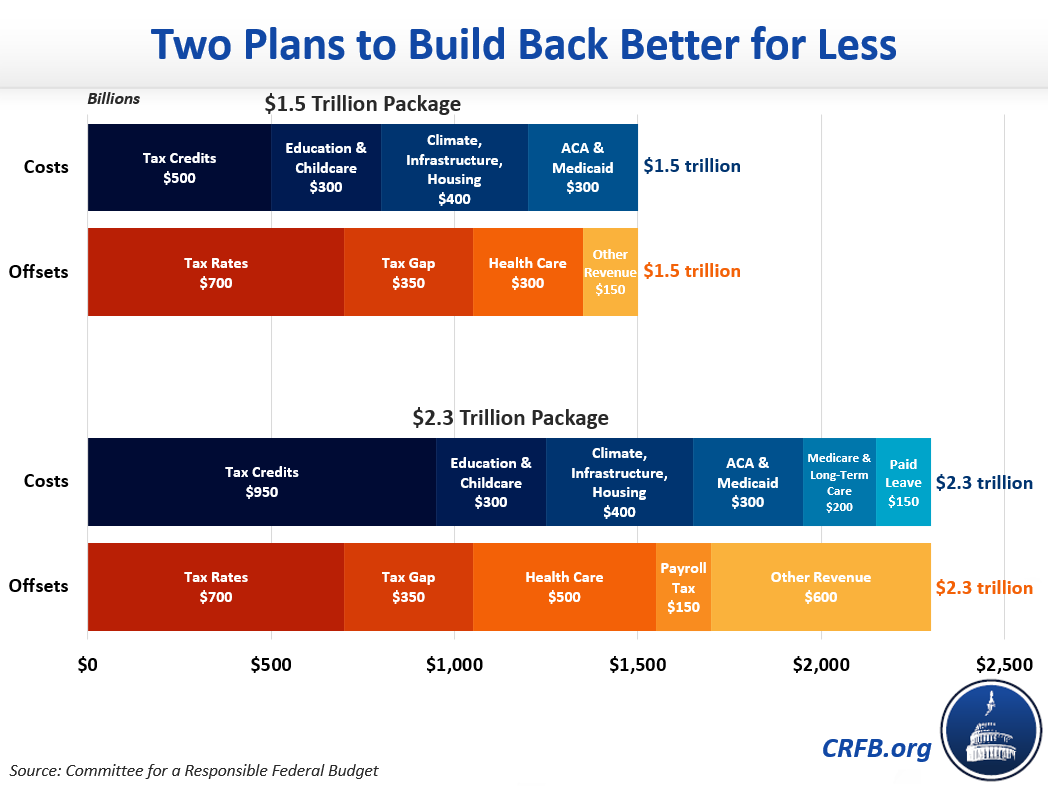
21. Build Back Better Legislation Can Be Improved
Despite the political uncertainy of any reconciliation package for FY 2022, lawmakers still have many available options to craft a fiscally responsible package that achieves several of their priorities. In October, we published Build Back Better for Less, which outlines two illustrative packages that would make several of the investments proposed by the Biden Administraiton in a manner that is both permanent and fiscally responsible. In addition, we published a chartbook on these packages.
While the House-passed Build Back Better Act may be on ice heading into the new year, lawmakers should consider how to accomplish their goals without worsening the debt – and ideally, they should set themselves up to improve the debt trajectory as the economy continues to improve and we (hopefully) emerge from the COVID-19 pandemic.