Weak Auctions Underscore Risks of our Growing Debt Burden
Auctions for the 2-year, 5-year, and 7-year Treasury notes went poorly last week and Treasury yields spiked, raising concerns about investor demand for U.S. debt. The auctions cleared at higher-than-expected yields, saw weaker demand, and required greater participation from primary dealers to absorb the issuance. Meanwhile, the 10-year Treasury yield has risen from 4.0% at the end of February to over as 4.4% late last week, remaining around 4.3% to 4.4% this week; other Treasury securities have seen similar rises in yields.
The consecutive poor auctions last week are a reminder that increased uncertainty can quickly translate into volatility in Treasury markets, which has been exacerbated by a large and growing supply of debt. To the extent this volatility translates into higher interest rates, it can also feed that growing supply of debt by increasing the cost of interest on the debt. As debt issuance increases, demand becomes more sensitive and weak auctions become more likely during periods of volatility.
The U.S. Treasury held three major debt auctions last week for $69 billion of 2-year Treasury notes, $70 billion of 5-year notes, and $44 billion of 7-year notes. All three could be described as having gone poorly, based on their bid-to-cover ratio (higher is better), the share of primary dealer absorption (lower is better), and the auction tail (lower is better).
Recent Auction Metrics vs. Prior 6-Month Average
| 2-Year Note | 5-Year Note | 7-Year Note | |
|---|---|---|---|
| Bid-to-Cover | 2.44 (6mo avg. of 2.62) | 2.29 (6mo avg. of 2.36) | 2.43 (6mo avg. of 2.46) |
| Primary Dealer Absorption | 24% (6mo avg. of 11%) | 16% (6mo avg. of 11%) | 12% (6mo avg. of 11%) |
| Auction Tail | 1.8bps (6mo avg. of -0.2 bps) | 1.4bps (6mo avg. of 0.3 bps) | 0.8bps (6mo avg. of 0.3 bps) |
| High Yield | 3.94% (6mo avg. of 3.52%) | 3.98% (6mo avg. of 3.68%) | 4.26% (6mo avg. of 3.88%) |
Sources: U.S. Department of the Treasury, market reporting, and Committee for a Responsible Federal Budget.
Note: While bid-to-cover, primary dealer absorption, and high yield data can be directly pulled from the Treasury, data for the auction tail is based on various reports from market participants and could differ depending on the source.
The 2-year Treasury auction last Tuesday was particularly bad, with primary dealers absorbing nearly a quarter of the auction (versus the prior six-month average of 11%) amid lackluster demand by end investors, represented by the poor bid-to-cover metric of 2.44 versus the prior six-month average of 2.62. As a result, the securities sold at a yield 1.8 basis points higher than when the auction started – referred to as the auction tail.
While the 5-year auction on Wednesday and 7-year auction on Thursday had noticeable improvements, they still had lower demand, higher absorption from primary dealers, and greater auction tails than normal. The 5-year auction had a bid-to-cover metric of 2.29 (versus an average of 2.36), primary dealer absorption of 16% (versus an average of 11%), and an auction tail of 1.4 basis points (well above the average of 0.3 basis points). The 7-year auction saw further improvement with a bid-to-cover ratio and primary dealer absorption rate that were slightly worse than average but an auction tail of 0.8 basis points that was significantly higher than its average of 0.3 basis points.
Indeed, yields on Treasury securities have been rising since the beginning of the recent conflict in Iran with the 2-year, 5-year, and 7-year Treasury notes all increasing by over 40 basis points since February 27. As of March 30, yields for the 2-year, 5-year, and 7-year notes stood respectively at 3.8%, 4.0%, and 4.2% – higher than their yields at the end of February of 3.4%, 3.5%, and 3.7%. Yields on the 10-year note and 30-year bond have also increased significantly, with the 10-year rising from 4.0% to 4.4% and the 30-year rising from 4.6% to 4.9%.
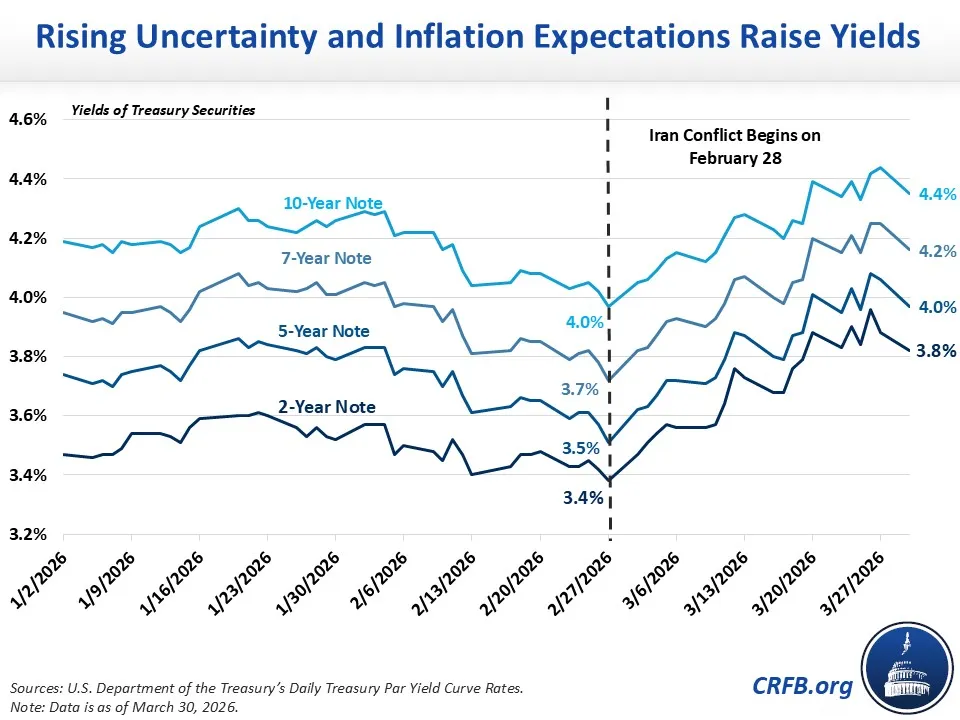
The upward pressure on yields appears to be driven in part by rising oil prices – a key component of inflation – which have raised uncertainty around the outlooks for inflation and the economy. With inflation expectations rising, markets have priced in tighter monetary policy and higher short-term Treasury rates, pushing yields upward. In addition to demanding greater compensation for expected inflation and the path of short-term rates, investors are also requiring a higher term premium – extra compensation for the risk of holding longer-term securities in an environment of elevated uncertainty. Additionally, the nation’s unsustainable fiscal outlook and growing near-term cash needs may soon be exacerbated based on expected borrowing related to the conflict in Iran and higher defense budget asks, lost tariff revenue following a Supreme Court ruling, and higher cost-of-living adjustments on the heels of high inflation.
Such changes in yields can have important implications for fiscal policy. For example, long-term rates are currently about 30 basis points higher than CBO’s projection for 2026. If that trend were to continue, interest costs could rise by $1 trillion over the next ten years.
While the recent auction results do not suggest a crisis-level breakdown in Treasury market functioning, they underscore the sensitivity of auction health and federal borrowing costs to economic conditions and shifts in market sentiment. With large and unsustainable debt and deficits, policymakers should be wary of “black swan” risks that could spark volatility, upend markets, and drive interest costs beyond their already unacceptable level.
Tags
What's Next
-
Image

-
Image

-
Image