Understanding the ACA Subsidy Discussion
As policymakers continue to debate what’s next for the Affordable Care Act (ACA) exchanges, there has been significant confusion over how the subsidies work, how much they cost, and why premiums are rising. In this explainer, we discuss:
- What Are the ACA Subsidies, and How Are They Structured?
- How Much Does It Cost to Extend Enhanced Subsidies?
- How Much Are Premiums Scheduled to Increase?
- Why Are Premiums Rising?
- Who Will Pay the Premiums?
What Are the ACA Subsidies, and How Are They Structured?
Beginning in 2014, the Affordable Care Act (ACA) established exchanges where individuals without employer-based insurance coverage can purchase health insurance. Within the exchanges, the ACA established income-based subsidies to partially cover premium costs for many enrollees. Subsidies are based on premiums for the second lowest-cost “silver” plan (called the “benchmark plan”). Enrollees receive subsidies equal to a fixed share of income and pegged to the benchmark plan, with the fixed share of income rising with income.
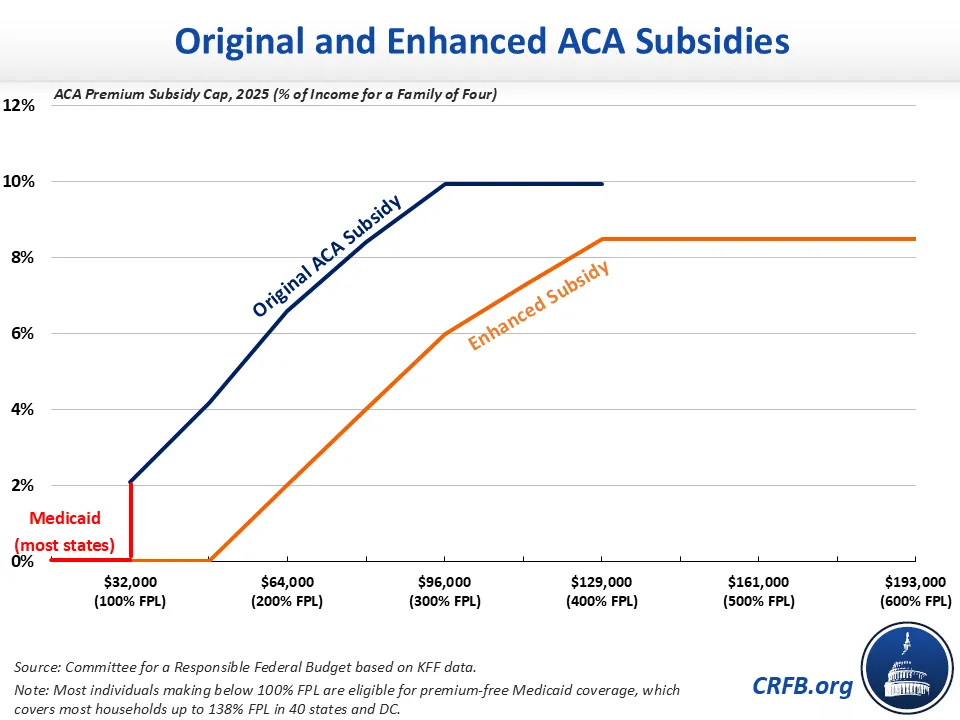
Between 2014 and 2020 – and starting again in 2026 under current law – subsidies are paid on a sliding-scale basis to those with incomes between 100% and 400% of the federal poverty level (FPL), which is a function of income and household size. Most of those with income below 100% of FPL are eligible for Medicaid in most states. Under current law, the 2026 subsidies will limit the premium enrollees pay for a benchmark plan to 2% of household income for those making 100% of FPL, rising to 6.60% of income by 200% of FPL and 9.96% of income for those between 300% and 400% of FPL.
The American Rescue Plan Act and Inflation Reduction Act increased the ACA subsidies temporarily from 2021 through 2025. These enhanced subsidies cover the full cost of a benchmark premium for those between 100% and 150% of FPL. Beyond that, the subsidies limit the premiums enrollees pay for a benchmark plan to 2% of income by 200% of FPL, 6% of income by 300% of FPL, and 8.5% of income for all beneficiaries at 400% of FPL or more. The enhanced subsidies are theoretically available to even very high-income enrollees, with no income cutoff; however, few very high earners likely face premiums above the 8.5% of income threshold. These enhanced subsidies are set to expire at the end of 2025.
How Much Do The ACA Subsidies Cost, and How Many People Do They Cover?
ACA subsidies are primarily paid directly to insurers throughout the year and then reconciled through tax returns, taking the form of income tax credits for individuals.
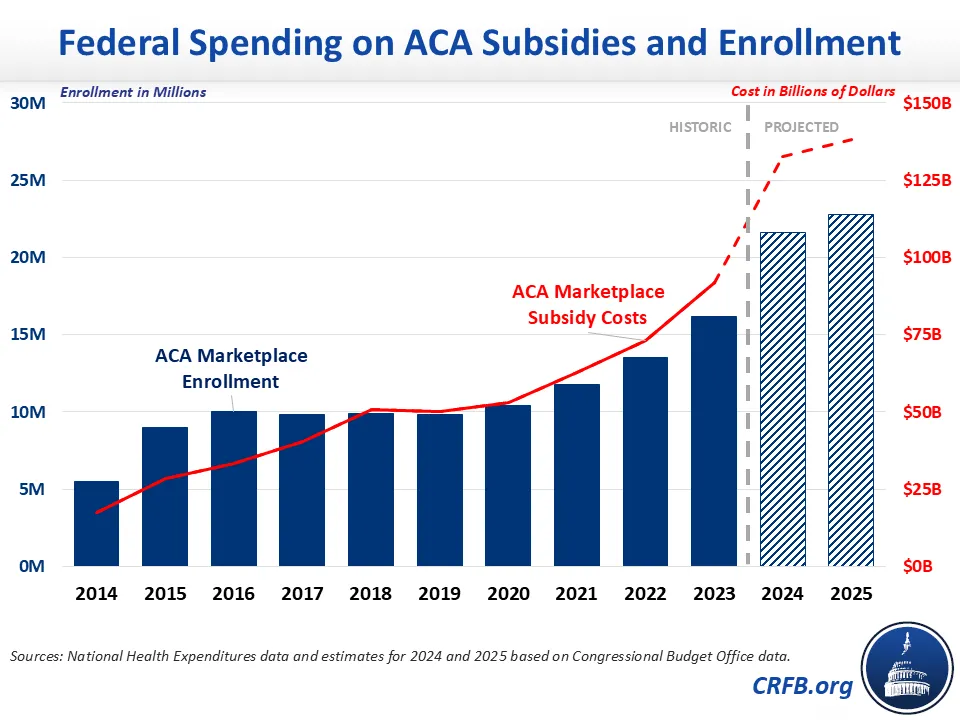
The gross federal cost of these subsidies and related spending grew from $18 billion in 2014 – the first year in which individuals were eligible for the subsidies – to $50 billion in 2018, $53 billion in 2020, $92 billion in 2023, and an estimated $138 billion in 2025. The net federal cost of these subsidies is somewhat lower due to less federal spending and tax breaks related to employer-sponsored health insurance and uncompensated care.
The growth in ACA costs over time is driven in part by rising health care costs and increased generosity of subsidies (especially under the enhanced subsidies) but also by growing enrollment. About 5.5 million people were enrolled in the exchanges in 2014, growing to roughly 10 million per year between 2015 and 2020. Enrollment further grew to 16 million in 2023 and an estimated 23 million in 2025. The net effect on insurance coverage is lower than these increases, since some ACA enrollees would otherwise receive employer coverage or purchase non-group coverage outside of the exchanges.
Although the ACA subsidies have come with significant costs, they have largely been offset with other budgetary savings. Both the 2010 Affordable Care Act and the 2022 Inflation Reduction Act included revenue increases and Medicare spending reductions that roughly offset new expected costs. The American Rescue Plan, which enhanced the ACA subsidies for two years, was deficit financed.
How Much Does It Cost To Extend Enhanced Subsidies?
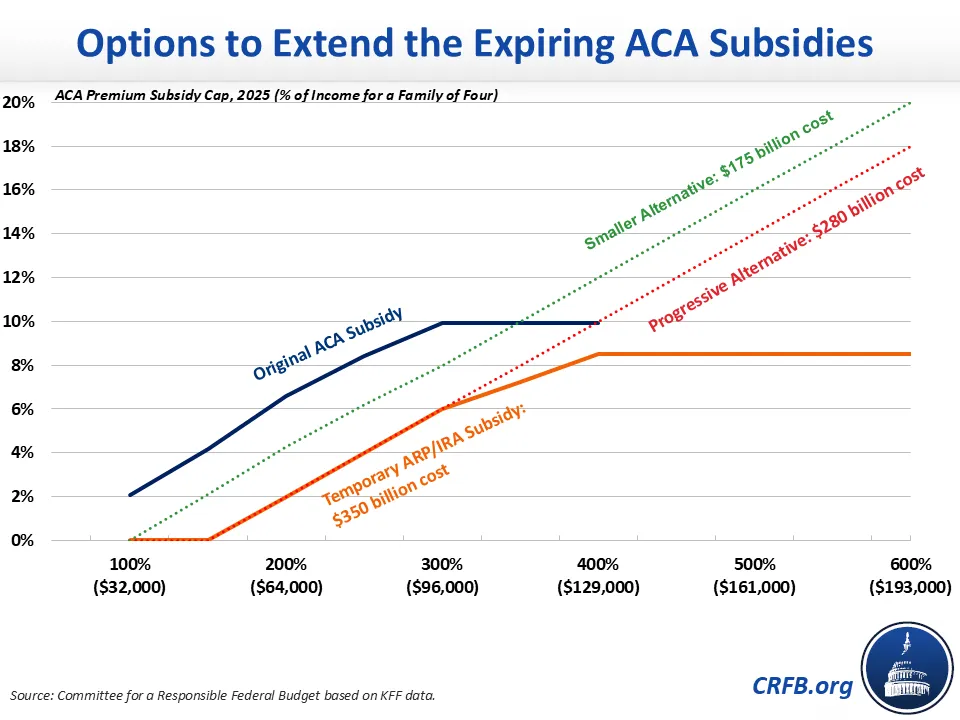
The enhanced subsidies in effect this year are scheduled to expire at the end of the year, reverting to the original ACA subsidies for 2026. The Congressional Budget Office (CBO) estimates that extending the enhanced subsidies in full would cost $350 billion over a decade. A two-year extension would cost about $60 billion.
CBO estimates that these extensions will increase net insurance coverage by about 3.5 million people per year, with roughly 7.5 million more people enrolling in exchanges and other coverage, partially offset by 4.1 million fewer enrollees in employer-sponsored and other insurance.
Fiscal Impact of Extending or Extending and Reforming Enhanced Subsidies (2026-2035)
| Policy | Ten-Year Cost (-) / Savings (+) | |
|---|---|---|
| 2-Year Extension | 10-Year Extension | |
| Extend Enhanced Subsidies | -$60 billion | -$350 billion |
| Extend Enhanced Subsidies Below 600% of Poverty | -$55 billion | -$325 billion |
| Extend Subsidies Below 300% of Poverty, Extend Phase Up Above 300% ("Progressive Alternative") | -$50 billion | -$280 billion |
| Extend Subsidies with Modified Schedule, Roughly Half as Generous ("Smaller Alternative") | -$30 billion | -$175 billion |
| Fund Cost-Sharing Reductions (CSR) | * | +$50 billion |
| Extend Trump Admin 2025 ACA Rules | * | +$50 billion |
Source: Congressional Budget Office and CRFB estimates. *No estimates available.
Policymakers could reduce the cost of the enhanced subsidies by incorporating reform proposals to scale back the size of the enhancement, strengthen the means testing, and/or lower the underlying cost of ACA subsidies – including by directly funding cost-sharing reductions (CSRs) to reduce a practice known as "silver-loading."
Policymakers could also offset the costs of any extension of the enhanced subsidies – for example, by adopting site-neutral payments in Medicare or reducing Medicare Advantage upcoding.
How Much Are Premiums Scheduled to Increase?
Discussions over ACA premiums often conflate the pre-subsidy (or gross) premium and the post-subsidy (or net) premium. The pre-subsidy premium represents the total cost of each plan, whereas the post-subsidy premium represents the amount enrollees pay directly. The post-subsidy premium represents the full premium subtracting enrollees’ expected subsidy.1
Average pre-subsidy premiums are projected to rise by roughly 26% next year based on one recent analysis. Meanwhile, average post-subsidy premiums are projected to more than double next year according to another study. These averages obscure significant differences based on age, income, location, and other factors.
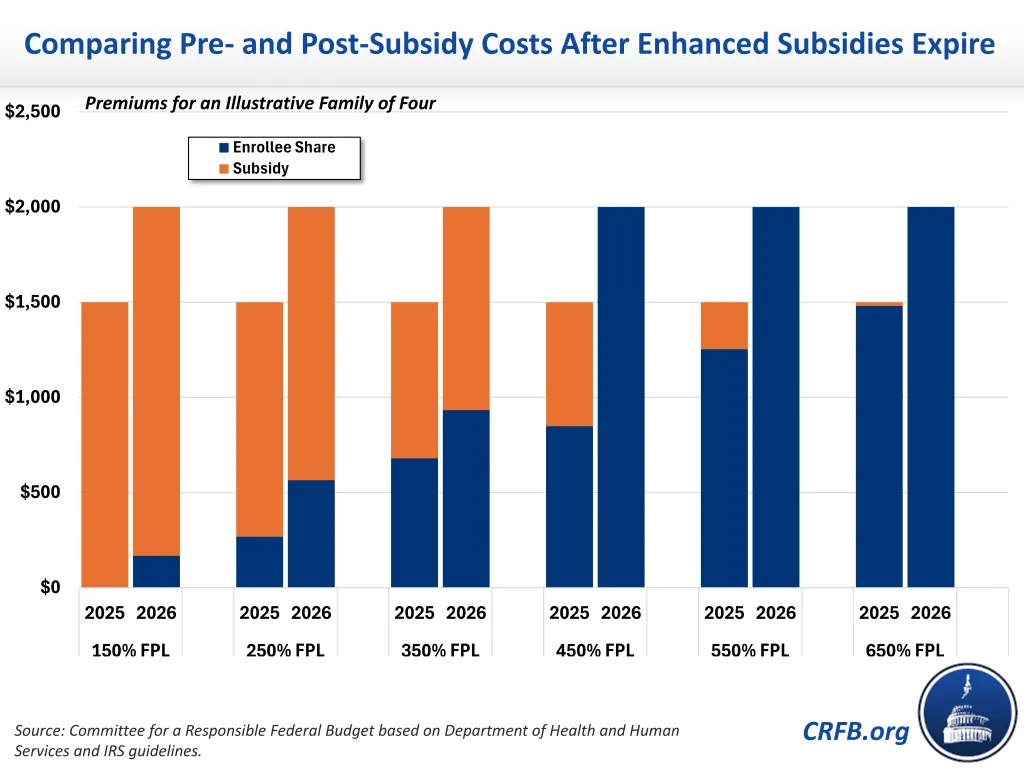
Consider the premium changes between 2025 to 2026 for an illustrative family of four at different income levels. The chart below shows a four-person household with a $1,500 monthly pre-subsidy premium in 2025. That total monthly pre-subsidy premium will rise to roughly $2,000 in 2026 – a $500 increase. Under current law, the enhanced subsidies will expire, so the post-subsidy premiums paid by this illustrative household will rise by a higher percentage in most cases but often a smaller dollar amount. For example, post-subsidy premiums paid by enrollees would grow by roughly $300, from $268 to $565, at 250% of FPL and by about $250, from $680 to $933, at 350% of FPL. Below 150% of FPL, enrollees will go from paying no premium to paying 2% of their income. Above 400% of FPL, they will go having their post-subsidy premiums limited to 8.5% of their incomes to paying the full $2,000.
Why Are Premiums Rising?
The expected increase in pre-subsidy premiums is partially driven by rising overall health care costs. On top of general inflation and even faster rising health care prices, experts have pointed to rising labor costs, increased provider consolidation, growing demand from an aging population, expanding use of new GLP-1 and other specialty drugs, and the effect of tariffs on certain drugs and medical supplies and equipment as possible drivers.
The premium increase is also driven in part by expected changes to the overall risk pool covered by the exchanges. Assuming the enhanced premium subsidies expire as scheduled, CBO projects the number of people enrolled in the exchanges will decline by more than 2 million in 2026. Those who drop coverage, on average, are likely to have lower health care costs, while those who remain do so in part because of their higher health care needs. As a result, pre-subsidy premiums will rise. Based on CBO estimates, the expiration of the enhanced subsidies is likely to push up pre-subsidy premiums by about 5%.2 Other policy changes will have a mixed impact on premiums.
Post-subsidy premiums, meanwhile, are scheduled to grow mainly because of the expiration of the enhanced subsidies. Figures showing the percentage growth in the post-subsidy premium in some ways obscure the reality that a modest reduction in a generous subsidy can lead to a large percentage increase in the post-subsidy premium. For example, reducing a subsidy from 90% to 80% of gross costs would lead to a doubling of post-subsidy premiums, from 10% to 20% of gross premiums.
Who Will Pay the Premiums?
Although the premiums directly paid by beneficiaries will depend heavily on the subsidy, all costs must be paid by someone. Whether the enhanced subsidies are extended or expire (or are modified) will have a modest effect on total premiums due to changes in the risk pool, but the choice will mainly influence who pays. Subsidies reduce the premium paid directly by enrollees by increasing the cost borne by taxpayers, recipients of other government programs, and – if deficit financed – future generations.
The table below shows the theoretical cost breakdown of a $2,000 per month plan for a four-person household in 2026, depending on whether beneficiaries receive the original or enhanced subsidies. For example, at 350% of FPL, a beneficiary will pay $933 under the original subsidies and $680 under the enhanced subsidies; meanwhile, the federal government will pay $1,067 under the original subsidies and $1,320 under the enhanced subsidies.
Portion of Premiums Paid by Enrollees and the Federal Government, for an Illustrative Family of Four with a 2026 Premium of $2,000 per Month
| Original Subsidies | Enhanced Subsidies | ||||
| Income Level | Beneficiary Premium | Government Subsidy | Beneficiary Premium | Government Subsidy | |
| 150% of FPL | $168 (8%) |
$1,832 (92%) |
$0 (0%) |
$2,000 (100%) |
|
| 250% of FPL | $565 (28%) |
$1,435 (72%) |
$268 (13%) |
$1,732 (87%) |
|
| 350% of FPL | $933 (47%) |
$1,067 (53%) |
$680 (34%) |
$1,320 (66%) |
|
| 450% of FPL | $2,000 (100%) |
$0 (0%) |
$849 (42%) |
$1,151 (58%) |
|
| 550% of FPL | $2,000 (100%) |
$0 (0%) |
$1,253 (63%) |
$747 (37%) |
|
| 650% of FPL | $2,000 (100%) |
$0 (0%) |
$1,480 (74%) |
$520 (26%) |
|
Source: CRFB estimates.
***
In light of our unsustainable fiscal situation, any extension of the enhanced subsidies should be accompanied by both reforms and offsets so that a full package is at least fully paid for – preferably twice over according to the principles of Super PAYGO – in a way that lowers health care costs and reduces the debt.
1 Post-subsidy premiums are based on enrollees’ estimated income for the coming year. Enrollees can choose to have the government pay a monthly portion of the subsidy to the plan or wait to receive the entire tax credit when they file taxes the next year. After the end of the year, the actual amount of the subsidy is reconciled on the enrollee’s tax return. At that time, enrollees can owe money or can receive a tax refund.
2 CBO estimated that extending the subsidies at the end of September would have reduced premiums by 2.4% based on a 50% probability that premiums would already be set before the subsidy was enacted.