Analysis of the Sanders Single-Payer Offsets
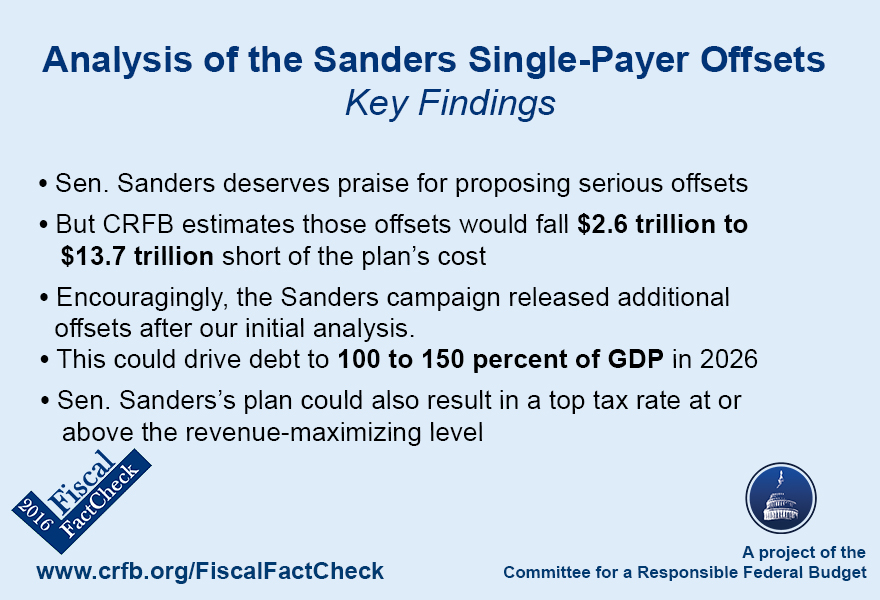
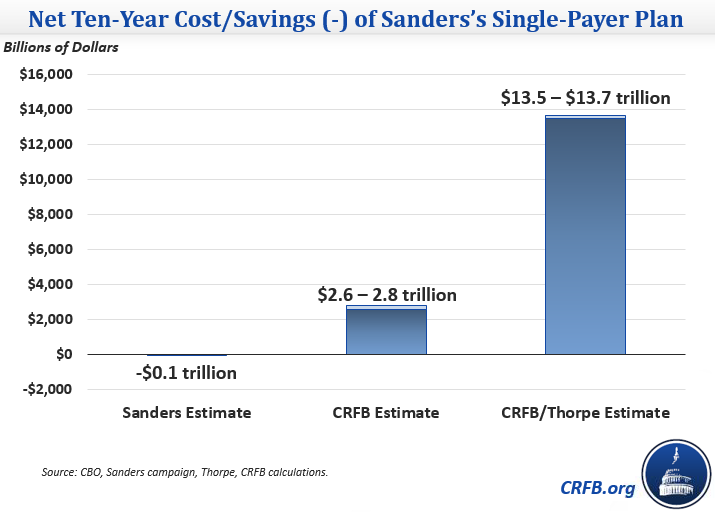
That Sen. Sanders has shown a commitment to paying for his new initiatives and has proposed specific concrete changes to do so is quite encouraging. However, by our rough estimates, his proposed offsets would cover only three-quarters of his claimed cost, leaving a $2.6 to $2.8 trillion shortfall over ten years. Even that discrepancy, though, assumes that the campaign’s estimate of the cost of their single-payer plan is correct. An alternate analysis by respected health economist Kenneth Thorpe of Emory University finds a substantially higher cost, which would leave Sanders’s plan $13.5 trillion short. The plan would also increase the top tax rate beyond the point where most economists believe it could continue generating more revenue and thus could result in even larger deficits as a result of slowed economic growth.
Below, we explain the plan – and more specifically the plan’s offsets – in some detail.
The Basics of Sen. Sanders’s Single-Payer Health Plan
Sen. Sanders’s plan, which he calls Medicare-for-All, would expand health coverage to all Americans and make the federal government the sole health insurer in the country, responsible for paying providers (hence the term single-payer) and negotiating payment rates. Although it is framed as Medicare-for-All, this single-payer system would work differently than Medicare and in many ways would be far more generous since it would require no cost-sharing and offer a more comprehensive set of benefits, including long-term care and mental health and substance abuse services.
The Sanders campaign estimates this plan would save the health system on the whole about $6 trillion over ten years (an estimate many have argued is far too high), but it would increase the federal government’s costs by about $14 trillion.
Encouragingly, Sen. Sanders has outlined a set of offsetting tax increases designed to pay for the plan’s cost. They include:
- A 2.2 percent “income-related premium” for individuals – Under this policy, households would pay a 2.2 percent tax, which based on the description would be the equivalent of a 2.2 percentage point increase in all ordinary income tax rates. As with the ordinary income tax, significant earnings would be exempt from this tax, particularly for low and moderate earners. For example, a family of four taking the standard deduction would not pay taxes on their first $28,800 of income.
- A 6.2 percent employer-paid “income-related premium” – Under this policy, employers would pay a tax equal to 6.2 percent of their workers’ income. Practically speaking, this would likely have to take the form of a payroll tax, like the one already paying for Social Security and Medicare.
- An increase in income tax rates for high earners – Currently, household income is taxed at 33 percent above $250,000, 35 percent above $413,000, and 39.6 percent above $467,000. Sen. Sanders would tax income at 37 percent above $250,000, 43 percent above $500,000, 48 percent above $2 million, and 52 percent above $10 million.
- Taxing capital gains and dividends as ordinary income and tax capital gains at death – Currently, long-term capital gains and qualified dividends are taxed at a top rate of 20 percent (plus a 3.8 percent surtax). Sen. Sanders would tax this income the same as earned income for households making above $250,000, resulting in a top rate of 52 percent (plus 10 percent in surtaxes, including the effects of his Social Security plan). This plan would also tax capital gains as if sold when the owner dies, with a limited exemption, which we discuss in more detail in a followup analysis.
- Reforming tax expenditure limits – Currently, the Alternative Minimum Tax (AMT), personal exemption phaseout (PEP), and Pease limitation are all used to limit the value of various deductions in different ways. Sen. Sanders would replace all of these with a 28 percent limit on the value of itemized deductions, which prevents them from rising in value for those above the 28 percent bracket.
- Increasing the estate tax – Sanders would increase the top estate tax rate from 40 to 65 percent, lower the threshold for being taxed from $5.45 million to $3.5 million, and close various loopholes.
In addition to these offsets, Sanders estimates significant revenue would be generated by the fact that nearly all health-related tax preferences – most significantly the exclusion for employer-provided health insurance – would become obsolete.
The Budgetary Effect of Sen. Sanders’s Single-Payer Health Plan1
An analysis by UMass-Amherst economics professor Gerald Friedman estimates that the single-payer system would cost $13.8 trillion over the next ten years and that the seven tax increases Sen. Sanders proposes would raise $13.9 trillion, thus making the system fully paid for. However, these estimates may understate the cost and overstate the revenue raised. Even taking the cost of the single-payer system (and automatic savings to the tax code) as a given, we estimate – roughly, based on Congressional Budget Office/Joint Committee on Taxation methodology – that the proposed offsets would fall short by at least $2.6 trillion over a decade. If one were also to account for the negative macrodynamic effects that such high marginal rates on income and capital would have, even less revenue would be raised.
As we explained recently, Sen. Sanders may also be understating the cost of his plan – by more than $1 trillion per year, according to health expert Kenneth Thorpe. If Thorpe’s analysis is correct, Sen. Sanders’s plan (revenue included) could end up costing as much as $14 trillion more than he estimates over a decade before interest or economic impact
| Budgetary Effect of Sen. Sanders’s Single-Payer Plan | ||
| Policy | Claimed Ten-Year Savings | CRFB Estimated Ten-Year Savings |
| 6.2% Employer Tax | $6.3 trillion | $5.3 trillion |
| 2.2% Individual Premium | $2.1 trillion | $1.6 trillion |
| Progressive Income Tax Increases | $1.1 trillion | $0.8 trillion |
| Tax Capital Gains/Dividends as Ordinary Income | $0.9 trillion | $0+ |
| Tax Capital Gains at Death | $0.3 – 0.5 trillion | |
| Reform Tax Deduction Limits for High Earners | $0.2 trillion | -$0.3 trillion |
| The Responsible Estate Tax | $0.2 trillion | $0.2 trillion |
| Savings From Health Tax Expenditures | $3.1 trillion | $3.1 trillion+ |
| Interactions | $0 | ?? |
| Total | $13.9 trillion | $11.0 to $11.2 trillion |
| Enact Single-Payer Health Insurance Plan (Sanders) | -$13.8 trillion | -$13.8 trillion |
| Enact Single-Payer Health Insurance Plan (Thorpe) | -$24.7 trillion | -$24.7 trillion |
| Total Net Effect (Sanders) | $0.1 trillion | -$2.6 to -$2.8 trillion |
| Total Net Effect (Thorpe) | -$10.8 trillion | -$13.5 to -$13.7 trillion |
Source: Sanders Campaign/Friedman, Thorpe, CRFB calculations.
Table footnotes appear at bottom of this document.
With regards to the offsets, a number of the revenue estimates provided by the campaign, in particular, appear to be much higher than what an official score would suggest. For example, the campaign estimates that the 6.2 percent payroll tax and 2.2 percent income surtax combined would generate $8.4 trillion over ten years. The Congressional Budget Office (CBO), however, estimates that a 1 percentage-point payroll tax increase would raise $800 billion over ten years and a 1 percentage-point income tax increase would raise less than $700 billion over ten years – which translates Sen. Sanders’s increases to less than $7 trillion total over ten years.
As another example, the Sanders campaign estimates that taxing capital gains and dividends as ordinary income (now with a top rate of 52 percent) would raise $920 billion. Yet most estimators, importantly including the Joint Committee on Taxation, believe the revenue-maximizing rate for capital gains (excluding the dynamic economic effect) is somewhere around 30 percent, since as the capital gains rate rises further, investors choose to “realize” fewer gains by selling assets. With a top capital gains rate of about 62 percent in total (52 percent from taxing gains as ordinary income, 3.8 percent from the Medicare investment surtax, and 6.2 percent from Sen. Sanders’s Social Security plan), the revenue loss from lower capital gains tax collection would likely outweigh the gains from a higher dividends rate. Rather than charge this revenue loss, we give the campaign the benefit of the doubt and simply assume zero additional revenue collection.
Estimating the impact of Sen. Sanders’s policy to tax capital gains at death is far more difficult because official scoring agencies have not recently estimated this policy. The most comparable policy which has been scored is President Obama’s proposal to tax capital gains at death while increasing the capital gains and dividends tax rates by 4.2 percentage points on incomes above $250,000. Those policies together would generate about $230 billion over ten years. A 4.2 percentage point tax rate increase by itself would raise between $50 and $100 billion, suggesting the President’s policy to tax capital gains at death alone will raise somewhere in the broad range of $150 billion over ten years. Sen. Sanders’s proposal is likely to raise significantly more than the President’s plan, since Sen. Sanders supports a capital gains rate roughly twice as high and would not exempt charitable giving from capital gains taxation. By our very rough estimate, total revenue from these additions could be as high as $300 to $500 billion over a decade. (These estimates are discussed in more detail here)
Furthermore, the campaign estimates that replacing the AMT, PEP, and Pease with a 28 percent limit on deductions would raise $150 billion over ten years, but in reality it would likely lose around $250 billion. Replacing Pease alone with the 28 percent limitation would raise $150 billion, but repealing PEP and the AMT would result in significant costs that would more than consume the savings from replacing Pease.
Finally, our best estimate of Sen. Sanders’s proposed income tax rate increases – based on IRS tax tables and rules of thumb from CBO – suggest it would raise about $750 billion over ten years rather than $1.1 trillion.
We take Sen. Sanders’s estimate that the end of private insurance would lead to automatic tax expenditure savings of $3.1 trillion as a given, although this too might be an overestimate.
Overall, based on our rough estimates and excluding most potential interactions, it appears that Sen. Sanders’s proposal would raise $11.0 to $11.2 trillion of revenue.2 Depending on whether one uses Sen. Sanders’s estimates of the cost of his single-payer plan or Thorpe’s estimates, this means his plan would cost between $2.6 trillion and $13.5 trillion, net of offsets, over a decade.
These costs could have a substantial effect on debt. Currently, CBO projects debt will grow to 86 percent of Gross Domestic Product (GDP) in 2026, and based on the Sanders campaign’s estimates it would grow to roughly the same place. But based on our analysis, the shortage of offsets would actually cause debt to grow 13 percentage points higher; adding Thorpe’s cost estimate, debt would grow nearly 60 percentage points higher. In other words, under Sen. Sanders’s plan, debt could ultimately reach between 100 and 150 percent of GDP by 2026.

The Limits of Taxing High Earners
Even our estimates of the Sanders plan are likely overly optimistic as they do not account for economic effects or any additional behavioral effects beyond those from a small tax increase. While small tax increases are likely to have little economic impact, economists almost universally believe that exorbitantly high taxes will slow economic growth and at some point actually lead to a reduction in revenue.
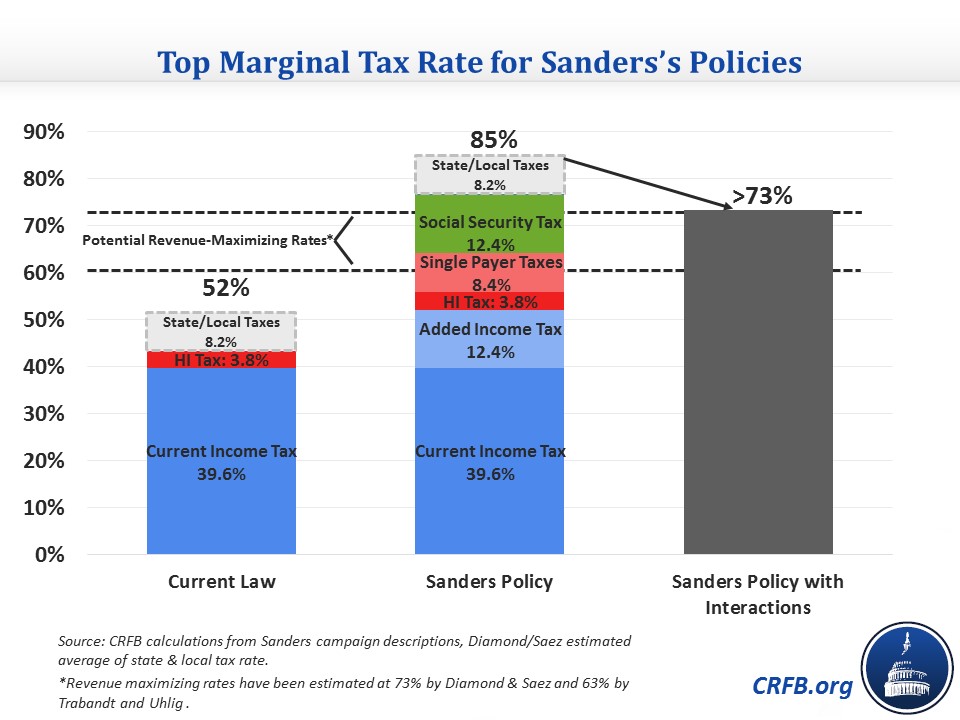
Although there is considerable disagreement over the exact revenue-maximizing tax rate for ordinary income (the top of the Laffer curve), many economists believe it to be in the range of 60 or 70 percent. (An informal survey of economists and experts by Dylan Matthews yielded answers of 73%, 70%, 63%-83%, 60% or higher, 40%-50%, 35%-40%, 33%, and 19%.) Economists Peter Diamond and Emmanuel Saez – supporters of significantly increasing the top tax rate – estimate a revenue maximizing rate of 73 percent in total. Another study by Mathias Trabandt and Harald Uhlig estimates a revenue-maximizing rate of 63 percent. When combined with his other proposals, the Sanders plan would lead to a statutory top rate well above either of those estimates and an effective top rate near the higher estimate.
Sen. Sanders’s single-payer plan proposes a top income tax rate of 52 percent along with 8.4 percent of income-based premiums. Add this to the current 3.8 percent Medicare rate, Sen. Sanders’s proposed 0.4 percent payroll tax for paid family leave, and Sen. Sanders’s proposed 12.4 percent tax increase for Social Security (from eliminating the cap on income subject to the Social Security tax) and it leads to a top federal rate of about 77 percent– about 14 points paid by employers and the remainder paid by employees. When the average state and local taxes are included, the top statutory rate rises to about 85 percent. But because of interactions between the provisions (such as a federal tax deduction for state taxes paid), the effective top rate would be near 73 percent.3
While it might be appropriate to exclude economic effects when estimating relatively modest tax changes, tax increases of the magnitude proposed by Sen. Sanders – leading to a rate at or above the revenue-maximizing rate – would almost certainly raise far less revenue than conventional projections suggest or than we estimated above. The same is true, perhaps more so, for Sen. Sanders’s proposed top capital gains rate of 62 percent (about twice the revenue-maximizing level and the highest in history and in the developed world). These policies would also lead to lower GDP and therefore a higher debt-to-GDP ratio.
The bottom line is that while significant revenue can be generated from high earners, there are limits. And at least when it comes to rate changes, the Sanders plan would leave them tapped out.
* * * *
Sen. Sanders has shown a commitment to paying for the cost of his single-payer plan, but the numbers at the moment don’t appear to add up. We look forward to hearing more details about the health care side of the plan and hope that he will adjust his policies so that the plan doesn’t add to the deficit.
Update, 2/26/16: Since this analysis, the Sanders campaign added additional offsets to their website that will reduce the plan’s gap between new spending and new revenues, most significantly the taxation of capital gains at death. We discuss the additional proposal here, and the numbers are already reflected above.
Update 2/6/16: We have updated our “top rate” analysis to incorporate interactions and reference additional economists not included in the original analysis.
1. Because Sen. Sanders’s website lacks certain details, our estimates rely on making a variety of assumptions with regards to the details of how various tax increases would be applies and implemented. Although we reached out to the campaign with clarifying questions, we have not received a response. We explain our policy assumptions in the text above. In general, our estimates are based on existing projections provided by the Joint Committee on Taxation (JCT) and Congressional Budget Office (CBO), scaled up as appropriate. In many cases, these estimate likely overstate what CBO and JCT would find, since they don’t account for the likelihood that behavioral effects will be more significant as tax rates rise. At the same time, our analysis – like the Sanders analysis (by appearance) – does not account for interactions between policies, some of which would reduce revenue gains but others of which would enhance them. All estimates are very rough and rounded.
2. Note that a recent analysis from the Tax Foundation suggested Sen. Sanders’s plan would raise significantly more than our estimate. However, the Tax Foundation numbers also include revenue proposed from other Sanders proposals – most significantly Social Security – and do not account for behavioral changes to capital gains utilization (official scoring agencies do). Adjusted for these differences, their numbers would be within $500 billion of ours.
3. Note: our original analysis focused only on the top statutory rate of 85 percent, noted the interactions but did not calculate them, and was relative to wage income. Including interactions and using a broader base of compensation yields a significantly lower rate since employer taxes make up such a large share of Sen. Sanders’s tax proposals and thus reduce cash income as a share of compensation paid to workers.
+CRFB did not estimate the impact of the proposed capital gains and dividends increase or tax expenditures savings. With regards to the tax expenditure savings, CRFB assumed the savings provided by the Sanders campaign. With regards to the capital gains and dividends increase, it is our assessment that when stacked after previously proposed increases, the rise in the capital gains rates – based on common scoring conventions – would result in significant revenue losses, likely in excess of gains from higher dividend rates, even with the change in realizations that would occur from eliminating step-up basis. This assessment is based on the assumption that capital gains and dividends would be taxed as ordinary income under the new rate schedule. Rather than estimating a loss, we scored the impact as zero.