A Six Figure Limit for Social Security
Social Security is less than seven years from insolvency, at which point the law calls for a 24% across-the-board benefit cut. Yet despite facing large deficits, Social Security now pays the wealthiest couples roughly $100,000 in annual benefits.
Although only a tiny fraction of couples will enjoy such generous benefits in the near term, six-figure benefits will become increasingly common over time.
This Trust Fund Solutions Initiative white paper offers a new option to improve Social Security solvency by establishing a maximum benefit level.
The Six Figure Limit (SFL) would set a $100,000 cap on the total benefit a couple retiring at the Normal Retirement Age (NRA) can receive starting this year. The SFL would be adjusted based on marital status and claiming age, with a $50,000 limit for a single retiree collecting at the NRA.
Jason DeBacker of the Open Research Group modeled three options to index the Six Figure Limit over time.1 Based on this analysis, the Six Figure Limit would:
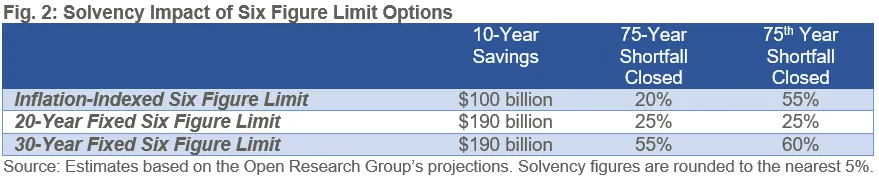
- Close one-fifth of Social Security’s solvency gap and three-fifths of the 75th year deficit with a Six Figure Limit indexed to inflation.
- Eliminate between one-quarter and one-half of the solvency gap and one-quarter to three-fifths of the 75th year shortfall if the SFL were temporarily fixed in nominal terms and then indexed to average wages.
- Save $100 billion to $190 billion over a decade under these options.
- Increase progressivity, with 60% to 90% of the savings coming from the top fifth of retirees in 2060, including 40% to 60% from the top tenth.
- Boost payable benefits for the bottom 70% to 80% of beneficiaries, with benefit increases of 4% to 25% for the bottom quarter of beneficiaries in 2060.
- Boost economic growth by encouraging personal savings and reducing deficits while having limited impact on work incentives.
Social Security faces a projected 4% of taxable payroll solvency gap over the next 75 years, necessitating increased revenue, slower benefit growth, or both.
In combination with other reforms, the Six Figure Limit could help restore Social Security solvency in a targeted, timely, progressive, and pro-growth way.
The Six Figure Limit
The very highest income couples can now collect $100,000 a year in Social Security benefits.
Such high benefits are currently only available to a small fraction of retirees – those who both earned at least the Social Security taxable maximum (currently $184,500) for at least 35 years and collect benefits after the Normal Retirement Age (NRA).2 Yet $100,000 benefits will become increasingly common as Social Security’s benefit formula leads benefits to grow over time.3
To slow the growth of Social Security benefits for the wealthiest seniors, this Trust Fund Solution – the Six Figure Limit (SFL) – would place a cap on Social Security benefits so that no couple collecting at the NRA (headed to 67) can claim retirement benefits greater than $100,000 per year.4 Details of how the Six Figure Limit is designed are explained in Appendix I.
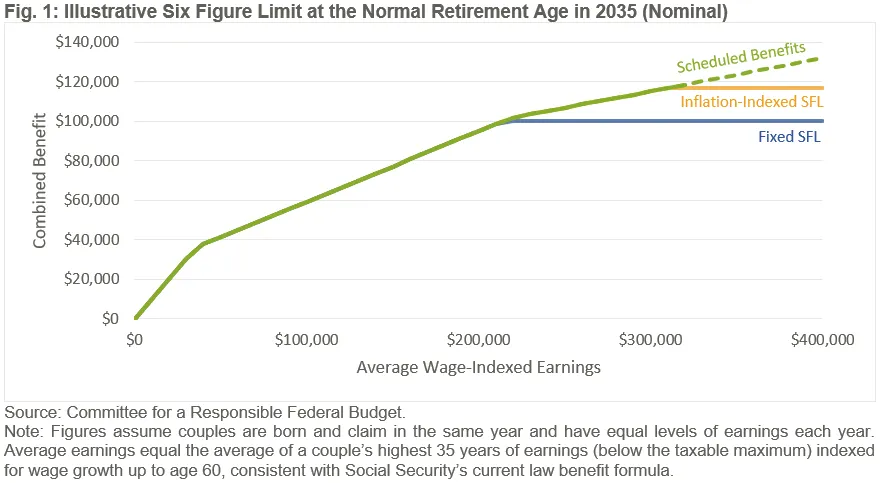
The $100,000 SFL would be adjusted based on marital status and collection age. A single person collecting at the NRA would face a $50,000 limit. A couple in which both spouses began collecting benefits at age 70 would face a $124,000 limit, reflecting the 24% delayed retirement credit. A couple with both spouses collecting at age 62 would face a $70,000 limit, reflecting the 30% early retirement actuarial reduction. Different claiming ages would result in a blended limit.
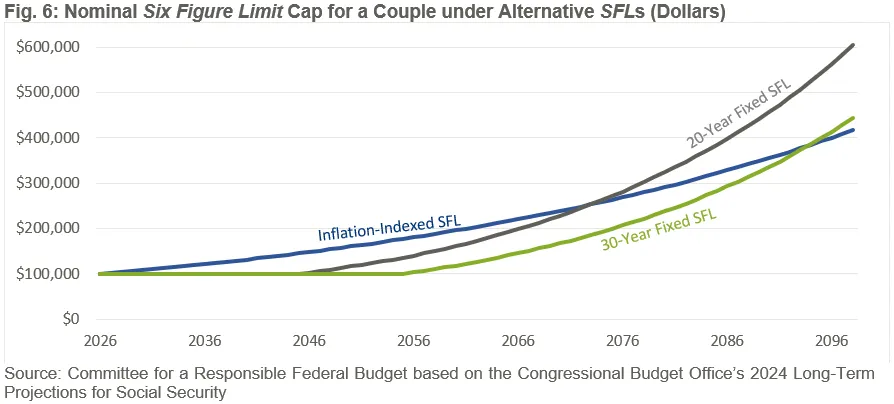
The SFL could be indexed over time in a variety of ways. For this analysis, Jason DeBacker of the Open Research Group modeled three options – a $100,000 limit indexed to inflation,5 a limit frozen in nominal terms at $100,000 for 20 years and then indexed to average wage growth, and a limit frozen at $100,000 for 30 years before being indexed to wage growth. The Inflation-Indexed SFL could also switch to wage indexing after a specified number of years.
The Six Figure Limit Would Improve Solvency
The SFL would begin generating small savings immediately that grow over time and improve the solvency of the Social Security trust funds.6 The Inflation-Indexed SFL would save $100 billion over ten years, close one-fifth of Social Security’s 75-year solvency gap, and close over half of the program’s shortfall in the 75th year. If temporarily frozen in nominal terms for 20 to 30 years, the SFL would save $190 billion over ten years, eliminate between one-quarter and one-half of the 75-year funding gap, and close one-quarter to three-fifths of the 75th-year shortfall.
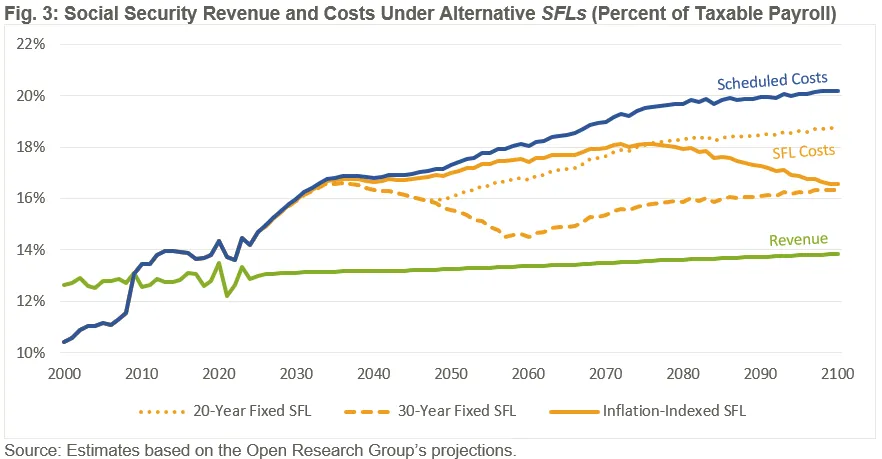
The Inflation-Indexed SFL would reduce Social Security’s shortfall by nearly 1.0% of taxable payroll over 75 years and by 3.6% of payroll in 2099. The 20-Year or 30-Year Fixed SFL would shrink the 75-year shortfall by 1.0% to 2.3% of payroll and the 75th year deficit by 1.5% to 3.9%. As a share of economic output, an SFL would reduce annual deficits by 0.5% to 1.3% of GDP by 2099.
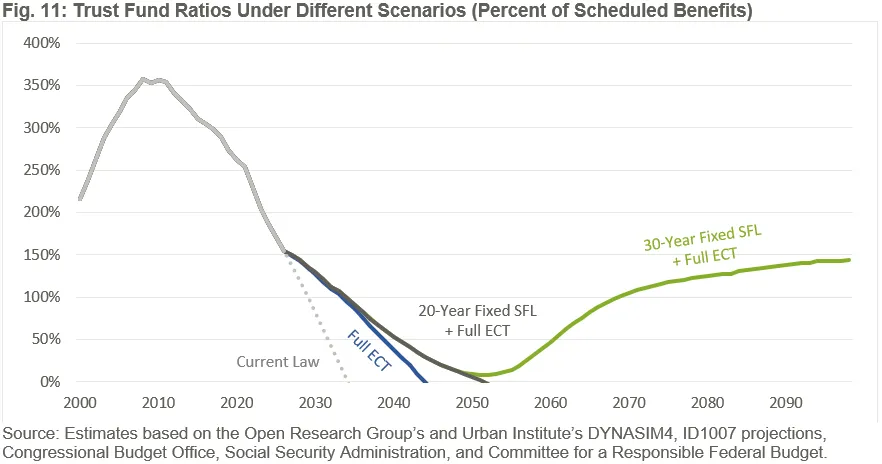
Although the SFL would not significantly delay the date of insolvency of the Social Security trust funds on its own, it could meaningfully delay insolvency in combination with other reforms. For example, the 20-Year Fixed SFL would delay insolvency by an additional seven years if enacted on top of an Employer Compensation Tax (ECT). Adding the 30-Year Fixed SFL to the ECT would permanently restore solvency for 75 years and beyond. See Appendix V for more details.
The Six Figure Limit is Highly Progressive
The SFL would progressively target benefit changes at the wealthiest retirees. In the early years, the cap would only affect the top 0.05% of couples – those with benefits above $100,000, total average retirement income above $2.5 million per year, and average net worth north of $65 million, by our rough estimates.7 The SFL reduction amounts to less than 1% of total income for these couples, even by 2040.
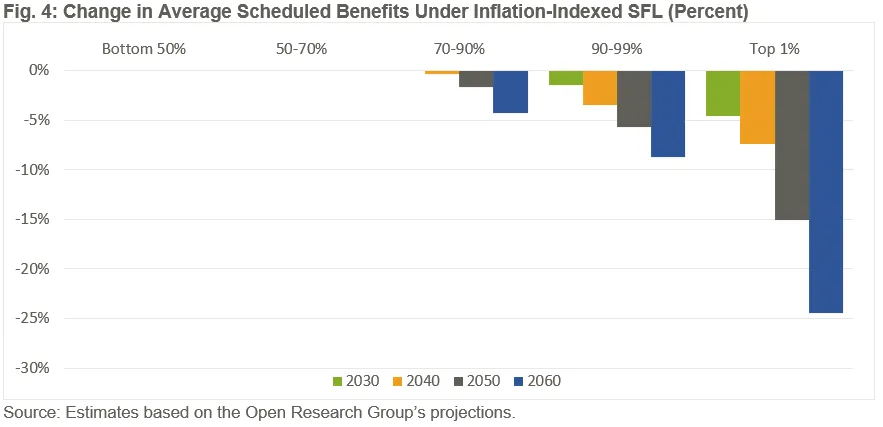
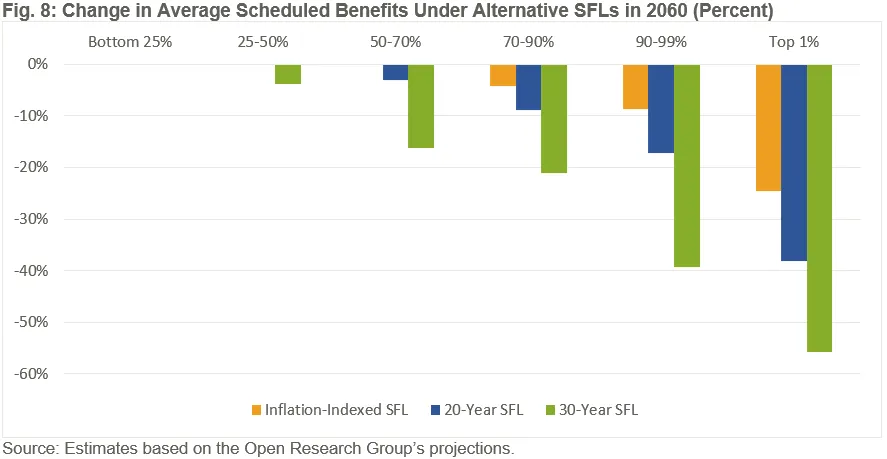
The SFL would impact more retirees over time but would remain highly progressive. In 2030, the Inflation-Indexed SFL would reduce average scheduled benefits by 5% among the top 1% without any impact on those in the bottom 90%. By 2040, the cap would reduce scheduled benefits by 7% for those in the top 1% without any impact on the bottom 80%. And by 2060, the Inflation-Indexed SFL would reduce scheduled benefits by 24% for the top 1% with no impact on the bottom 70%. In 2060, over three-fifths of the savings from this SFL would come from those in the top 10% of the income spectrum; almost one-sixth of the savings would come from those in the top 1%.
A nominally frozen SFL would extend reductions in scheduled benefits further down the income distribution in the early decades but remain highly progressive. Even under the 30-Year Fixed SFL, changes would be concentrated among the highest earners, with over 60% of the savings coming from the top quintile and at least 40% coming from the top decile by 2060. Appendix III discusses the distributional impacts of the 20-Year Fixed SFL and 30-Year Fixed SFL.
Although the SFL would reduce scheduled benefits, it would increase payable benefits for most beneficiaries, as the law limits Social Security spending to revenue after insolvency. In 2060, the inflation-indexed SFL would boost payable benefits for the bottom 80% of beneficiaries, with a 4% benefit increase for the bottom half. Under the Fixed SFL, 70% to 80% of seniors would enjoy a benefit increase, with an 8% to 25% increase at the bottom. See Appendix IV for more details.
The Six Figure Limit Addresses Social Security’s Growing Generosity at the Top
Although Social Security was originally intended to provide “some measure of protection to the average citizen … against poverty-ridden old age,” according to President Franklin Deleno Roosevelt,8 a very high-income couple can now receive about $100,000 in annual benefits.
At more than five times the poverty threshold for a retired household, such high benefits far exceed what is needed to maintain an adequate standard of living, especially when one considers that Social Security only represents one-seventh of the income of those in the top quintile.9 These benefits are also vastly higher than what other countries provide. Whereas the maximum benefit for a U.S. couple was $93,000 in 2024, it was $69,000 for a French couple, $44,000 for a Canadian couple, and $34,000 for a British couple (see Appendix II for further comparisons).
This already-high benefit is scheduled to become increasingly generous over time as benefits grow with each new cohort of retirees. In inflation-adjusted terms, the maximum benefit for a couple has doubled since 1990 and is projected to double again around 2070. By that point, the wealthiest couples will receive $200,000 in combined benefits.
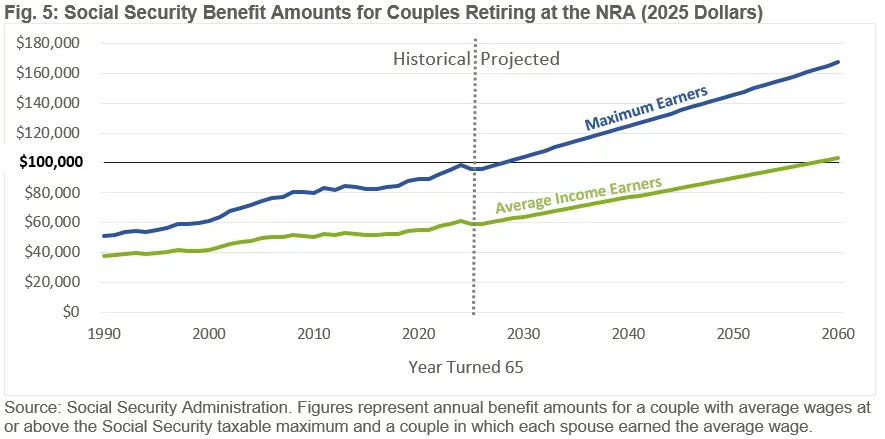
Not only is the maximum benefit scheduled to continue to grow in generosity, but a growing share of seniors will also become eligible for generous benefits. While only the highest-earning couples will collect $100,000 in benefits at first, couples with two partners making above-average lifetime wages could be eligible for $100,000 in real annual Social Security benefits by 2060.10
As benefits grow for higher-income seniors, so too will other sources of wealth and retirement income – making generous Social Security benefits less necessary, not more.11 By limiting the growing generosity of benefits for wealthy retirees, the SFL would help to restore Social Security to its intended purpose of ensuring seniors have an adequate level of retirement income.
The Six Figure Limit Would Support Economic Growth with Little Impact on Work
Overall, the Six Figure Limit is likely to support stronger economic growth by reducing unified budget deficits, increasing personal savings and investment, and improving certainty over benefit levels. These effects should more than counter the SFL’s small negative work incentives.
The SFL options modeled in this analysis would reduce public debt by 2% to 10% of GDP over 30 years and by 30% to 70% of GDP over 75 years. This debt reduction will reduce the crowd out of investment, putting downward pressure on interest rates, increasing the amount of capital (machines, factories, software, etc.) in the economy, and thus supporting stronger growth.12
Those effects would be amplified by increased private savings. A large body of research has found that workers – especially high-income workers – increase their private retirement savings in response to reductions in expected public pension benefits.13 This higher saving boosts investment, capital stock, and thus economic growth. Increased certainty over benefit levels may also improve decisions over work, savings, and investment.14
At the same time, policies that weaken the Social Security program’s connection between earnings and benefits – as the SFL does – could attenuate the program’s built-in work incentives and thus slow economic growth. Although this is a valid concern with regards to the Six Figure Limit – which effectively severs the link for workers in couples who have already accumulated $100,000 of scheduled benefits – the net impact of the SFL on work is likely to be small.
The SFL would have little negative effect on work incentives in part because it would avoid conditioning benefits on current income, thus discouraging work among beneficiaries, and in part because existing work incentives are already fairly weak at the top.15 As the program’s progressive benefit formula replaces only 15% of the last dollar of average earnings for high earners – versus 90% for low earners – benefits accrue at a low rate for anyone subject to the SFL.16 And because benefits are based on workers’ average highest 35 years of earnings, that marginal replacement rate falls dramatically further after 35 years of work.17 The return would be lower under a payable benefit scenario or in the context of progressive reforms to restore solvency.18
The negative work incentives from reducing the benefit accrual rate for some earnings would also be offset, at least in part, by the decision of some to work more to replace lost retirement income.
Overall, the Open Research Group finds that the SFL would boost ultimate economic output by up to 0.6%. Macroeconomic estimates of an across-the-board cut from Congressional Budget Office analysis suggest the SFL could potentially increase output by several percentage points.19
Importantly, while the overall economic impact of the SFL is likely to be positive, it would be wise to consider its negative effects on work in designing other elements of a comprehensive reform plan that includes the SFL. Continued work at older ages has numerous macroeconomic, fiscal, financial, medical, and social benefits, and should be encouraged where possible.20
Conclusion
With the Social Security retirement trust fund less than seven years from insolvency, some combination of higher revenue and lower scheduled benefits are necessary to avert an abrupt across-the-board benefit cut and avoid pressure to enact a massive deficit-financed general revenue transfer. Policymakers must act soon to set Social Security on a financially stable course.
Given the Social Security program’s large structural funding gap, it is questionable whether the program should be distributing $100,000 a year to some of the wealthiest people in the world. As an income support program, there is a good case that Social Security should provide a base of retirement income, not a windfall.
The Six Figure Limit would allow Social Security to continue paying benefits sufficient to ensure adequate retirement security for virtually all Americans covered by the program while capping those benefits at $100,000 per couple – a cap more than five times the senior poverty threshold.
The SFL would meaningfully slow the growth in Social Security’s burgeoning generosity at the top, limiting benefits from growing too far past what is necessary to provide for “a measure of protection” in old age.
It would do so in a progressive way by targeting those with the very highest lifetime incomes who are generally the wealthiest Americans. By 2060, two- to three-fifths of the savings from the SFL would come from those in the top 10% of the income spectrum. Little to none would come from the bottom half.
The SFL is also likely to improve economic growth, with the benefits of lower deficits and higher retirement savings more than outweighing modest work disincentives.
Most importantly, the SFL would improve the solvency of the Social Security trust funds. Depending on how the limit is set, it would close between one-fifth and one-half of Social Security’s 75-year shortfall and reduce one-quarter to three-fifths of the program’s annual deficits by 2099. While the SFL would not delay insolvency on its own, enacting it in combination with other thoughtful trust fund solutions could restore solvency for 75 years and beyond.
The Committee for a Responsible Federal Budget does not endorse any particular solution to restore solvency to Social Security. The Six Figure Limit presented in this paper should be added to the library of potential options lawmakers consider when crafting a broader reform package. The insolvency of the Social Security trust funds is less than a decade away, and trust fund solutions are urgently needed.
Appendix I – Design Elements for the Six Figure Limit
The Six Figure Limit (SFL) would initially cap benefits at $100,000 for couples who both begin collecting at the NRA, with that cap adjusted based on number of beneficiaries and their collection age.21 The limit would be reduced in half to $50,000 for single beneficiaries. For those who collect before or after the NRA, the limit would be adjusted upward or downward based on actuarial reductions and bonuses – 30% lower (to $70,000) for a couple collecting at age 62 and 24% higher ($124,000) for a couple claiming at 70. Different claiming ages would result in a blended limit. For example, the limit would be $85,000 if one spouse collected at 62 and the other at the NRA of 67.
The SFL could be set to grow over time in any number of ways. For this Trust Fund Solutions Initiative paper, the Open Research Group modeled three alternatives.
The Inflation-Indexed SFL grows the limit annually at the rate of the Chained Consumer Price Index for All Urban Consumers (C-CPI-U). This effectively holds the cap constant in real dollars but affects an increasing number of beneficiaries over time as benefits become more generous, particularly for new beneficiaries. While the Inflation-Indexed SFL was modeled to grow with inflation forever, it could be re-indexed to wages after some saving or solvency goal is met.
Meanwhile, the 20-Year Fixed SFL and 30-Year Fixed SFL hold the limit fixed in nominal terms at $100,000 for a period of time and then index it to growth in average wages indefinitely. This approach effectively “phases in” a tighter cap, in real terms, and then maintains the level of that cap relative to the level of wages in the overall economy.22
The Fixed SFLs impact more beneficiaries – and achieve greater savings – in earlier years versus the inflation-indexed limit. This approach may prove effective in generating upfront savings and “buying time” for other solvency-enhancing policies to phase in. Some possible changes might ultimately reduce how binding the SFL is over time by lowering initial benefits at the top.23
Appendix II – An International Perspective on Maximum Social Security Benefits
The maximum Social Security benefit in the U.S. is significantly higher than other public pension benefits around the world. Few if any countries – even high-income countries with generous welfare states – allow for a couple to collect $100,000 in public pension benefits.24
In this Appendix, we compare the maximum benefit amounts of 10 public pension systems from countries with broadly similar economic characteristics – but diverse pension systems – as the United States: Australia, Canada, Denmark, France, Ireland, Japan, Netherlands, New Zealand, and the United Kingdom. Supplementary and private pensions were excluded from this analysis.
In 2024, an American couple collecting at the NRA could receive maximum Social Security benefits of more than $93,000. That’s three times as high as most English-speaking countries such as Australia, New Zealand, Ireland, and the United Kingdom, which offered a maximum benefit of $30,000 to $36,000 per couple. It’s twice as high as Canada or the Netherlands, where the maximum benefit is $44,000 and $42,000, respectively. And it’s more than one-third higher than France and one-fifth higher than Japan – two countries with generous maximum payments – where couples can collect up to $70,000 and $78,000 per year, respectively.25
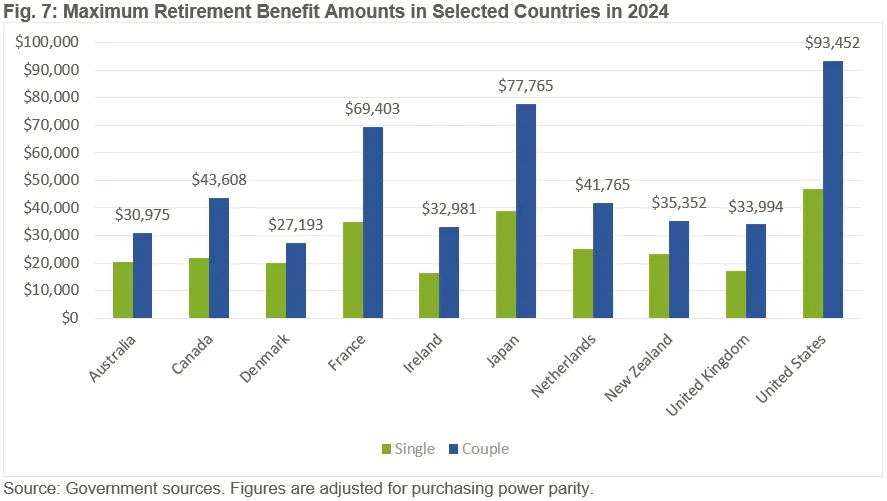
These differences emerge regardless of the form of the pension system. Countries with flat benefits (Denmark, Netherlands, New Zealand), means-tested benefits (Australia), work-related benefits (Ireland, United Kingdom), and earnings-related benefits like the United States (Canada, France, Japan) all offer lower maximum benefits than the United States.
Appendix III – Distributional Impacts of Different Six Figure Limits
Any version of the Six Figure Limit will be progressive, but distributional outcomes vary by design. The 20-Year Fixed SFL would reduce scheduled benefits further than the Inflation-Indexed SFL and impact retirees further down the income spectrum through 2076. The 30-Year Fixed SFL would do so through 2100. Beyond those points, the Inflation-Indexed SFL is more binding.
Through 2060, the bottom half of beneficiaries would see little to no changes in their scheduled benefits under any version of the SFL. In 2060, the top 1% of beneficiaries would face a 24% reduction under the Inflation-Indexed SFL, a 38% reduction under the 20-Year Fixed SFL, and a 56% reduction under the 30-Year Fixed SFL.
By comparison, those in the 90th to 99th percentile would face reductions of 9%, 17%, and 39% reductions under each SFL, respectively. And those in the 50th to 75th percentiles would see a negligible change under the Inflation-Indexed SFL, a modest 3% reduction under the 20-Year Fixed SFL, and a 16% reduction under the 30-Year Fixed SFL.
In 2060, nearly all of the savings under each of the SFLs would come from high-income seniors. Under the Inflation-Indexed SFL, almost 90% of savings would come from the richest fifth of seniors, with 15% of savings coming from the top 1%. Under the 20-Year Fixed SFL, three-quarters of savings would come from the top 20%, with a tenth from the top 1%. Finally, three-fifths of the 30-Year Fixed SFL’s savings would be generated from the top quintile, with a twentieth coming from the richest 1%.
None of the savings would come from the bottom half of retirees under the Inflation-Indexed or 20-Year Fixed SFL, and less than 5% would under the 30-Year Fixed SFL.
Appendix IV – Impact of Six Figure Limit on Payable Benefits
Because Social Security is prohibited from spending in excess of its revenue and reserves, adjustments to scheduled benefits change the distribution and the level of payable benefits. In other words, the Six Figure Limit reduces some benefits in order to increase others by mitigating the 24% across-the-board benefit cut mandated under the law.
The Inflation-Indexed SFL, for example, would increase payable benefits for the bottom 90% of retirees in 2035 and for 80% of retirees by 2060. Under the 20-Year or 30-Year Fixed SFLs, the bottom 80% would experience an increase in payable benefits in 2035. By 2060, retirees in the bottom 70% to the bottom 80% would see their payable benefits increase.
In 2060, the Inflation-Indexed SFL would increase payable benefits by 4% for the bottom half versus 8% under the 20-Year Fixed SFL and between 20% and 25% under the 30-Year Fixed SFL.
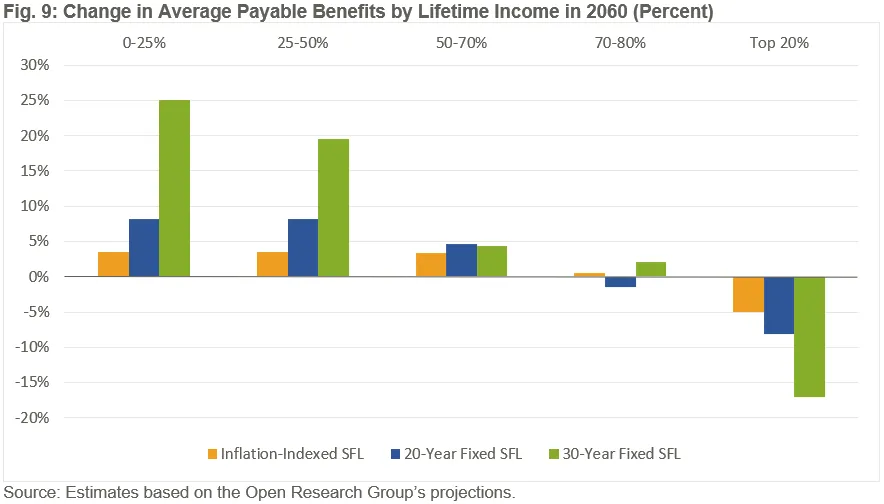
Even those somewhat higher up the income ladder – in the 50th to 70th percentile – would see a 3% to 5% increase under the SFL. Only the top 20% of retirees would see meaningful decreases in their payable benefits, with most of that reduction concentrated in the top 10%.
The SFL would increase payable benefits much more if combined with other options to restore Social Security solvency. For example, enacting the 30-Year Fixed SFL in combination with an Employer Compensation Tax would increase payable benefits for 90% of beneficiaries by 2060, boosting payable benefits by over a third for the bottom half of retirees, by 13% for those in the 50th to 70th percentile, and by 7% for those in the 70th to 90th percentile.
Appendix V – Six Figure Limit in Combination with Other Policies
Because only a tiny fraction of couples will collect over $100,000 in benefits in the near term, the SFL would do little to delay Social Security insolvency beyond the currently projected 2032 for the retirement program or 2034 for the theoretically combined trust funds. Nor would any SFL version we modeled save enough to close Social Security’s 75-year funding gap. In combination with other policies, however, the SFL could meaningfully extend or fully restore solvency.
As an example, combining the Inflation-Indexed SFL with our recently introduced Employer Compensation Tax (ECT) would close three-quarters of Social Security’s funding gap and nearly all of the 75th year deficit.26 Combining the 30-Year Fixed SFL and the ECT would achieve sustainable solvency over 75 years and beyond.27
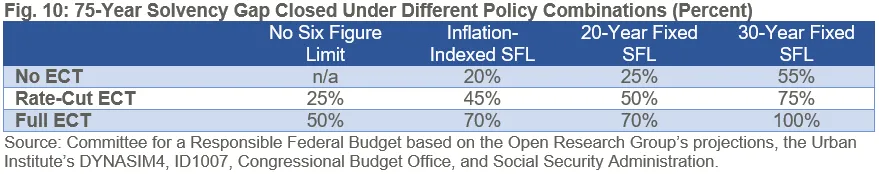
Adding the SFL to the ECT would significantly delay Social Security’s insolvency date. While the ECT would delay insolvency by ten years on its own, combining it with the 20-Year Fixed SFL would delay insolvency by 17 years. Combining the ECT with the 30-Year Fixed SFL would restore solvency over 75 years and beyond, producing a growing trust fund balance beyond 2050.
Endnotes
1 The simulations were run by Jason DeBacker of the Open Research Group using their OG-Core model – a large-scale overlapping-generations (OG) model of an economy that allows for dynamic general equilibrium analysis of fiscal policy. Simulations assume a 2026 start date and were aligned with the assumptions of the Congressional Budget Office’s (CBO) 2024 Long-Term Projections for Social Security. Due to legislative changes and other differences, CBO now estimates that the Social Security Old-Age, Survivors, and Disability Insurance program faces a larger funding gap compared to its previous projections. The Social Security Trustees project a smaller funding gap than CBO. We are enormously grateful to Jason DeBacker of the Open Research Group for modeling these options and patiently dealing with our many questions. For more information about OG-Core, visit Open Research Group’s website.
2 In 2026, a maximum-earning couple retiring at their NRA of exactly 66 and 10 months will receive roughly $99,600 in combined annualized benefits. An equivalent couple claiming at 67 this year will receive $101,000 or $124,000 if collecting at 70. By 2028, this kind of couple will receive a projected $101,500 benefits if they retire at their NRA of 67 and $131,800 if retiring at 70. Currently, over 1 million beneficiaries receive benefits at or in excess of $50,000 annually, which would correspond to $100,000 for a couple if any two of these beneficiaries were married to one another.
3 Two aspects of the Social Security benefit formula cause benefits to become increasingly large in inflation-adjusted terms over time. The first is that benefits are based on workers’ earnings over their career, meaning benefits grow as each generation of workers becomes richer and earn higher incomes. The second is that the earnings input into the benefit formula and the Primary Insurance Amount “bend points,” which determine what share of past earnings benefits replace, are indexed for growth in average wages. As a result, if average wages grow in inflation-adjusted terms over time, Social Security benefits replace a larger share of any given amount of real earnings with each subsequent generation.
4 The same cap would also apply to disability benefits. Although not detailed in this paper, special caps could be set for certain types of auxiliary benefits. For example, widow(er) benefits could be limited to $75,000 (halfway between the single and couple cap) and/or a secondary $87,500 cap could be applied on top of existing “family maximums,” mimicking the existing family maximum at 175% of the primary worker's PIA for high earners.
5 In order to keep up with inflation, the Inflation-Indexed SFL would be indexed for growth in the Chained Consumer Price Index for Urban Consumers (C-CPI-U).
6 Although a $100,000 limit would not affect even two maximum-earning beneficiaries claiming at their NRA (66 and 10 months) in 2026, it would impact some beneficiaries with higher or lower claiming ages. For example, maximum earners claiming at age 70 would face a limit of $124,000 ($62,000 for singles) in 2026. According to the Social Security Administration, maximum earners claiming at age 70 could receive benefits above that amount in 2025. In December 2025, nearly 25,000 retired worker beneficiaries received benefits at or above $62,000. Similarly, a maximum-earning couple collecting at age 62 in 2026 could receive up to $71,300 in benefits compared to the SFL cap of $70,000. Importantly, the small number of beneficiaries who face reductions in 2026 would face only very small reductions.
7 Figures estimated by taking the mean of household income and net worth among the top 1% of senior households, defined as having a head-of-household at age 65 or older, by net worth in the Federal Reserve’s 2022 Survey of Consumer Finances, adjusted for growth in the Personal Consumption Expenditures Price Index between 2022 and 2025. This estimate is a lower bound as it includes older households with less net worth than those in the top 0.05%.
8 Social Security Administration. “Presidential Statement Signing the Social Security Act – August 14, 1935.” Social Security History, Social Security Administration. August 14, 1935.
9 The Social Security Administration’s Modeling Income in the Near Term (MINT 8.23) model of retirement income projected Social Security benefits would, on average, make up 14% of income for the top 20% of age 60+ households in 2024.
10 The 2025 Social Security Trustees Report, Table V.C7, projects that a medium-wage worker – one who earns an average $230,300 in 2057 wage-indexed dollars – who claims at the NRA in 2060 will receive an annual benefit of $44,543 in CPI-indexed dollars, which is roughly $50,250 in GDP price-indexed dollars.
11 Between 2025 and 2065, incomes among the richest fifth of retirees – those most likely to be impacted by the SFL –which includes income from assets and earnings as well as Social Security benefits, will grow by 27% in inflation-adjusted terms, according to the Urban Institute’s DYNASIM3 projections.
12 Higher government borrowing “crowds out” private investment in productive capital such as factories, equipment, and software by diverting private savings away from private investment and toward public borrowing. This effect occurs primarily through the interest rate channel, whereby higher debt pushes up interest rates. Although these higher interest rates induce more private savings and international financing, they reduce total national savings as public borrowing rises more than private savings. The effect of this outcome is less private investment, slower growth in the capital stock, and ultimately slower income and output growth. On net, the Congressional Budget Office estimates every 1% of GDP increase in the debt boosts interest rates by 2 basis points and every one dollar increase in federal borrowing crowds out 33 cents worth of private investment. For more information, please see Huntley, Jonathan. “The Long-Run Effects of Federal Budget Deficits on National Saving and Private Domestic Investment.” Congressional Budget Office, Working Paper 2014-02. February 2014; Congressional Budget Office. “The Economic Effects of Waiting to Stabilize the Federal Debt.” Congressional Budget Office. April 2022; and Nelson, Jaeger. “Effects of Federal Borrowing on Interest Rates and Treasury Markets.” Congressional Budget Office. March 2025.
13 Congressional Budget Office. “Social Security and Private Saving: A Review of the Empirical Evidence.” Congressional Budget Office. July 1998; Gale, William G. “The Effects of Pensions on Household Wealth: A Reevaluation of Theory and Evidence.” Journal of Political Economy Vol. 106(4). August 1998; Attanasio, Orazio P. and Agar Brugiavini. “Social Security and Households’ Savings.” The Quarterly Journal of Economics Vol. 118(3). August 2003; Attanasio, Orazio P. and Susann Rohwedder. “Pension Wealth and Household Saving: Evidence from Pension Reforms in the United Kingdom.” American Economic Review Vol. 93(5). December 2003; Lindeboom, Maarten and Raymond Montizaan. “Disentangling Retirement and Savings Responses.” Journal of Public Economics Vol. 192. December 2020; and Halvorsen, Elin et al. “Social Security Pension and the Effect on Household Saving.” The Scandinavian Journal of Economics Vol. 126(3). July 2024.
14 Recent research suggests individuals value certainty over their Social Security benefits at about 10% of the expected value of their currently scheduled lifetime benefits.
15 Goda, Gopi Shah, John B. Shoven, and Sita Nataraj Slavov. “Removing the Disincentives in Social Security for Long Careers.” National Bureau of Economic Research, Social Security in a Changing Environment. June 2009; Feldstein, Martin and Andrew Samwick. “Social Security Rules and Marginal Tax Rates.” National Tax Journal Vol. 45(1). March 1992; and Butrica, Barbara A. et al. “The Implicit Tax on Work at Older Ages.” National Tax Journal Vol. 59(2). June 2006.
16 The Social Security’s benefit formula replaces 41% of average monthly indexed wages (AIME) for an average-wage couple compared to 27% of AIME for a couple collecting $100,000. However, what matters more is what it replaces for each marginal dollar of earnings or marginal year of work. The Social Security benefit formula replaces only 15% of a worker’s marginal earnings once their average lifetime earnings are above $93,000. Because the average is calculated based on the highest 35 years, this in practice means a lifetime maximum earner would experience a 15% replacement rate on all earnings after their first 20 years of work. Once an individual has more than 35 years of work, the replacement rate declines further – often dramatically – as additional years of coverage replace rather than add to existing years.
17 Reznik, Gayle L., David A. Weaver, and Andrew G. Biggs. “Social Security and Marginal Returns to Work Near Retirement.” Social Security Administration, Issue Paper No. 2009-02. April 2009.
18 For example, reducing the top PIA factor from 15% to 5% would shrink the already-small return on work by two-thirds.
19 The Congressional Budget Office (CBO) recently estimated that limiting benefits to revenue after insolvency would boost GDP by 1% after only four years of savings. A 2023 analysis found that the same policy would boost gross national product (GNP) by 4.5% after 20 years of savings. Comparing the 30-Year Fixed SFL annual and cumulative savings to those numbers suggests it might boost GNP by 1% to 4% after 30 years and an increasing amount thereafter.
20 Butrica, Barbara, Karen E. Smith, and C. Eugene Steuerle. 2006. “Working for a Good Retirement.” Urban Institute Discussion Paper 06-03. https://www.urban.org/research/publication/working-good-retirement; Kuhn, Michael and Klaus Prettner. 2022. “Rising Longevity, Increasing the Retirement Age, and the Consequences for Knowledge-based Long-run Growth.” Economica 90 (357): 39-64. https://onlinelibrary.wiley.com/doi/full/10.1111/ecca.12445; Bronshtein, Gila et al. 2018. “The Power of Working Longer.” National Bureau of Economic Research Working Paper 24226. https://www.nber.org/papers/w24226; Patacchini, Eleonora and Gary V. Engelhardt. 2016. “Work, Retirement, and Social Networks at Older Ages.” Center for Retirement Research at Boston College Working Paper 2016-15. https://crr.bc.edu/wp-content/uploads/2016/11/wp_2016-15.pdf; Sewdas, Ranu et al. 2020. “Association Between Retirement and Mortality: Working Longer, Living Longer? A Systematic Review and Meta-Analysis.” Journal of Epidemiology and Community Health 74 (5): 473-480. https://pmc.ncbi.nlm.nih.gov/articles/PMC7307664/; Li, Jiannan, Bocong Yuan, and Junbang Lan. 2021. “The Influence of Late Retirement on Health Outcomes Among Older Adults in the Policy Context of Delayed Retirement Initiative: An Empirical Attempt of Clarifying Identification Bias.” Archives of Public Health 79 (59). https://pmc.ncbi.nlm.nih.gov/articles/PMC8077823/; Banks, James et al. 2025. “The Impact of Work on Cognition and Physical Disability: Evidence from English Women.” Labour Economics 94. https://www.sciencedirect.com/science/article/pii/S0927537125000545.
21 This somewhat resembles a similar proposal by Andrew Biggs, which would have capped individual benefits at the maximum benefit amount at the NRA – $42,238 in 2023 ($44,364 in 2025 dollars) – and adjusted the cap forward for inflation.
22 Over time, the Fixed SFL would modestly but increasingly impact current beneficiaries even as it is mainly applied to new beneficiaries. Because retirees receive annual cost-of-living adjustments (COLAs) based on CPI-W inflation, some couples receiving less than $100,000 in 2026 will ultimately receive more than $100,000, in nominal dollars, in future years. For example, a couple collecting $90,000 of benefits in 2026 would collect over $100,000 by 2031 under CBO’s and the Trustees’ projections. The Inflation-Indexed SFL would largely avoid impacting current retirees but could still affect some by a small amount since the limit is indexed to growth in the Chained CPI-U (widely regarded as a more accurate measure of inflation) while existing COLAs grow benefits with the fixed-weight CPI-W – which tends to grow about 30 basis points faster per year, on average.
23 An SFL could be a useful complement to some revenue-increasing policies by reducing or mitigating their costs. For example, reforms that would raise Social Security’s taxable maximum or broaden the payroll tax base often would increase program costs by paying additional benefits on newly covered compensation. The SFL, by limiting how high those additional benefits can be, would relax this trade-off, producing additional savings.
24 Organization for Economic Cooperation and Development. “Pensions at a Glance 2025: OECD and G20 Indicators.” Organization for Economic Cooperation and Development. November 2025.
25 Figures assume a 40-year working career.
26 We previously found that enacting an Employer Compensation Tax (ECT) would close two-thirds of Social Security’s solvency gap when the provision was scored under the 2024 DYNASIM model based on projections from the 2024 Social Security Trustees Report. When scored against the same baseline as our SFL – the Congressional Budget Office’s 2024 Long-Term Projections for Social Security, which, like the 2024 Trustees Report, excludes the effects of the Social Security Fairness Act and the One Big Beautiful Bill Act – we very roughly estimate that a Full ECT would close 50% of Social Security’s solvency gap. For this reason, and because of a delay in the assumed start date, we estimate the ECT would only delay insolvency by ten years under a comparable SFL baseline compared to 20 years as originally estimated.
27 There would be almost no interaction between the SFL and the ECT. However, the SFL could significantly interact with other policies. For example, combining the SFL with an increase in the Social Security taxable maximum could save more than the sum of its parts as the SFL would reduce the additional benefits paid because of additional contributions. On the other hand, combining the SFL with a COLA cap or progressive changes to the initial benefit would save less than the sum of its parts – though the SFL could be a way to “front load” limits to benefits for higher earners while a new benefit formula was phased in gradually for new retirees.