Top 10 Fiscal Charts of 2023
Fiscal policy was once again at the forefront of congressional debates in 2023, giving us many opportunities to write about and illustrate the different policy actions and outlooks for the budget and economy. This year we published nearly 200 different analyses, and from those we have selected our top ten charts of the year below.
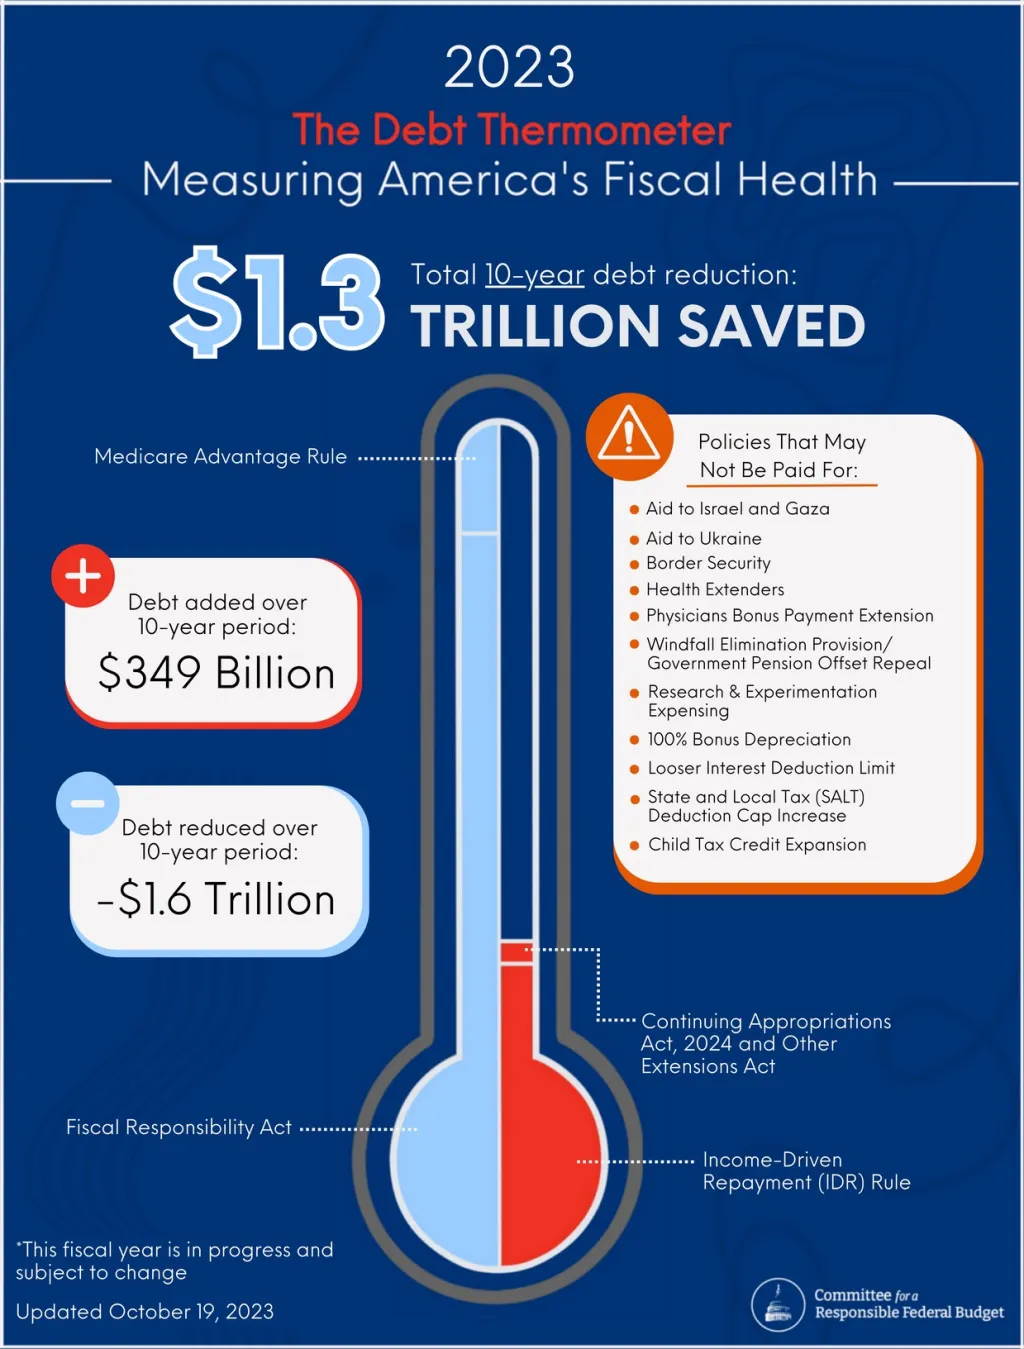
1. $1.3 Trillion of Deficit Reduction
We introduced the Debt Thermometer this year to create more transparency around fiscal policy that is enacted through legislation and executive orders in a given year. In 2023, policymakers enacted $1.3 trillion of ten-year deficit reduction – the most since 2011. This included $1.6 trillion in gross ten-year savings, partially offset by nearly $350 billion of ten-year costs. While this represents important progress, ongoing negotiations could lead to a costly tax cut and spending package early next year. Without offsets, such an agreement could undermine this year's gains.
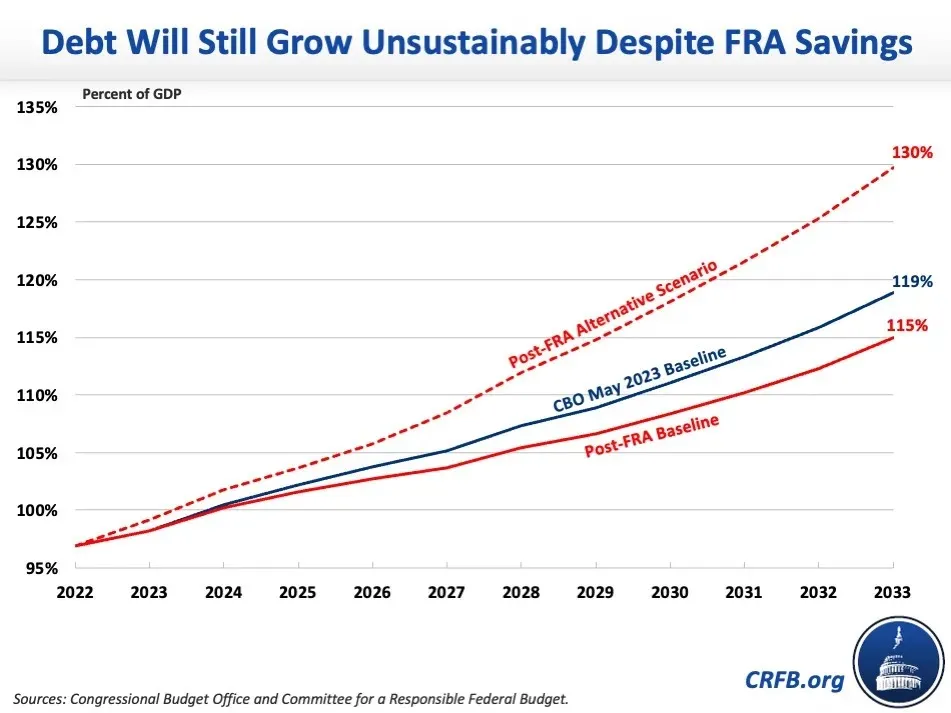
2. The National Debt is Headed Towards Record Levels
In May, the Congressional Budget Office (CBO) projected that debt would grow by $22.1 trillion over ten years, reaching $46.7 trillion by the end of Fiscal Year (FY) 2033 and rising from 97 percent of Gross Domestic Product (GDP) at the end of 2022, to a record 107 percent of GDP by 2028 - eclipsing the record of 106 percent set just after World War II. Debt will continue to grow thereafter, reaching 119 percent of GDP by the end of 2033.
In June, the nation’s fiscal outlook improved when Congress passed the Fiscal Responsibility Act (FRA). CBO now projects that debt will instead reach 115 percent of GDP by 2033 – far from sustainable, but improved nonetheless. However, if policymakers extend costly tax cuts and subsidies without offsets, grow discretionary spending with the economy instead of inflation after the FRA's caps expire, adopt the 'side deals' cut alongside the FRA, and revenue collection continues to prove weaker than expected, we estimate debt would increase by an additional $5.7 trillion, to $50.9 trillion or a record 130 percent of GDP by the end of 2033.
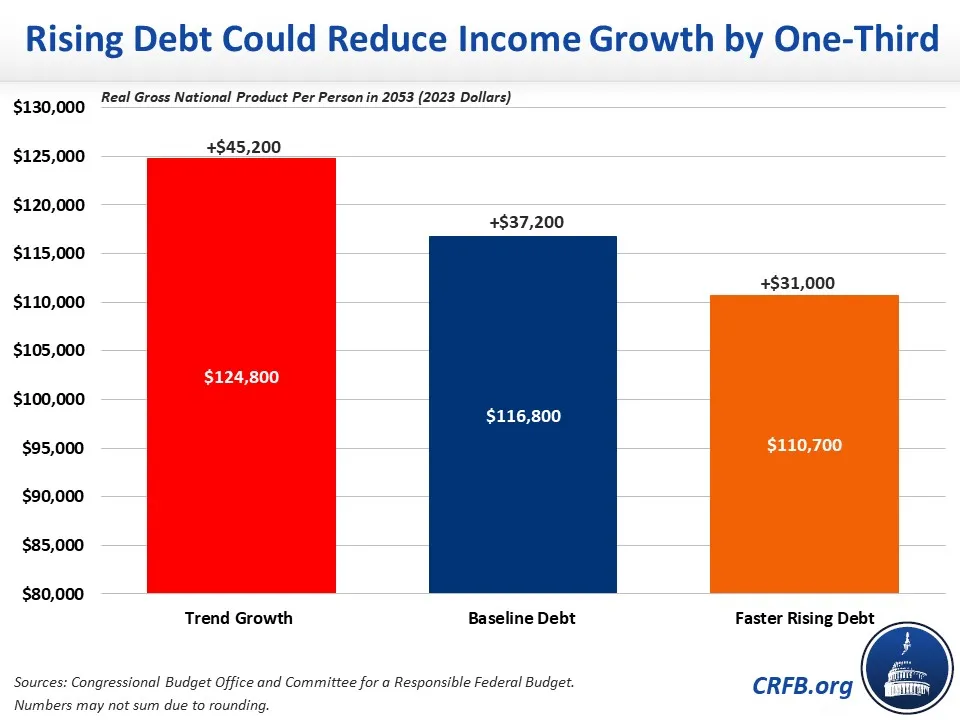
3. Rising Debt Has Negative Consequences
There are many risks and threats posed by a high and rising national debt, including straining the federal budget, hurting the country's economic strength, creating geopolitical challenges, making it difficult to respond to new emergencies, and more. Among those threats is one that can lower personal income and wage growth. According to CBO, rising debt under current law will reduce income growth by one-sixth and further increases to debt could reduce income growth by as much as one-third.
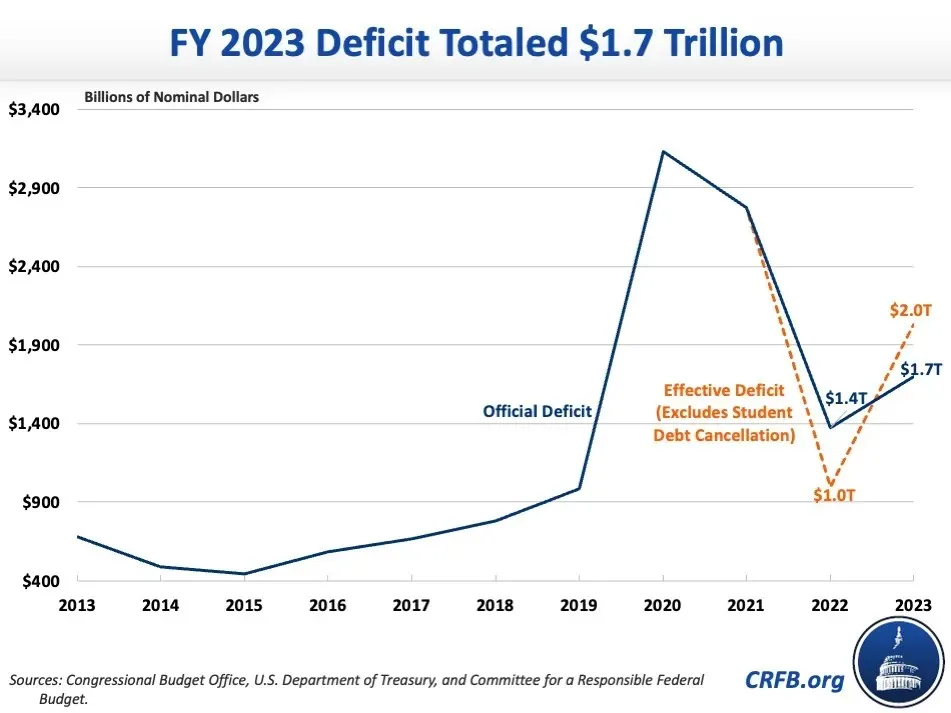
4. The Deficit Effectively Doubled
The FY 2023 deficit totaled $1.7 trillion, up from $1.4 trillion in 2022. Removing the effects of announced student debt cancellation that the courts ruled illegal, the effective deficit doubled from $1 trillion in 2022 to $2 trillion in 2023. As a share of the economy, the deficit was 6.3 percent of GDP, and the effective deficit was 7.5 percent of GDP – which was larger than any time in U.S. history outside of a war, recession, or national emergency.
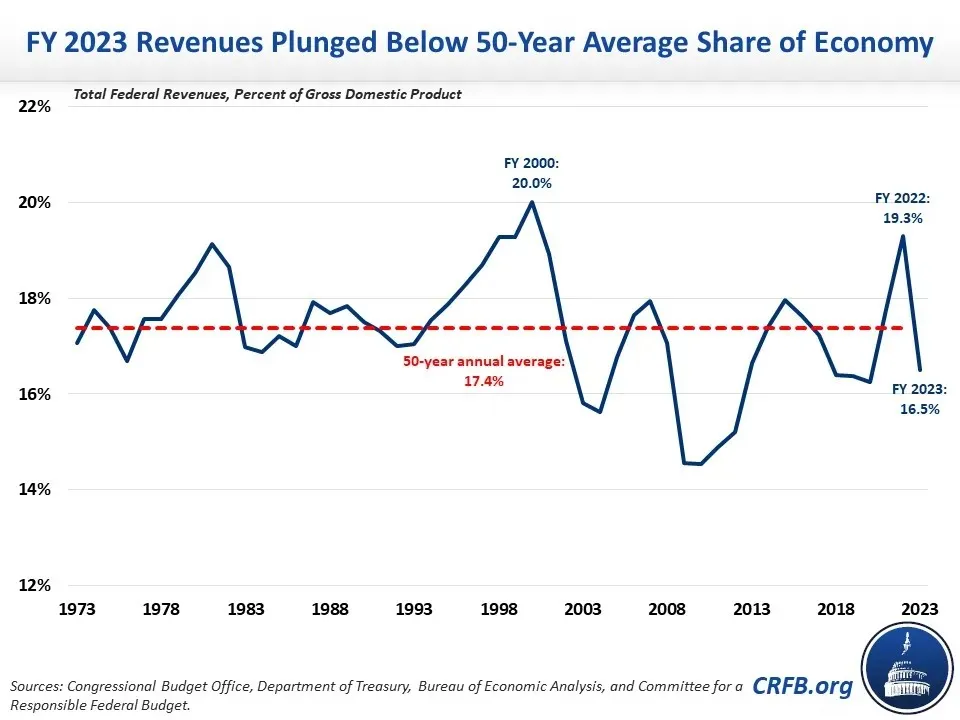
5. Revenue Surge Comes to an End
After peaking at 19.3 percent of GDP in 2022, revenue in FY 2023 fell by nearly $460 billion in nominal terms, or 9 percent, to 16.5 percent in 2023. That puts revenue below the 50-year historical average of 17.4 percent and below the 17.2 percent projected after the passage of the TCJA. High revenues in 2022 were bolstered by unusually high capital gains realizations and spiked by one-time windfalls from inflation. 2023 revenue also fell likely due to delayed tax payments from states affected by natural disasters, Federal Reserve remittances drying up due to high interest rates, and an uptick in (possibly fraudulent) claiming of the Employee Retention Tax Credit. Although revenue may rise some in the coming years, levels are now much closer to their steady state than in 2022.
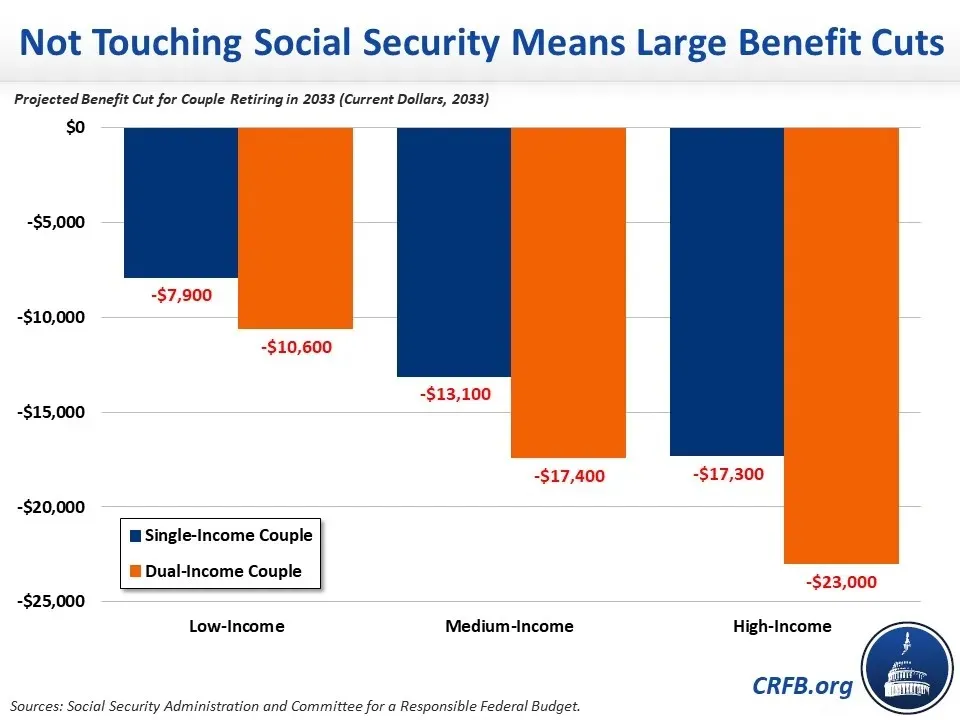
6. As Social Security Approaches Insolvency, Beneficiaries Face a $17,400 Cut
Under the latest Trustees projections, Social Security’s Old-Age and Survivors Insurance (OASI) trust fund will run out of reserves by 2033, when today’s 57-year-olds reach the normal retirement age and today’s youngest retirees turn 72. Throughout the 2024 election, as discussed in US Budget Watch 2024, presidential candidates have faced pressure to promise not to touch Social Security. However, inaction on the retirement fund will lead to insolvency in just ten years, and upon insolvency, beneficiaries will see a 23 percent across-the-board benefit cut – that’s $17,400 in annual benefits for a typical newly retired dual-income couple.
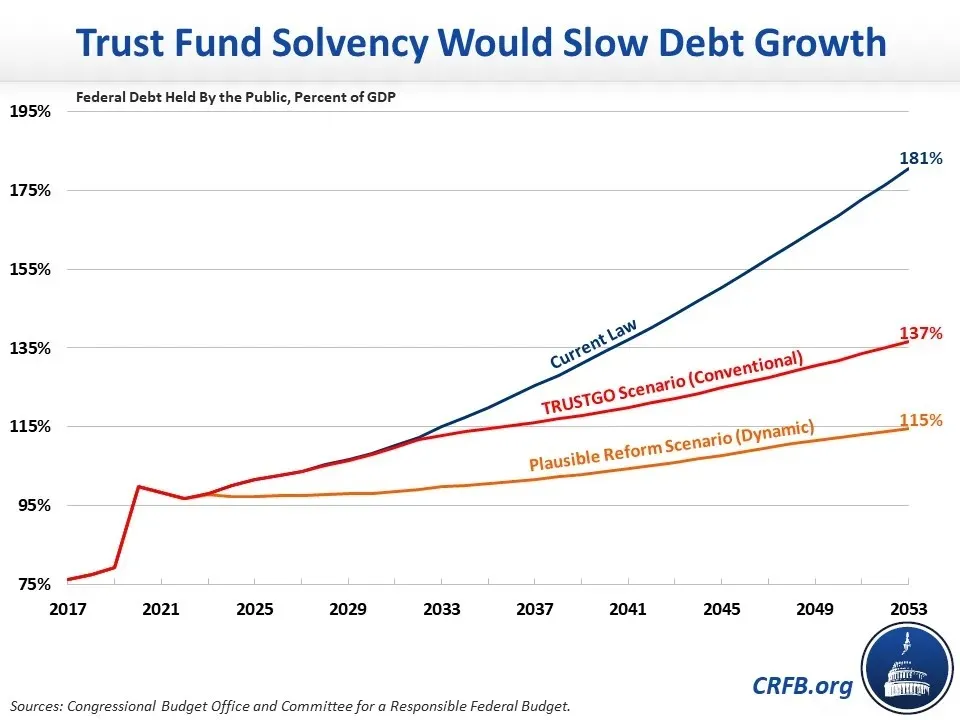
7. Restoring Trust Fund Solvency Would Slow Debt Growth
In its June 2023 Long-Term Budget Outlook, CBO projected debt would reach 181 percent of GDP by the end of 2053. These projections assume that scheduled spending on Social Security, Medicare, and highways will continue even after trust funds are depleted. Under our TRUSTGO baseline, which assumes no new trust fund borrowing is allowed either through solvency being achieved or lawmakers allowing cuts to take place, growth of debt would slow to 137 percent of GDP by the end of FY 2053. A set of pro-growth reforms to those programs could reduce debt to as low as 115 percent of GDP by the end of 2053.
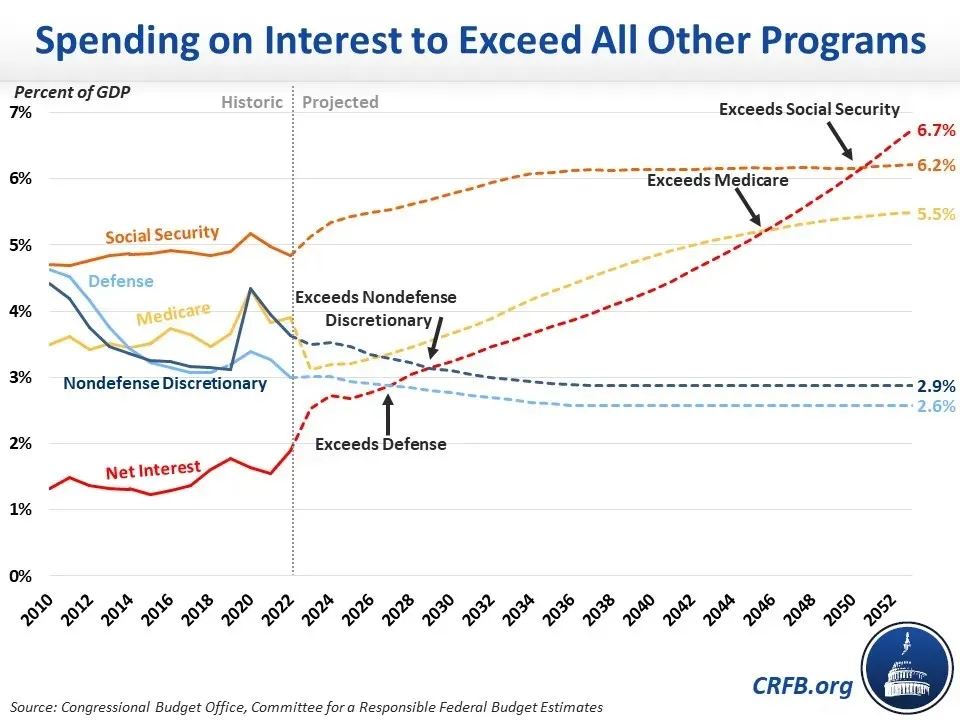
8. Interest Is The Fastest Growing Part of the Budget
After hitting a nominal dollar record of $475 billion in Fiscal Year (FY) 2022, interest increased by nearly 40 percent to $659 billion in FY 2023. The problem of high interest rates will only get worse – CBO projects that net interest will continue to grow and exceed its record as a share of the economy, 3.2 percent, by 2030. Net interest costs will total $1.4 trillion, or 3.6 percent of GDP, by 2033.
Last year, the federal government spent more on interest than on children or on Medicaid. By 2027, spending on interest is on track to exceed defense spending. And by 2051, interest will be the largest government program, surpassing Social Security.
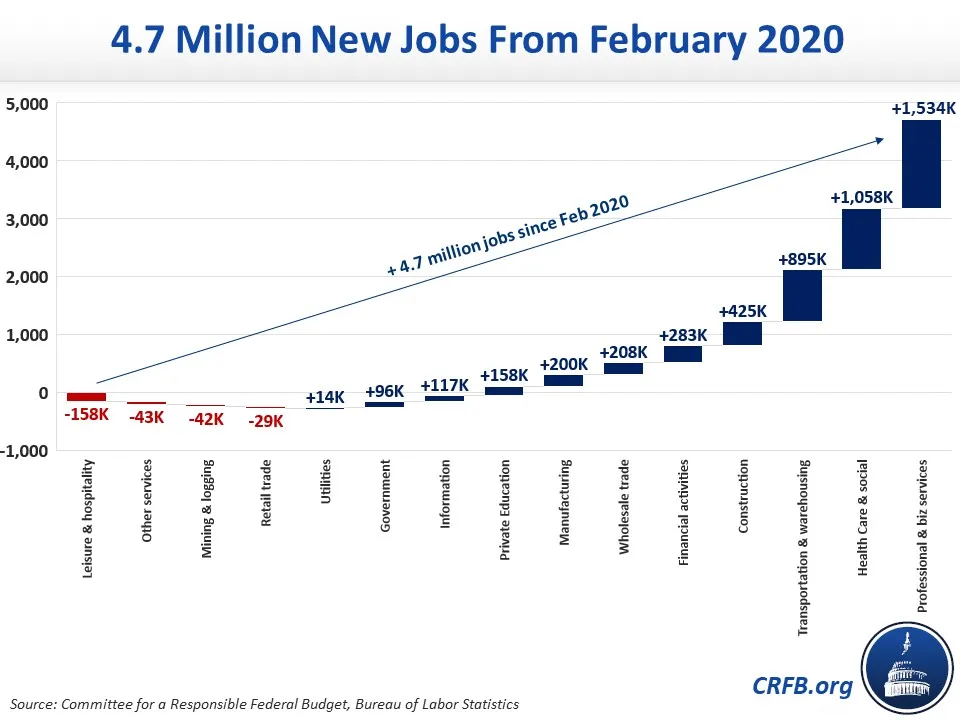
9. The Labor Market Is Strong
The United States has added 4.7 million jobs since just before the pandemic, in February of 2020. That's despite a loss of 22 million jobs between February and April of 2020. Among the jobs added, more than 1.5 million are in professional and business services, over 1 million jobs in health care and social assistance, nearly 900,000 transportation and warehousing jobs, and over 400,000 construction jobs. There are still nearly 160,000 fewer jobs in leisure and hospitality than before the pandemic. Thanks in part to these job gains, the unemployment rate was 3.7 percent as of November of 2023 -- which is extremely low by historic standards.
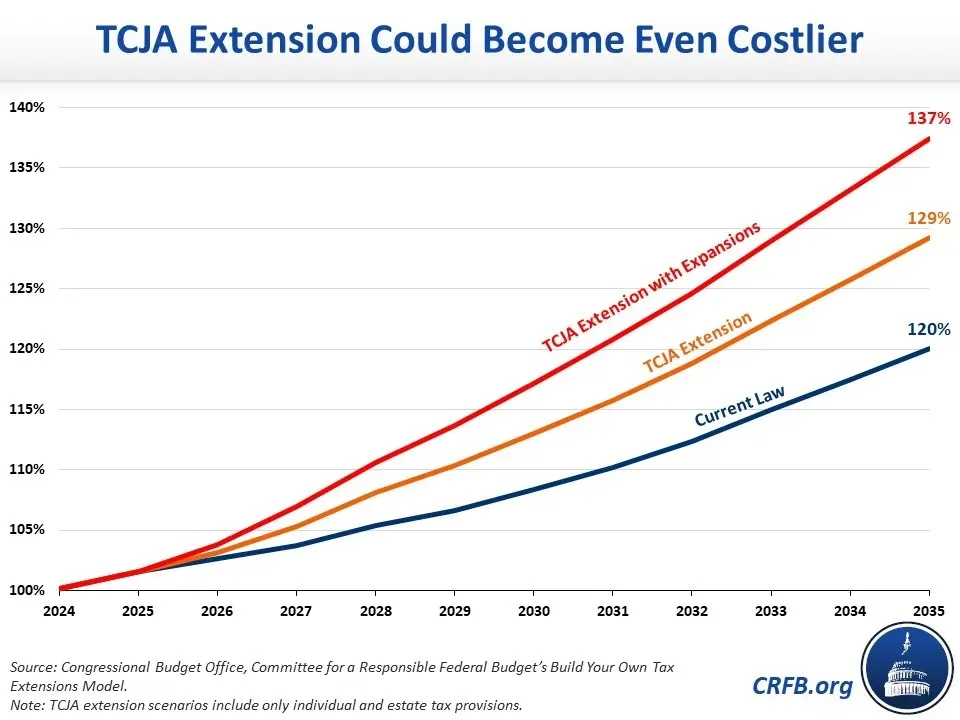
10. Tax Extensions and Expansions Can Be Costly
Large portions of the 2017 Tax Cuts and Jobs Act (TCJA) are scheduled to expire at the end of 2025. Extending these provisions without offsets would cost $3.4 trillion or even more if the extensions were combined with expansions. The CRFB Build Your Own Tax Extensions tool shows the revenue loss or gain under different policy designs covering fiscal years 2025 to 2035. Under one scenario that assumes the cost of extending the TCJA with policy expansions, the revenue loss to the government would be about $6.4 trillion through 2035 and debt as a percent of GDP would rise to 137 percent.
As we head into 2024, the Committee for a Responsible Federal Budget will continue to track fiscal policy developments including those proposed by candidates in the 2024 presidential election through US Budget Watch 2024. You can see many more blogs and charts from 2023 by visiting our blog page and also follow along with all our work next year at CRFB.org.


