CBO Releases May 2023 Baseline
The Congressional Budget Office (CBO) today released new ten-year budget projections, again confirming that the national debt is on an unsustainable path. CBO's new projections update its February baseline and find that debt will reach a record 119 percent of Gross Domestic Product (GDP) by the end of Fiscal Year (FY) 2033 and deficits will total $20.3 trillion (6.1 percent of GDP) over the next decade.
Importantly, CBO's projections are based on its February economic forecast (which was finalized in December of 2022) and other information available through March 30, and thus do not account for recent changes in inflation, economic growth, interest rates, revenue collections, or other factors.
Below, we provide a brief analysis of CBO's latest budget projections, which are relatively similar to those released in February.
Debt and Deficits
CBO projects debt will grow by $22.1 trillion over the next decade, from $24.6 trillion today to $46.7 trillion by the end of FY 2033. As a share of GDP, debt will rise from 97 percent of GDP at the end of 2022 – more than twice the historic average of 47 percent of GDP – to a record 107 percent of GDP by 2028. It will continue to grow thereafter, reaching 119 percent of GDP by the end of 2033.
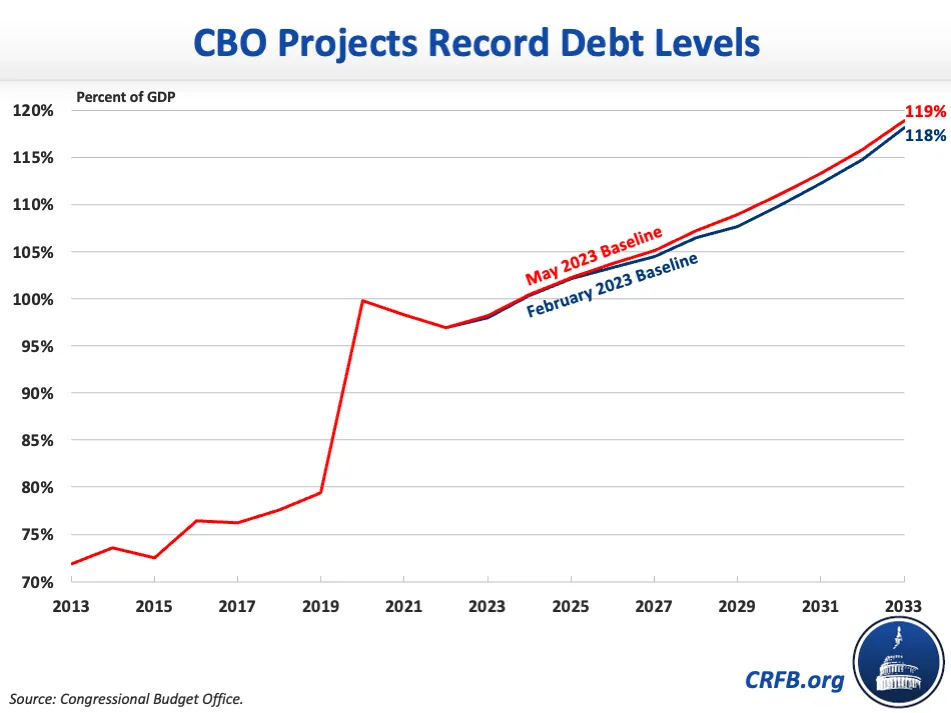
Should policymakers choose to extend policies that are scheduled to expire over the coming years – most significantly the individual income provisions in the Tax Cuts and Jobs Act (TCJA) and the Inflation Reduction Act's enhanced insurance subsidies, both of which will expire at the end of 2025 – and grow discretionary spending with the economy rather than inflation, debt could be much higher. Under such an alternative scenario, our preliminary estimates find that debt would reach a new record as a share of the economy by FY 2027 and then grow further, exceeding 130 percent of GDP by 2033.
Deficits, meanwhile, will nearly double over the next decade, growing from $1.5 trillion (5.9 percent of GDP) in FY 2023 to $2.9 trillion (7.3 percent of GDP) by 2033. Over the subsequent decade, CBO projects deficits will total $20.3 trillion (6.1 percent of GDP), or $2.0 trillion per year.
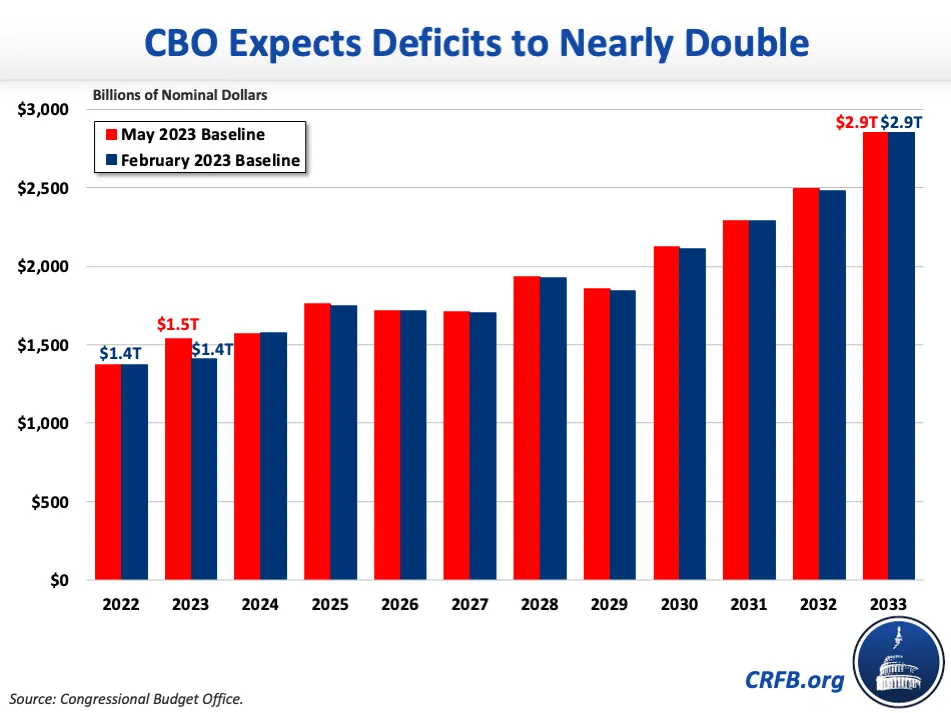
Specifically, CBO projects the deficit will total $1.5 trillion (5.9 percent of GDP) in FY 2023, though the actual deficit could fall anywhere between $1.2 trillion and $1.8 trillion depending on why April tax collections were so weak and how the Supreme Court ultimately rules on student debt cancellation. CBO projects the deficit will rise to $1.8 trillion (6.2 percent of GDP) by 2025, fall to $1.7 trillion (5.5 percent of GDP) by 2027 after elements of the TCJA expire, and then grow to $2.1 trillion (6.1 percent of GDP) by 2030 and $2.9 trillion (7.3 percent of GDP) by 2033.
Spending and Revenue
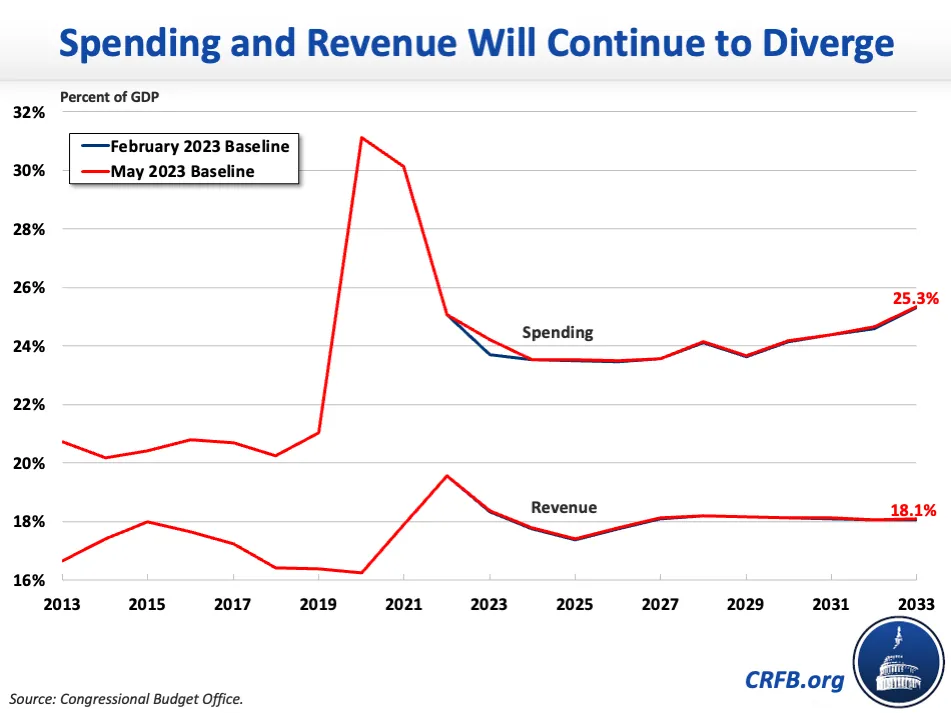
Rising debt and deficits are driven by a disconnect between spending and revenue. CBO projects federal spending will grow by $3.6 trillion (1.1 percentage points of GDP), from $6.4 trillion (24.2 percent of GDP) in FY 2023 to $10.0 trillion (25.3 percent of GDP) by 2033. CBO projects revenue will fall as a share of the economy, from 19.6 percent ($4.9 trillion) in FY 2022 to 18.4 percent ($4.8 trillion) this year and 17.4 percent ($5.0 trillion) by 2025. Importantly, CBO's projections were made before April's low tax collections, and it now appears that revenue will fall faster than CBO projects (we estimate revenue has totaled 17.7 percent of GDP over the last 12 months). Beyond 2025, revenue will rise steadily to 18.1 percent of GDP ($7.1 trillion) by the end of 2033, mostly due to the expiration of large parts of the TCJA at the end of 2025.
The projected growth in spending is driven by rising health, retirement, and interest costs. Together, spending on Social Security, the major health care programs (Medicare, Medicaid, the Children's Health Insurance Program, and the exchanges), and interest payments on the national debt will comprise 83 percent of projected spending growth in nominal dollars over the FY 2023 to 2033 budget window. CBO expects Social Security and health care spending to nearly double between FY 2023 and 2033, growing from $1.3 trillion to $2.4 trillion and from $1.5 trillion to $2.7 trillion, respectively. As a share of the economy, Social Security spending will grow by 0.9 percentage points of GDP and health care spending by 1.1 percentage points.
Meanwhile, interest costs will more than double, rising from $663 billion in FY 2023 to $1.4 trillion by 2033 and totaling a record 3.7 percent of GDP that year.
On the revenue side, individual income tax collections will grow from $2.5 trillion (9.6 percent of GDP) in FY 2023 to $2.8 trillion (9.2 percent of GDP) by 2026 – reflecting the expiration of the TCJA's individual provisions – and then grow further to $3.8 trillion (9.7 percent of GDP) by 2033. Other sources of revenue – including payroll, corporate, and excise tax collections - will increase more gradually from $2.3 trillion (8.7 percent of GDP) in 2023 to $3.3 trillion (8.4 percent of GDP) by 2033.
Changes in the Budget Outlook
CBO's budget projections show a modestly worsened fiscal outlook since its last baseline in February, though projections will likely change more dramatically when CBO incorporates an up-to-date economic forecast later this year. CBO projects deficits over the FY 2023 to 2033 budget window will total $21.9 trillion, $181 billion higher than its previous estimate of $21.7 trillion. CBO projects debt in FY 2033 will be $263 billion, or about one percentage point of GDP, higher. The increase in projected deficits is entirely attributable to technical changes.
Administrative actions, which are counted as technical changes, explain some of the difference. CBO projects new payment levels and an altered methodology for determining Medicare Advantage (MA) payments, first proposed by the Center for Medicare and Medicaid Services in February, will reduce Medicare spending by $223 billion through 2033. However, CBO's estimates do not incorporate changes made to those plans finalized in March, including a gradual phase-in, that will reduce the savings. Meanwhile, the Administration's proposed rule to create a new Income-Driven Repayment plan for federal student loan borrowers would cost $111 billion. Importantly, due to long-standing conventions for preliminary rules, CBO's IDR estimate also incorporates only 50 percent of the possible cost (once the rule of finalized, they will add the other half).
CBO's projections of Social Security and health care spending are higher due to greater-than-expected caseloads and average retirement benefits in the Social Security program, as well as greater Affordable Care Act (ACA) premium tax credits driven by higher enrollment in the marketplace and a greater percentage of premium tax credits being recorded as outlays rather than a reduction in tax liabilities. The reduction in premium tax credits recorded as a reduction in tax liabilities led CBO to increase its revenue estimates, as did updated projections of health insurance coverage, specifically penalties for employers that do not offer health insurance that meets the ACA's coverage requirements.
CBO adjusted its projections of discretionary spending down by $121 billion to better reflect the recent rate at which discretionary budget authority has been converted to budget outlays. Meanwhile, it expects higher spending on veterans due to larger-than-anticipated initial claims for new benefits authorized in last year's Honoring Our PACT Act. CBO also expects higher spending from deposit insurance and other federal credit programs.
Technical Changes from CBO's February 2023 Baseline
| Source of Change | 2023-2033 Deficit Increase/Decrease (-) |
|---|---|
| Deficits in CBO's February 2023 Baseline | $21,673 billion |
| Proposed Medicare Advantage Payment Rule (February version) | -$223 billion |
| Proposed Income-Driven Repayment Program Rule (50% Rule) | $111 billion |
| Changes in Revenue Projections | -$53 billion |
| Higher Social Security and Health Care Costs | $228 billion |
| Lower Discretionary Spending | -$121 billion |
| Higher Veterans' Program Costs | $70 billion |
| Other Primary Spending Changes | $38 billion |
| Debt Service | $70 billion |
| Other Changes in Interest Costs | $60 billion |
| Total Change in Deficits | $181 billion |
| Deficits in CBO's May 2023 Baseline | $21,854 billion |
Sources: Congressional Budget Office and Committee for a Responsible Federal Budget. Numbers may not sum due to rounding.
Importantly, CBO did not update its economic forecast from February, so its projections do not account for recent changes in inflation, economic growth, and interest rates. They also locked in other information on March 30, and so did not incorporate the effects of lower-than-expected revenue collections in April or other information from that month. And since policymakers have not enacted any legislation since CBO's February baseline, legislative changes did not impact CBO's new budget projections.
The Bottom Line
CBO's new budget projections confirm that the country remains on an unsustainable fiscal path, with deficits projected to average $2.0 trillion per year over the next decade and debt slated to exceed its prior record in just five years and reach 119 percent of GDP by FY 2033. These projections make it clear why substantial deficit reduction is needed to put the national debt on a sustainable long-term path.
Appendix
Comparing CBO's May 2023 and February 2023 Budget Projections
| Fiscal Year | 2023 | 2024 | 2025 | 2026 | 2027 | 2028 | 2029 | 2030 | 2031 | 2032 | 2033 | Ten-Year* |
|---|---|---|---|---|---|---|---|---|---|---|---|---|
| REVENUE (Percent of GDP) | ||||||||||||
| May 2023 Baseline | 18.4% | 17.8% | 17.4% | 17.8% | 18.1% | 18.2% | 18.2% | 18.1% | 18.1% | 18.1% | 18.1% | 18.0% |
| Feb. 2023 Baseline | 18.3% | 17.7% | 17.4% | 17.7% | 18.1% | 18.2% | 18.2% | 18.1% | 18.1% | 18.1% | 18.1% | 18.0% |
| SPENDING (Percent of GDP) | ||||||||||||
| May 2023 Baseline | 24.2% | 23.5% | 23.5% | 23.5% | 23.6% | 24.1% | 23.7% | 24.2% | 24.4% | 24.7% | 25.3% | 24.1% |
| Feb. 2023 Baseline | 23.7% | 23.5% | 23.5% | 23.5% | 23.6% | 24.1% | 23.6% | 24.1% | 24.4% | 24.6% | 25.3% | 24.1% |
| DEFICITS (Percent of GDP) | ||||||||||||
| May 2023 Baseline | 5.9% | 5.8% | 6.2% | 5.7% | 5.5% | 5.9% | 5.5% | 6.1% | 6.3% | 6.6% | 7.3% | 6.1% |
| Feb. 2023 Baseline | 5.4% | 5.8% | 6.1% | 5.7% | 5.5% | 5.9% | 5.5% | 6.0% | 6.3% | 6.5% | 7.3% | 6.1% |
| DEBT (Percent of GDP) | ||||||||||||
| May 2023 Baseline | 98% | 100% | 102% | 104% | 105% | 107% | 109% | 111% | 113% | 116% | 119% | N/A |
| Feb. 2023 Baseline | 98% | 100% | 102% | 103% | 105% | 107% | 108% | 110% | 112% | 115% | 118% | N/A |
| DEFICITS (In Billions of Dollars) | ||||||||||||
| May 2023 Baseline | $1,539 | $1,571 | $1,761 | $1,718 | $1,709 | $1,934 | $1,855 | $2,126 | $2,291 | $2,496 | $2,852 | $20,314 |
| Feb. 2023 Baseline | $1,410 | $1,576 | $1,752 | $1,716 | $1,706 | $1,929 | $1,847 | $2,115 | $2,291 | $2,480 | $2,851 | $20,263 |
| DEBT (In Trillions of Dollars) | ||||||||||||
| May 2023 Baseline | $25.8 | $27.4 | $29.2 | $31.1 | $32.9 | $34.9 | $36.8 | $39.0 | $41.3 | $43.9 | $46.7 | N/A |
| Feb. 2023 Baseline | $25.7 | $27.4 | $29.2 | $30.9 | $32.6 | $34.6 | $36.4 | $38.6 | $40.9 | $43.5 | $46.4 | N/A |
Source: Congressional Budget Office. *Ten-year figures reflect the 2024-2033 budget window.


