Our Top 10 Charts of 2017
The year 2017 was a busy time for budget policy as lawmakers considered major legislation dealing with health care and taxes following the inauguration of President Trump. This led to plenty of opportunities for policy analysis via tables and graphs on these bills and other developments in the budget world. Below are our top ten charts of (calendar year) 2017.
1. President Trump taking office with the highest debt since Truman.
As President Trump took office early in the year, we highlighted the "historic debt dilemma" facing him. With debt at around 77 percent of Gross Domestic Product (GDP), the President took office with the highest level of debt as a share of the economy since Harry Truman in 1945. Worse yet, debt was (and is still) expected to only increase over time, reaching 85 percent of GDP by the end of a hypothetical eight-year term. The chart below shows the high level of debt we currently carry and how it is projected to grow over the next decade.

2. Productivity growth needed to hit 3 or 4 percent growth.
The question of how fast the U.S. economy could grow has been discussed since the presidential campaign, and it was a central debate in the budget policy world this year as the Trump Administration and Congressional leaders relied on claims of significantly increased growth from their budgets and the tax bill to make their numbers add up. As we noted in a May paper, the aging of the population means that achieving sustained 3 percent (or higher) real GDP growth is much more difficult than in the past. As the graph below shows, it would take record ten-year productivity growth to just reach 3 percent growth given current labor force projections.

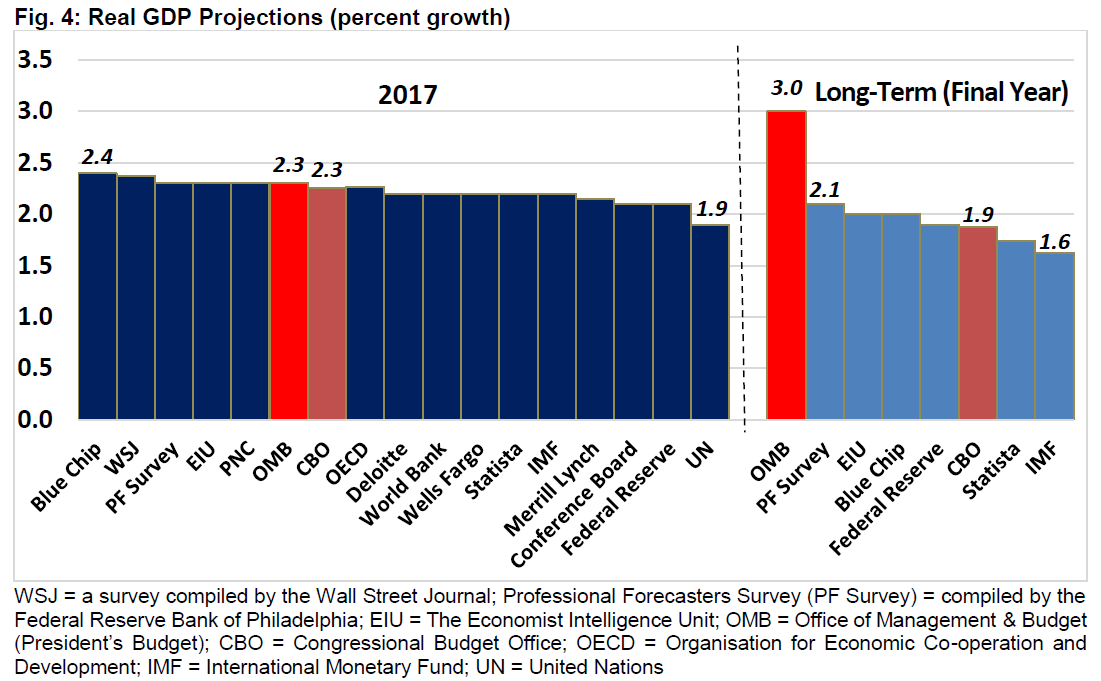
3. Comparing projections of growth.
In a similar vein, we compared how various groups estimated future economic growth. The President's Fiscal Year (FY) 2018 budget was a significant outlier for projecting long-term growth, bringing into doubt its ability to be achieved. This was done as part of our re-estimate of the President's budget with reasonable economic assumptions.
4. Re-estimating the President's budget without gimmicks.
President Trump's FY 2018 budget, which was released in May, claimed to balance the federal budget by 2027, but it relied on several gimmicks – including very rosy economic assumptions – to get there. Shortly after the budget's release, we showed that after excluding gimmicks, the budget would not balance, and debt in 2027 would be much higher than the 60 percent of GDP the budget claimed.

5. Interest is the fastest growing part of the budget.
Although the budget policy world saw a lot of new developments in 2017, certain aspects of the budget stayed the same. One of those is the fact that interest on the debt is projected to be the fastest-growing part of the budget over the next decade. Using data from the Congressional Budget Office's (CBO) January budget outlook, we showed that interest on the debt is projected to nearly triple in dollar terms over the next ten years and will grow more than twice as fast as the next fastest-growing major area of the budget.

6. Two plans to ensure Social Security solvency.
In April, we highlighted two very different plans in Congress that would make Social Security solvent. These plans from House Ways and Means Social Security Subcommittee Chairman and Ranking Member Sam Johnson (R-TX) and John Larson (D-CT), respectively, would ensure a positive and growing trust fund after 75 years. Johnson's plan would rely exclusively on benefit changes while eliminating taxes on benefits, and Larson's plan relies exclusively on revenue changes while expanding benefits in certain ways. The graph below shows how the two plans would keep the Social Security trust fund solvent compared to two other Congressional plans that would result in insolvency at some point in the next 75 years.

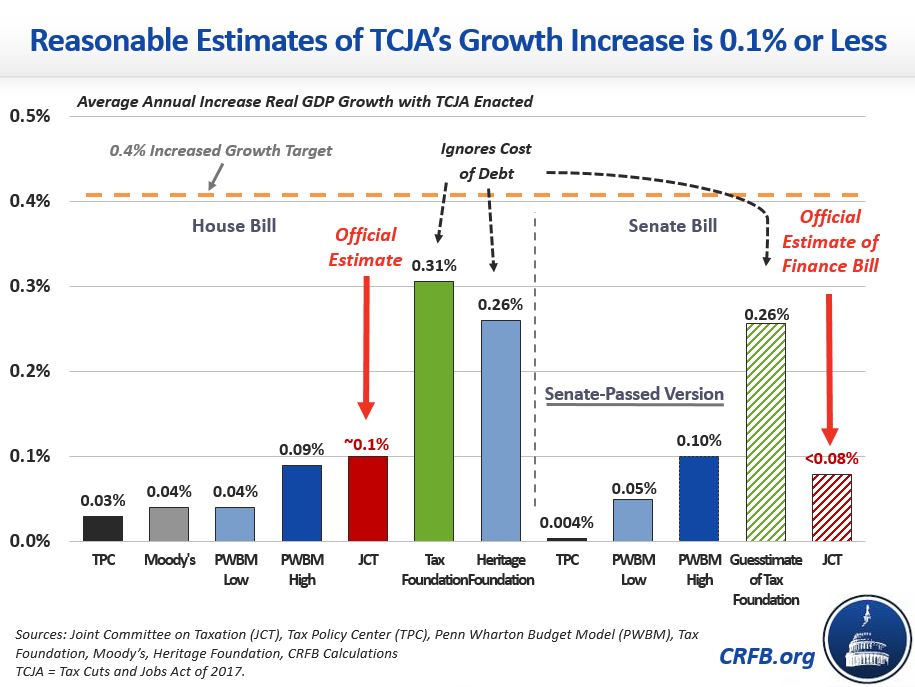
7. Dynamic estimates of the tax bill show growth not hitting its target.
Proponents of the tax bill targeted a 0.4 percent average annual increase in growth as the amount necessary to finance the initial tax cut. Ultimately, none of the organizations that analyzed the tax bill found it would produce that growth, as we show below. Notably, even a 0.4 percentage point increase in growth would not have paid for the tax bill.
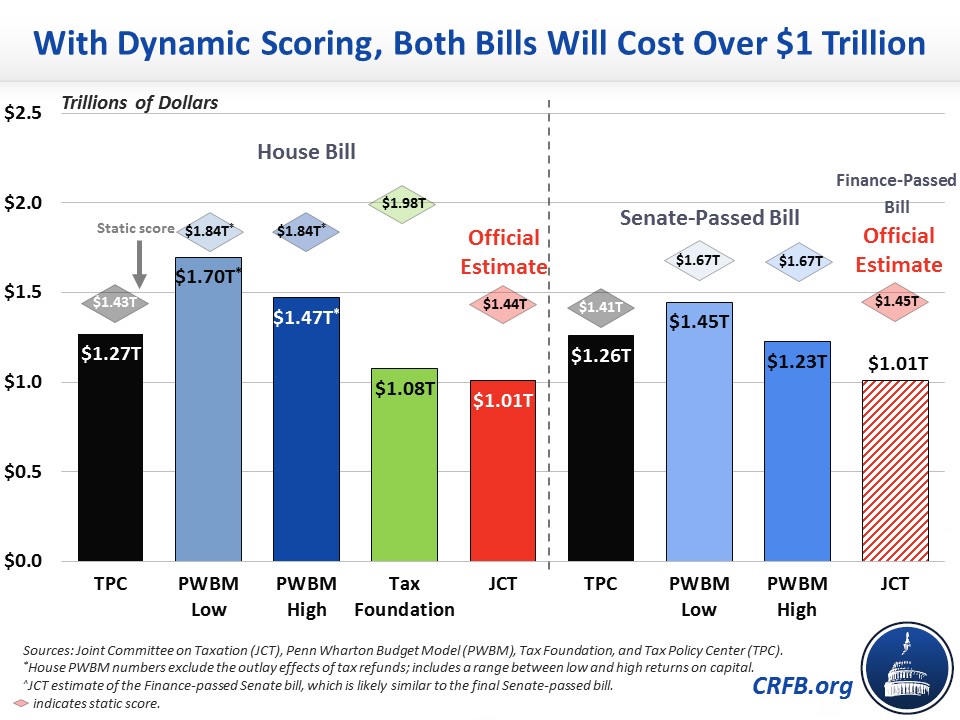
8. Dynamic estimates don't show the tax bill paying for itself.
Several budget-focused organizations, plus the only one that counts for official scoring purposes (the Joint Committee on Taxation, or JCT), weighed in on the economic effect of the tax bill and how much additional revenue it would raise. As we show in the graph below, not only did no estimate of any tax bill show it paying for itself with economic growth, but every estimate of the House and Senate tax bill showed a cost of more than $1 trillion. The dynamic estimates of the final bill have shown similar growth effects and final costs.
9. The true cost of the tax bill.
The Tax Cuts and Jobs Act recently passed by Congress was estimated to cost $1.46 trillion over ten years, and even this total excludes $725 billion of gimmicks that mask further costs. Though JCT was unable to complete an estimate of the economic effects of the final bill before passage, its estimate of the similar Senate bill showed that increased economic growth would only offset about $400 billion of this total. As we show below, this means the tax bill would increase debt by any measure above where it was already projected to go.
True Cost of Conference Bill
| Policy | Ten-Year Cost |
|---|---|
| TCJA as reported by the conference committee | $1.46 trillion |
| Sunsetting individual tax provisions after 2025 | $315 billion |
| Amortizing Research & Experimentation (R&E) expenses after 2021 | $120 billion |
| Phasing out full expensing after 2022 | $0 to 80 billion† |
| Making business interest deduction more strict after 2021 | $0 to $75 billion† |
| Making foreign tax provisions more strict after 2025 | $50 billion |
| Sunsetting more generous medical expense deduction after 2018 | $45 billion |
| Sunsetting credit for employers who offer paid leave after 2019 | $30 billion |
| Sunsetting craft beverage tax reforms | $10 billion |
| Conventional "Real" Cost | $2.0-$2.2 trillion |
| Potential Dynamic Feedback Effects | -$450 billion* |
| Dynamic "Real Cost" | $1.6-$1.7 trillion |
| True Cost with Interest | $2.4-2.5 trillion |
| True Cost with Interest and Dynamic Effects | $1.9-2.0 trillion |
Source: CRFB calculations based on Joint Committee on Taxation.
†High end of the cost assumes these late-stage tax increases are not allowed to take effect. * As a simplifying assumption, we assume the feedback in 2025 continues through 2027 and thus generates $450 billion of net feedback. Actual numbers could differ. For more detail see full footnote.
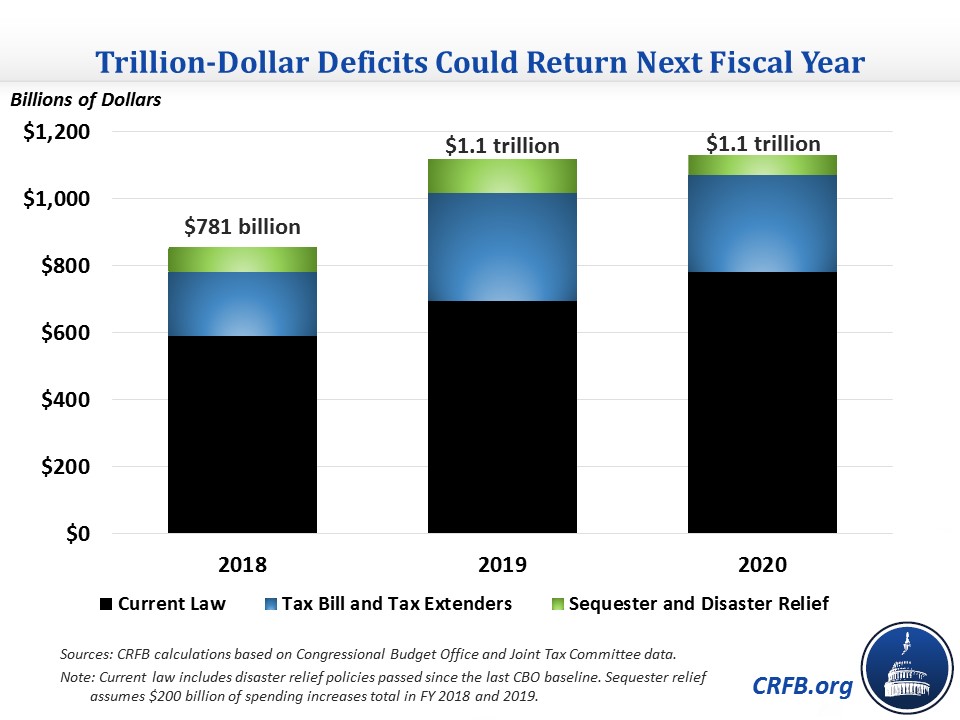
10. Trillion-dollar deficits returning soon.
Despite the current high debt, the end of the year brought a flurry of deficit-increasing legislation – most notably the tax bill – and there may be more coming from early next year. We highlighted projections that policies under consideration would cause trillion-dollar deficits to return for the first time since 2012 as soon as next fiscal year, FY 2019.