The 2021 U.S. Economy in Ten Charts
2021 was a unique year in economic history. Assisted by new COVID vaccines, accommodative monetary policy, and trillions of fiscal stimulus, the US economy continued to recover from the pandemic-driven recession. Yet, strong economic growth was accompanied by rapid price growth, leading to both declining unemployment and rising inflation.
Preliminary data from the Bureau of Economic Analysis (BEA), the Bureau of Labor and Statistics, and various other sources illustrate some key economic changes that occurred in the 2021 economy.
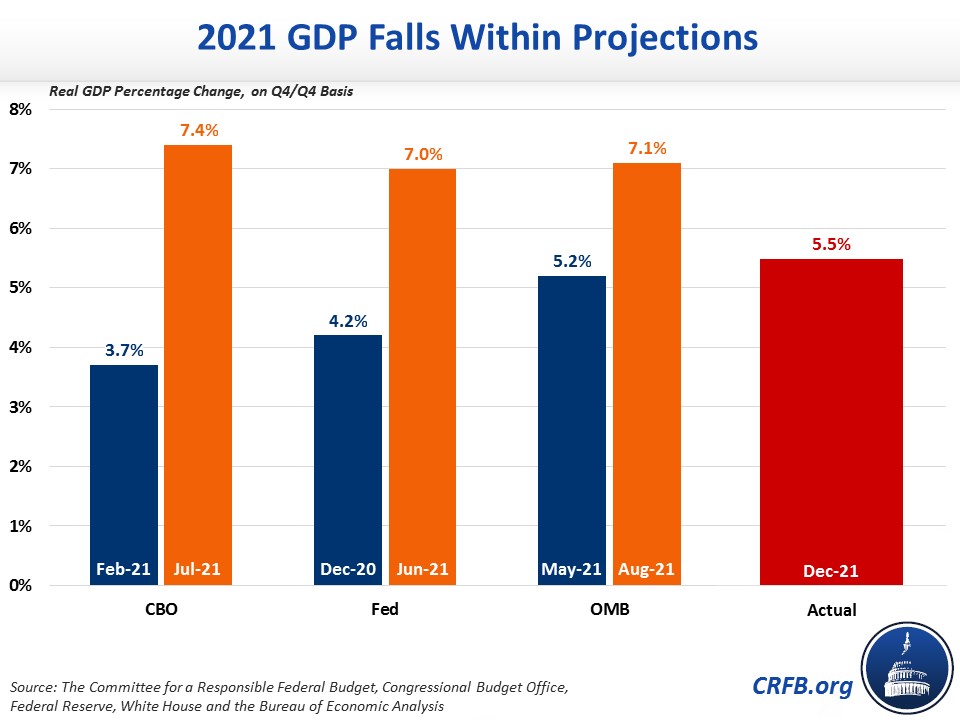
Strong Output Growth
After shrinking by a massive 9.5 percent in the second quarter of 2020, the economy has now recovered to its pre-pandemic trend. Real Gross Domestic Product (GDP) grew by 8.7 percent in the second half of 2020 and 5.5 percent in 2021. By the end of last year, real GDP was just 0.4 percent from CBO’s pre-pandemic projection.

The 5.5 percent GDP growth rate over 2021 is below recent projections by the Congressional Budget Office (CBO), Federal Reserve, and Office of Management and Budget (OMB), but higher than their projections from earlier in the year.
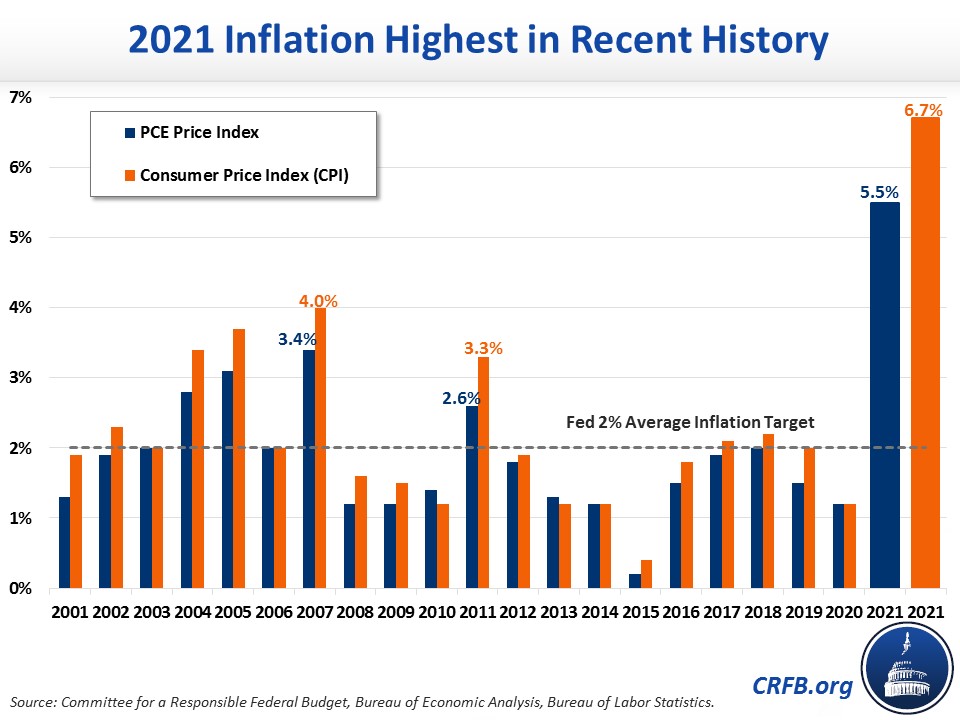
Inflation
While economic growth in 2021 was strong, so too was inflation. Normally, the Federal Reserve targets 2 percent growth in Personal Consumption Expenditures (PCE) inflation and slightly higher Consumer Price Index (CPI) inflation. In 2021, PCE inflation totaled 5.5 percent and CPI inflation totaled 6.7 percent on a fourth quarter-over-fourth quarter basis. That includes a 0.5 percent monthly increase in December alone.

Since the turn of the century, annual inflation has never topped 4 percent. In fact, PCE and CPI inflation in 2021 reached their highest point in 40 years.
Personal Income Hit a New Record
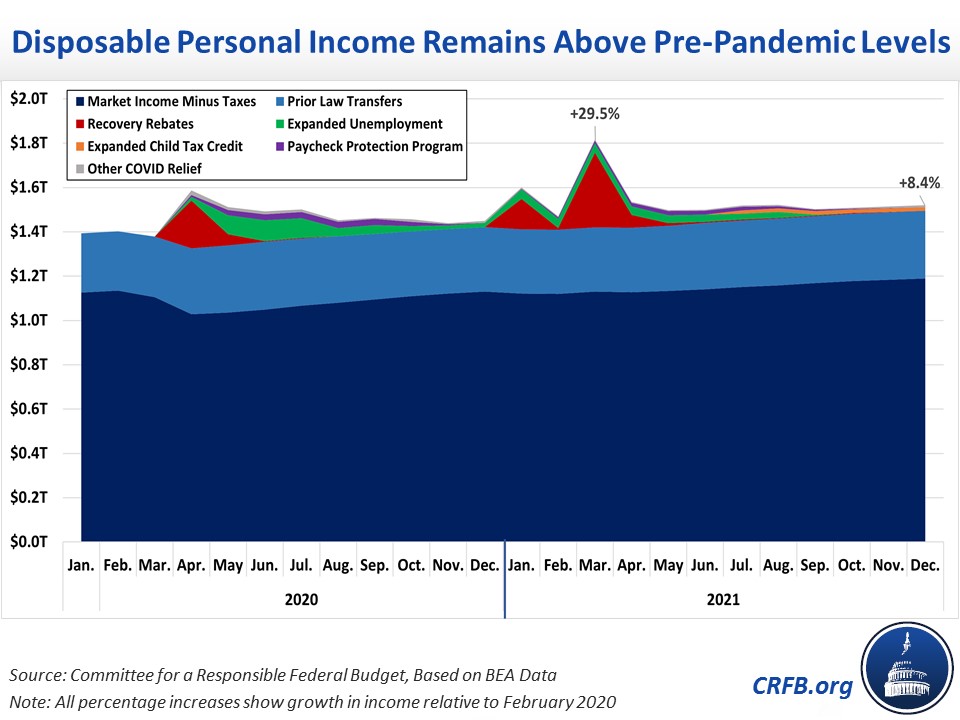
Disposable Personal Income (DPI) in 2021 totaled $18.5 trillion – 14 percent or $2.3 trillion higher than the 2019 level of $16.2 trillion. Total DPI for 2020 and 2021 was more than $4 trillion above the prior two years. The majority of this income growth was the result of COVID-relief measures such as recovery rebates and expanded unemployment benefits.
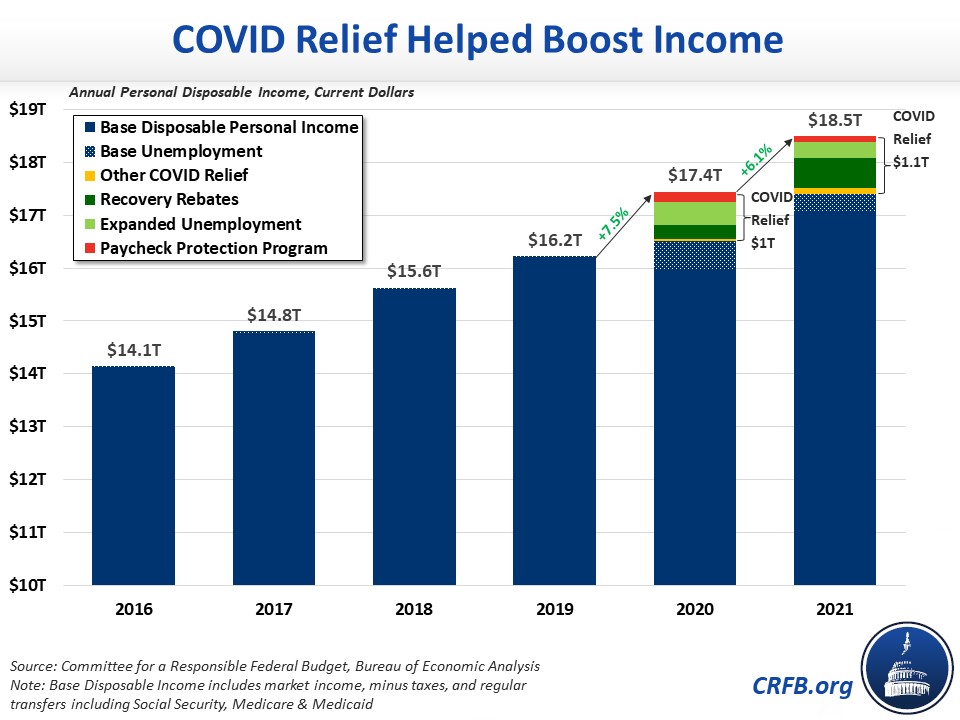
Recovery rebates, unemployment benefits, and other COVID relief responsible for this income boost mostly faded by the end of 2021. However, they were replaced by rising market income. As a result, total personal income in December remained 8.4 percent above pre-pandemic levels, which means it grew faster than either the prior trend or the elevated rate of inflation over that period.
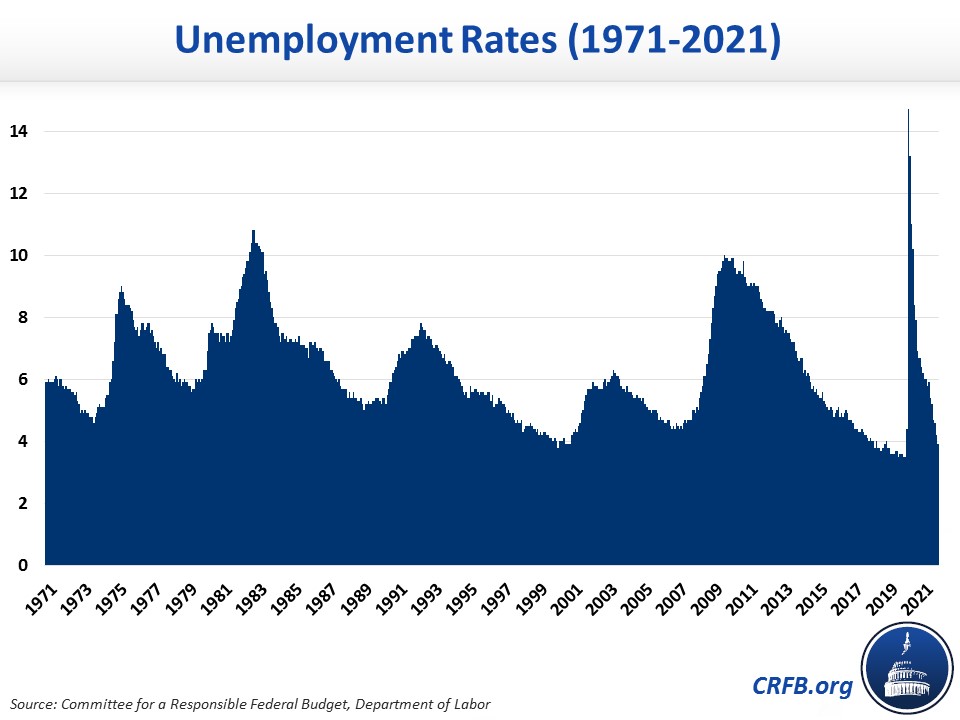
Employment Continues to Recover
In April 2020, the unemployment rate reached 14.7 percent – the highest in modern history. Since then, unemployment has come down rapidly, declining to 3.9 percent by the end of 2021, the lowest since the start of the pandemic. The unemployment rate has only been that low twice in the last 50 years - in the year 2000 and for most of the two-year period before the pandemic.
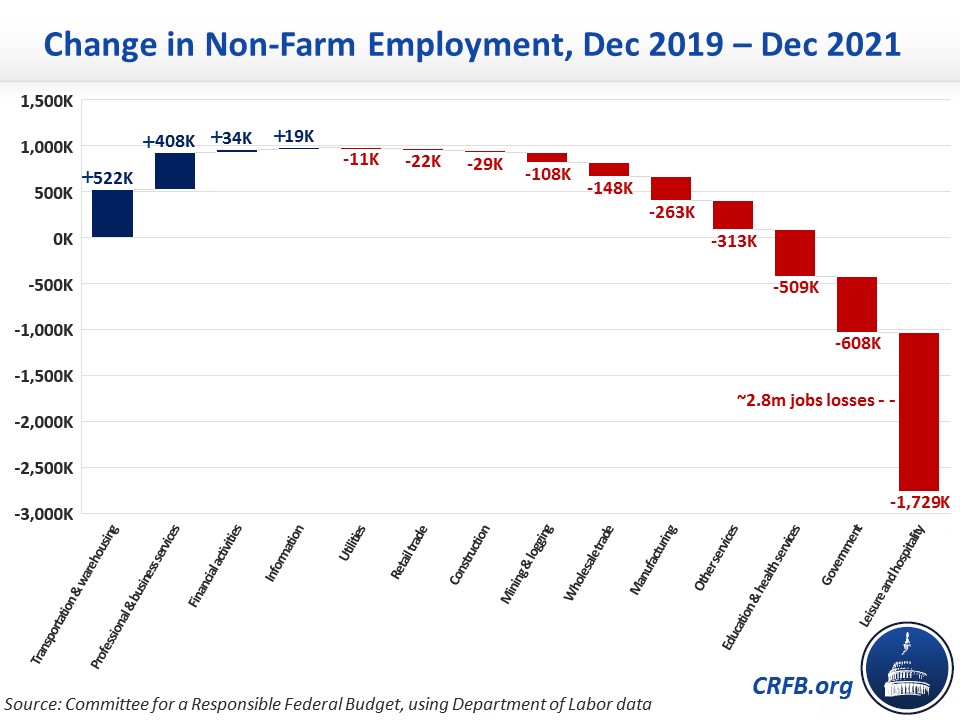
Though the unemployment rate has nearly recovered to pre-pandemic levels, overall employment still fell by around 2.8 million people between the end of 2019 and the end of 2021, driven mainly by exits from the labor force. Over 1.7 million of those reduced jobs came from the leisure and hospitality industry. Another 1.1 million came from government, education, and health services. Some industries, such as transportation and warehousing, professional and business services, financial services, and information technology have experienced job gains.
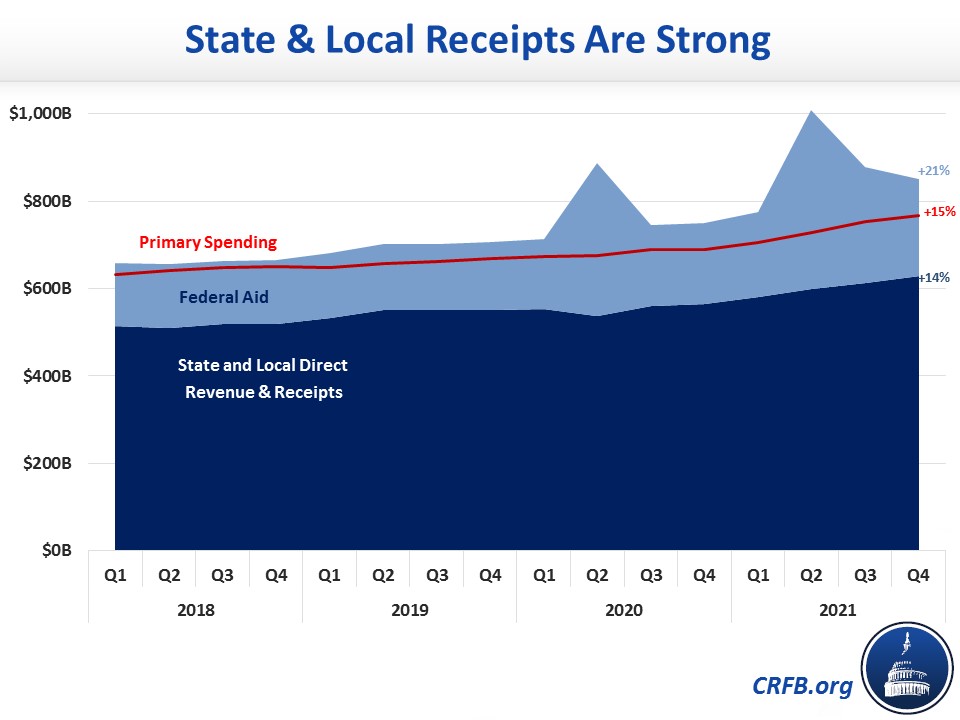
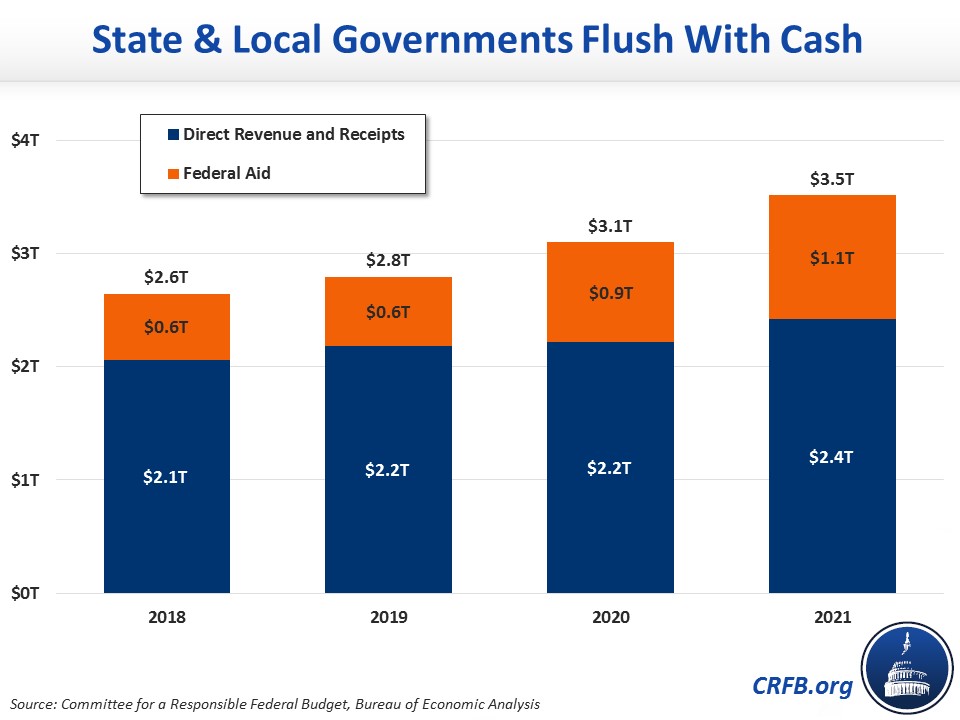
State & Local Governments are Flush With Cash
Over the course of the pandemic, policymakers authorized nearly $900 billion of aid to state and local governments. It is not clear this much aid was needed. State revenue and receipts, inclusive of federal aid, ended 2021 up 21 percent from the end of 2019. Even excluding federal aid, revenue and receipts were up 14 percent.
State and local receipts, inclusive of federal aid, totaled $3.5 trillion in 2021 and $6.6 trillion over 2020 and 2021. This represents a $1.2 trillion, or 22 percent, increase relative to the prior two years. More than $700 billion of this increase came from federal COVID relief, though states are generally doing well even without federal assistance and further aid is scheduled to be disbursed to state and local governments, mostly over the next year.
* * *
The Committee for a Responsible Federal Budget will continue to track economic developments over the course of 2022. Sign up for our mailing list to stay updated and check out COVIDMoneyTracker.org for the latest on COVID relief.
Note: Updated on 5/23/22 to correct a small error in the graph on personal disposable income