Tax Day 2017: Charts to Explain Our Tax System
To commemorate Tax Day, CRFB and our partners at Fix the Debt have released our annual chartbook on federal taxes. It outlines who pays taxes, what they pay for, and the rising cost of tax expenditures. We have highlighted several charts below, but all eight are available by viewing the chartbook.
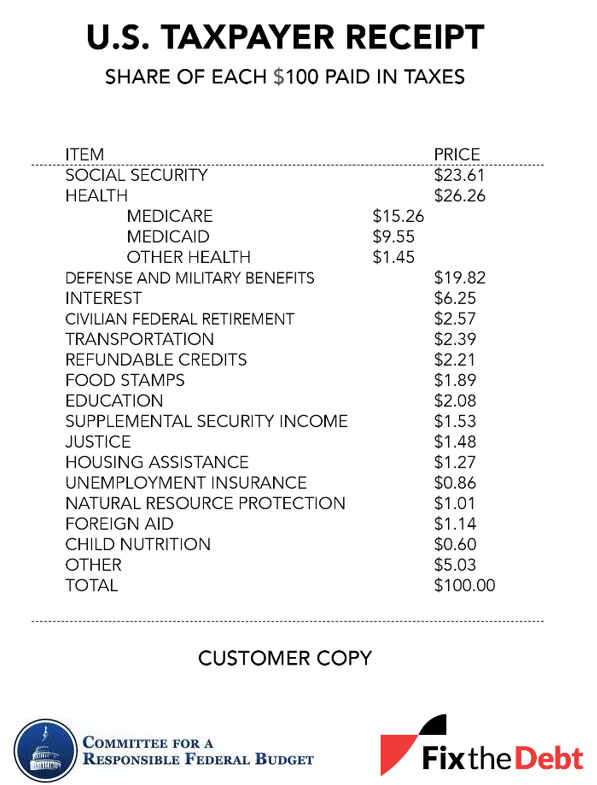
How Tax Dollars Were Spent in 2016
In 2016, nearly half of all tax dollars collected went toward Social Security and health programs like Medicare and Medicaid. For every $100 in taxes paid, more than $6 goes toward interest payments on the debt – more than spending on education, transportation, and natural resource protection combined. Functions like foreign aid and transportation comprise a relatively small share of the federal budget. Because the government spends more than it receives in revenue, taxpayers would need to pay an additional $14 for every $100 they already pay to finance the deficit and cover all federal spending.
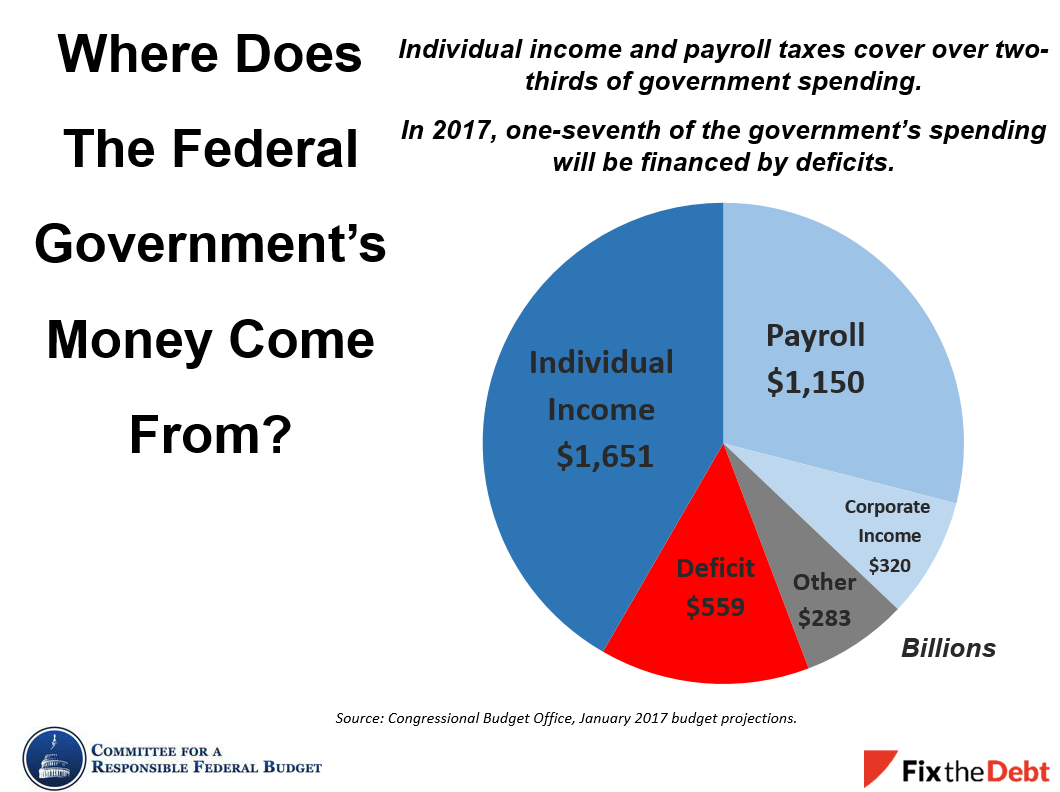
Where Does the Federal Government’s Money Come From?
Government expenditures are mostly financed by individual income taxes, payroll taxes, and borrowing. Individual income and payroll taxes cover approximately two-thirds of government spending, while about 14 percent of spending is deficit-financed. Without making changes, the government will have to rely more on borrowing in the coming years as spending is expected to outpace revenue growth.
Tax reform is being discussed by the current administration as a way to promote growth and other important goals, but it is important that reform does not add to the deficit.
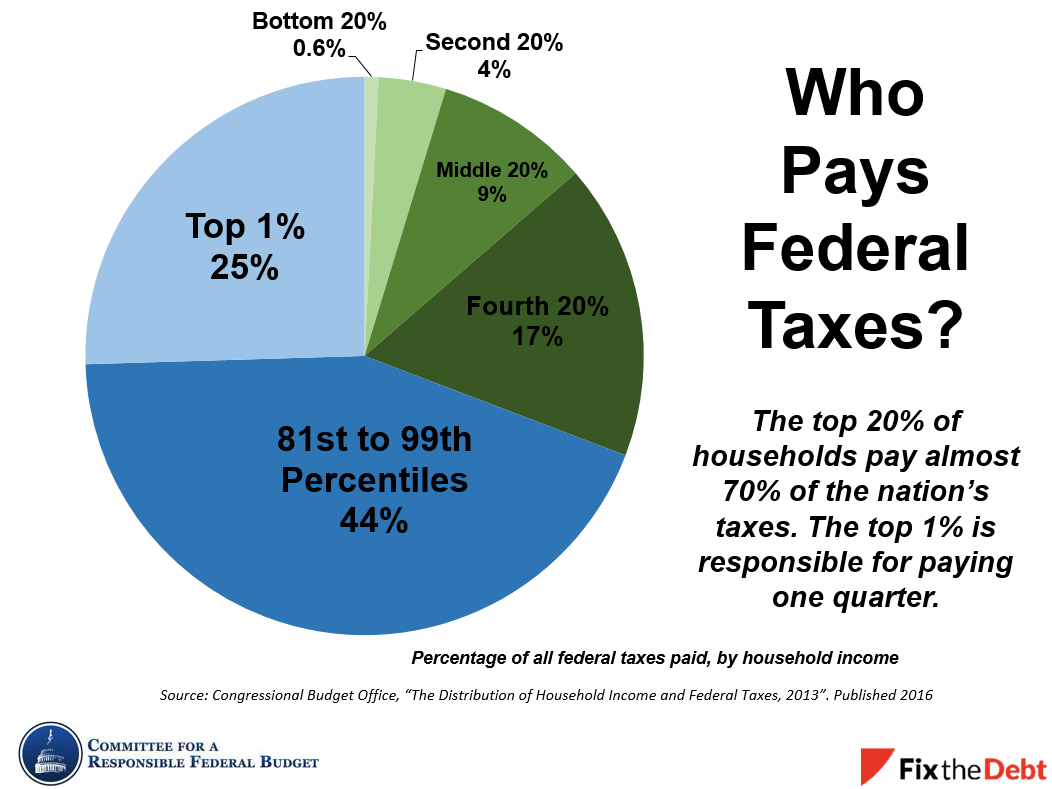
Who Pays Federal Taxes?
Due to the distribution of income and the progressive nature of the federal income tax, the top 20 percent of households pay nearly 70 percent of all federal taxes, with the top one percent of the nation’s earners paying one-quarter of taxes. In 2013, households in this top income quintile received 53 percent of all before-tax income and paid 69 percent of federal taxes, while households in the bottom quintile received five percent of before-tax income and paid less than one percent of taxes.
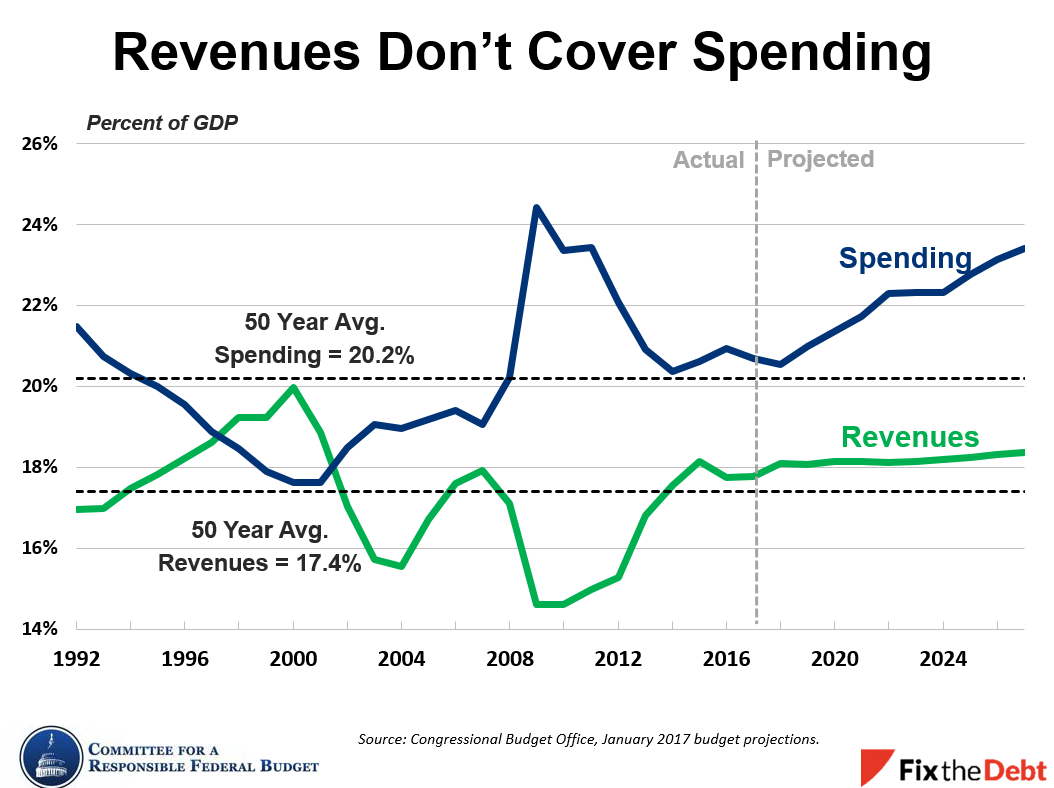
Revenues Don’t Cover Spending
Historically, revenues have averaged 17.4 percent of the economy, while spending has averaged 20.2 percent of Gross Domestic Product (GDP). Under current law, spending is projected to increase as a share of the economy from 20.7 percent in 2017 to 23.4 percent in 2027. Meanwhile, revenues will remain much flatter at around 18 percent of GDP over the next ten years, meaning the government will increasingly rely on deficit financing to make up the difference.
Tax Breaks Have Grown Over Time
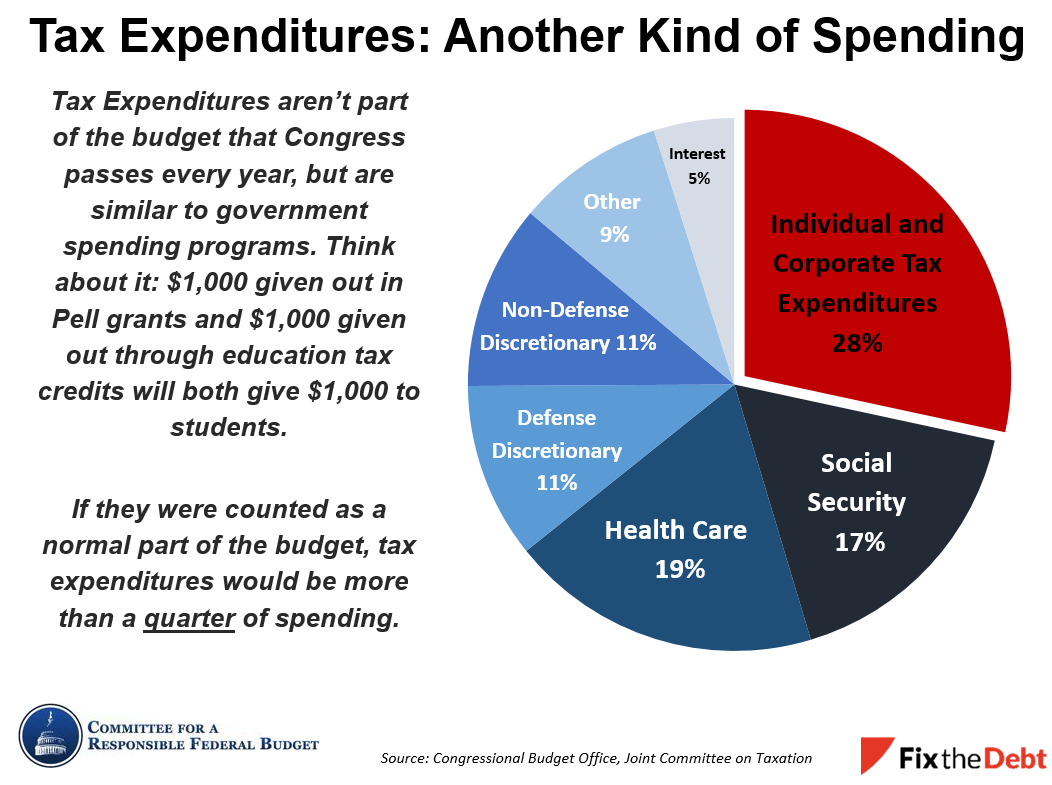
The size of "tax expenditures" – the various deductions, credits, exclusions, and other tax breaks not formally included in the federal budget – has grown over time. In real terms, tax expenditures now cost twice as much as when Congress last overhauled the tax code in 1986.

Tax expenditures are often referred to as "spending through the tax code." In 2016, tax expenditures cost the government about $1.6 trillion in forgone revenue. If both individual and corporate tax expenditures were counted as ordinary spending, they would consume over one-quarter of the federal budget.
As taxpayers, it is worth understanding our current tax code and how our taxes are spent.
Overhauling the current tax code will require tough choices and trade-offs, but reform that broadens the tax base can allow policymakers to lower tax rates, grow the economy, and reduce deficits.