What Would Social Security 2100 Mean for the Debt?
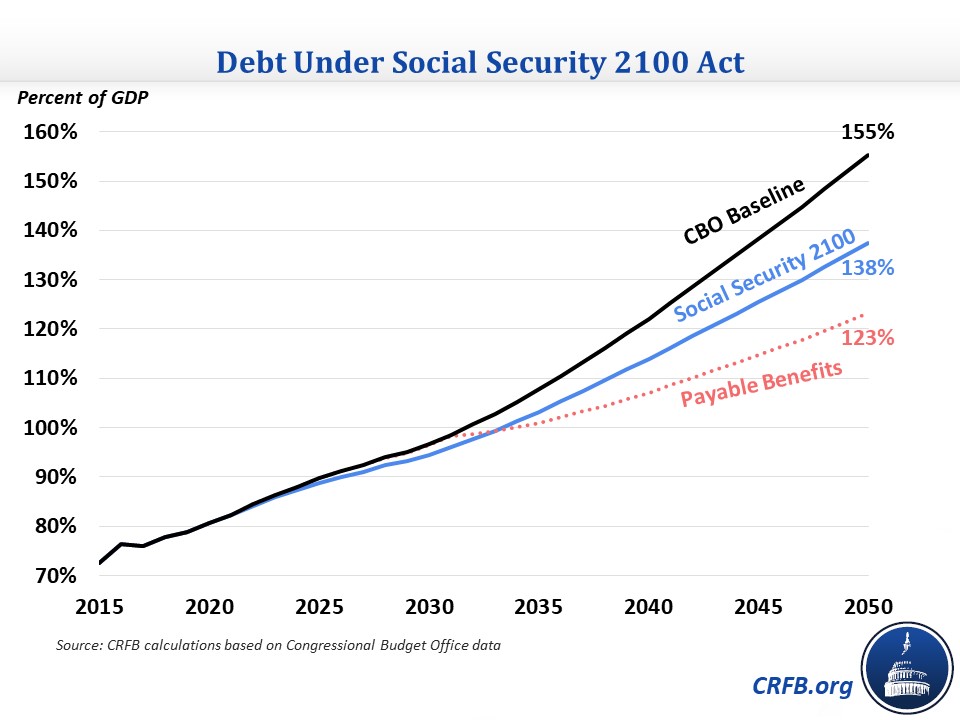
Saving Social Security from its looming trust fund insolvency would significantly improve the overall fiscal picture. Under the Congressional Budget Office's (CBO) baseline, which assumes Social Security spending continues as scheduled, debt would rise to about 155 percent of Gross Domestic Product (GDP) by 2050. We estimate projected debt would fall to 123 percent of GDP by 2050 if Social Security spending was limited to revenue upon trust fund depletion (the "payable-benefits scenario"). Based on a new CBO score, we estimate the Social Security 2100 Act (SS2100), which would nearly ensure solvency (by CBO's estimate) by raising payroll taxes, would reduce projected debt to about 138 percent of GDP by 2050; under a dynamic score, debt would be somewhat higher.
The Effect of Social Security 2100 on the National Debt
CBO estimates that SS2100 would eliminate over 90 percent of Social Security's 75-year shortfall (Social Security's chief actuary estimates it will close over 110 percent of the shortfall) and push back the trust fund insolvency date from 2032 to 2041. This is projected to result in significant reductions in unified budget deficits and debt held by the public. On the other hand, as we explain in detail below, SS2100 would significantly increases non-Social Security deficits, offsetting about two-fifths of the fiscal improvements from stronger solvency. We estimate SS2100 would reduce debt-to-GDP by 18 percentage points relative to projected levels, from 155 percent under CBO's baseline to 138 percent.
While SS2100 would reduce projected debt compared to current law, the reduction would be less than if lawmakers allowed the payable-benefits scenario to take place; debt under the payable-benefits scenario would be 123 percent of GDP in 2050, 32 percent of GDP lower than the baseline and 15 percent lower than under SS2100. The difference between payable benefits and SS2100 is due to a combination of non-Social Security revenue losses and the fact that CBO finds SS2100 would fall slightly short of achieving solvency.
Incorporating the effects of economic growth, the difference between these two scenarios would be greater. CBO estimates that the payable-benefits scenario would increase GDP by 1.7 percent in 2049 (mainly by reducing debt), which would further reduce to debt to roughly 110 to 115 percent of GDP. While CBO hasn't provided a dynamic estimate of SS2100, the Penn Wharton Budget Model recently estimated it would reduce GDP by 2.7 percent in 2049. If CBO agrees, that could mean debt at about 145 to 150 percent of GDP, a modest improvement to CBO's baseline.
These figures highlight the importance of having a pro-growth Social Security reform plan. A plan recently released by Marc Goldwein, Maya MacGuineas, and Chris Towner of the Committee for a Responsible Federal Budget would increase GNP by 3.5 to 13 percent in 2050 and reduce debt by 25 to 45 percent of GDP, according to the authors' estimates.
Sources of Savings and Costs in Social Security 2100
By raising the payroll tax rate and applying the payroll tax to income above $400,000 (it is currently only applied to the first $133,000), SS2100 would significantly reduce unified budget deficits. However, a sizeable portion of the gains in Social Security revenue would be lost to the rest of the budget.
Over the first decade of enactment, CBO estimates SS2100 would reduce Social Security deficits by over $1.2 trillion while increasing non-Social Security deficits by over $719 billion, saving $525 billion on net. Using CBO's numbers as a starting point, we estimate SS2100 would reduce debt-to-GDP by 31 percent in 2050 from the Social Security effects, but increase it by 13 percent of GDP from the non-Social Security effects, leading to a net reduction of 18 percent of GDP.
In other words, SS2100 would significantly reduce projected debt, but over two-fifths of the Social Security savings would be lost to the rest of the budget.
The non-Social Security debt increases from SS2100 stem primarily from two sources.
First, higher payroll taxes on the employer side would reduce taxable wages – as employers pay more compensation in the form of payroll taxes and less in the form of wages – which in turn would reduce income tax (and Medicare payroll tax) revenue. In the first decade, CBO and the Joint Committee on Taxation estimate about one-fifth of the Social Security revenue increase from raising the payroll tax rate and eliminating the taxable maximum for Social Security would be lost to other parts of the budget.
Second, SS2100 would reduce the amount of Social Security benefits subject to the income tax, reducing revenue that is currently used to fund Social Security and Medicare. As written (under CBO's interpretation), the legislation would essentially credit all remaining benefit taxation revenue to the Social Security trust fund, in contrast to now where it is split between the Social Security and Medicare trust funds, and make up for the lost Medicare trust fund revenue with general revenue. The result is a $432 billion revenue loss over the next decade, with the vast majority coming from outside of Social Security. Importantly, the Social Security Chief Actuary interprets the plan differently and believes the lost revenue would come from the Social Security trust fund. This interpretation would result in the same net fiscal impact, but with more significant losses on the Social Security side.
Budgetary Effects of Social Security 2100 Act
| Policy | Ten-Year Savings/Cost (-) | 2050 Debt Effect (Percent of GDP)+ |
|---|---|---|
| Phase in elimination of payroll tax cap (Social Security effect) | $1,120 billion | 14% |
| Gradually increase payroll tax rate by 2.4 percentage points (Social Security effect) | $531 billion | 13% |
| Payroll tax interactions with other revenue | -$316 billion | -5% |
| Reduce taxation of Social Security benefits (Social Security effect) | -$29 billion | 1% |
| Reduce taxation of Social Security benefits (non-Social Security effect) | -$403 billion | -4% |
| Use CPI-E for Cost-Of-Living Adjustments (COLAs) | -$134 billion | -3% |
| Increase bottom factor in benefit formula | -$219 billion | -2% |
| Increase minimum benefit | -$42 billion | -1% |
| Benefit interactions | $13 billion | <0.5% |
| Interest savings | $58 billion | 5% |
| Total | $583 billion | 18% |
| Total Social Security Effect | $1,243 billion* | 31% |
| Total Non-Social Security Effect | -$719 billion* | -13% |
Sources: Congressional Budget Office, Joint Committee on Taxation, and CRFB calculations.
+CRFB rough estimates based in 2029 and 2049 estimates from CBO and JCT.
*Total excludes interest.
Overall, SS2100 would improve the fiscal outlook relative to current projections, though not by as much as other solvency plans might be able to. Still, the proposal puts forward a responsible solution to improve retirement security, prevent a 20 to 25 percent across-the-board benefit cut in the 2030s, and substantially reduce projected debt levels. Lawmakers and critics who don't like elements of SS2100 should put forward their own alternatives. Time is running out to enact thoughtful reforms to save Social Security.