An Overview of the President's FY 2023 Budget
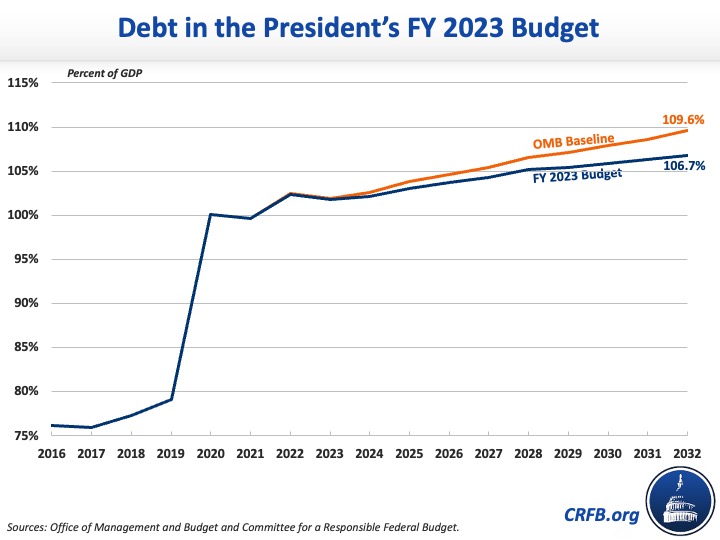
Moments ago, the Biden Administration unveiled its Fiscal Year (FY) 2023 budget proposal, outlining some of the President’s tax and spending priorities over the next decade. Under the President’s budget, debt would decline relative to current law but grow over time and reach a new record as a share of the economy. Specifically, it would rise from 102 percent of Gross Domestic Product (GDP) at the end of FY 2022 to a record 107 percent of GDP by the end of 2032, compared to 110 percent under the Office of Management and Budget's (OMB) baseline.
While much of the President's agenda is reflected in an unspecified placeholder for a final reconciliation deal based on the House-passed Build Back Better Act, the specific policies in the budget reduce deficits by over $1 trillion over the next decade. This includes roughly $1.4 trillion of new spending that's more than offset by nearly $2.5 trillion of revenue increases and $95 billion of interest savings.
Policy Proposals in the President's FY 2023 Budget
| Policy | 2023-2032 |
|---|---|
| Deficits Projected in OMB's Baseline | $15,466 billion |
| Invest in K-12 education and college affordability | $383 billion |
| Invest in public health | $365 billion |
| Increase affordable housing supply | $48 billion |
| Combat and prevent crime | $28 billion |
| Build Back Better agenda | assumed budget neutral |
| Impose minimum tax on unrealized gains | -$361 billion |
| Other investments and reforms | -$1,413 billion |
| Subtotal, Proposals in the FY 2023 Budget | -$950 billion |
| Interest | -$95 billion |
| Total, Proposals in FY 2023 Budget | -$1,045 billion |
| Deficits Projected in FY 2023 Budget | $14,421 billion |
Sources: Office of Management and Budget.
The Committee for a Responsible Federal Budget recently reacted to the President’s budget, and will publish our full analysis of the budget later today. The below analysis provides a brief overview of the President’s budget and its contents. Stay tuned to our website and our Twitter and Facebook pages throughout the day and in the coming weeks as we dive deeper into all parts of the President’s budget.
What Would the President's Budget Mean for Spending, Revenue, Deficits, and Debt?
Annual deficits would fall from their record-high levels under the President's budget, as COVID relief ends, but would remain high by historical standards. After totaling $2.8 trillion (12.4 percent of GDP) in FY 2021, the budget estimates the deficit would decline to $1.4 trillion (5.8 percent of GDP) in FY 2022, fall to a low of $1.2 trillion (4.5 percent of GDP) in FY 2023, and then rise to $1.8 trillion (4.8 percent of GDP) by FY 2032. Deficits over the next decade would total $14.4 trillion (4.7 percent of GDP) under the budget, which is $1.0 trillion (0.3 percent of GDP) lower than under OMB's baseline. Importantly, these figures assume the Build Back Better agenda is budget neutral in every year.
As a result of ongoing deficits, debt would grow under the budget by $15.7 trillion, from $23.8 trillion today to $39.5 trillion by the end of FY 2032. Debt as a share of the economy would also grow, from 102.4 percent of GDP at the end of FY 2022 to a record-high 106.7 percent of GDP in FY 2032.
Both spending and revenue would grow under the budget, both over time and relative to OMB's baseline. Spending over the FY 2023-2032 budget window would average 23.4 percent of GDP and total 23.9 percent of GDP in FY 2032. For comparison, ten-year spending would average 22.7 percent of GDP and spending would total 23.6 percent of GDP in FY 2032 under OMB’s baseline. Revenue, meanwhile, would average 18.8 percent of GDP over the next decade and total 19.1 percent of GDP in FY 2032. Under OMB's baseline, revenue would average 17.8 percent of GDP and total 18.2 percent of GDP in FY 2032. Importantly, these figures understate total revenue and spending under the President's agenda, since the Build Back Better agenda would increase both.
Key Numbers in the President's FY 2023 Budget
| 2021 | 2022 | 2023 | 2024 | 2025 | 2026 | 2027 | 2028 | 2029 | 2030 | 2031 | 2032 | Ten-Year* | |
|---|---|---|---|---|---|---|---|---|---|---|---|---|---|
| Revenues | |||||||||||||
| % of GDP | 18.1% | 18.3% | 18.1% | 18.3% | 18.3% | 18.7% | 18.9% | 19.1% | 19.1% | 19.1% | 19.1% | 19.1% | 18.8% |
| Outlays | |||||||||||||
| % of GDP | 30.5% | 24.1% | 22.7% | 22.8% | 23.1% | 23.3% | 23.4% | 24.0% | 23.5% | 23.9% | 23.9% | 23.9% | 23.4% |
| Deficit | |||||||||||||
| Billions | $2,775 | $1,415 | $1,154 | $1,201 | $1,330 | $1,328 | $1,352 | $1,533 | $1,443 | $1,614 | $1,682 | $1,784 | $14,421 |
| % of GDP | 12.4% | 5.8% | 4.5% | 4.5% | 4.8% | 4.6% | 4.5% | 4.9% | 4.4% | 4.7% | 4.7% | 4.8% | 4.7% |
| Debt Held by the Public | |||||||||||||
| Trillions | $22.3 | $24.8 | $26.0 | $27.3 | $28.6 | $30.0 | $31.4 | $32.9 | $34.4 | $36.0 | $37.7 | $39.5 | N/A |
| % of GDP | 99.7% | 102.4% | 101.8% | 102.2% | 103.1% | 103.7% | 104.3% | 105.2% | 105.4% | 105.9% | 106.3% | 106.7% | N/A |
Source: Office of Management and Budget. *Ten-year figures reflect the 2023-2032 budget window.
The budget also includes new economic forecasts – though they were “locked” in October of last year, and therefore are somewhat out of date. Under the budget, OMB forecasts 2.9 percent Consumer Price Index (CPI) inflation in calendar year 2022 and 2.3 percent inflation thereafter. OMB estimates real GDP growth of 3.8 percent in 2022 and 2.5 percent in 2023, slowing to 2.0 percent in 2025, and then gradually rising to 2.3 percent in 2030 and beyond. Meanwhile, the unemployment rate will fall from 3.9 percent in 2022 to 3.6 percent in 2023, before rising to 3.7 percent in 2024 and 3.8 percent in 2025 and beyond. Finally, interest rates under the budget will rise modestly, with the 10-year treasury rate growing from 2.1 percent in 2022 to 2.5 percent in 2023, 3.0 percent by 2026, and 3.3 percent by 2032.
*****
The Committee for a Responsible Federal Budget has put out a press release and will publish a more detailed analysis of the President’s FY 2023 budget later today and over the course of the next several weeks. Our analyses of past budget proposals can be found here.
Note: This analysis has been updated to correct several calendar year figures that were originally described as fiscal year figures.
What's Next
-

-
-
Image