An Overview of the President’s FY 2022 Budget
Moments ago, President Joe Biden unveiled his Fiscal Year (FY) 2022 budget proposal, outlining his tax and spending proposals and their effects on the federal budget over the next decade. The budget proposes roughly $5 trillion of new initiatives, partially offset by almost $3.6 trillion of tax increases and $214 billion of spending reductions. With $163 billion of new interest costs, the budget would add $1.4 trillion to the debt by 2031. Under the budget, the Office of Management and Budget (OMB) projects debt would rise from 100 percent of Gross Domestic Product (GDP) at the end of Fiscal Year (FY) 2020 and a record 110 percent of GDP by the end of 2021 to 117 percent of GDP by the end of FY 2031.
The Committee for a Responsible Federal Budget recently reacted to the President's budget, and later today we will publish our full analysis of the President’s budget. This blog provides a brief overview of the budget and its contents. Stay tuned to our website throughout the day and in the coming weeks as we dive deeper into all aspects of the budget.
What's In the President's FY 2022 Budget?
President Biden’s FY 2022 budget would substantially increase both spending and revenue, boosting budget deficits by $1.4 trillion (0.5 percent of GDP) over the next decade, on top of the $13.2 trillion of borrowing slated to occur under current law. Because new spending in the budget is heavily frontloaded, the proposal would reduce deficits beginning in 2030 and would fully offset new spending by 2038.
The budget includes nearly $5 trillion of spending and tax breaks, reflecting new and expanded initiatives proposed in the American Jobs Plan and American Families Plan as well as a large expansion of nondefense discretionary spending. Nearly $3.6 trillion of new revenues would come from corporate tax hikes, increased taxes on high-income households, improved tax compliance, and higher taxes on fossil fuels – partially offset by expanded tax credits for businesses and households. In addition, $214 billion of spending reductions would come from limiting the growth of defense discretionary spending and a strengthening of program integrity. The budget would also increase federal interest payments by $163 billion.
Policy Proposals in the President's FY 2022 Budget
| Policy | 2022-2026 | 2022-2031 |
|---|---|---|
| Deficits Projected in OMB's Baseline | $6,226 billion | $13,176 billion |
| Enact the American Jobs Plan (Spending and Tax Breaks) | $1,629 billion | $2,624 billion |
| Enact the American Families Plan (Spending and Tax Breaks) | $884 billion | $1,743 billion |
| Increase Nondefense Discretionary (NDD) Spending | $264 billion | $600 billion |
| Subtotal, New Spending and Tax Breaks | $2,777 billion | $4,967 billion |
| Raise corporate income taxes (American Jobs Plan) | -$919 billion | -$1,949 billion |
| Raise income taxes on high-income households (American Families Plan) | -$376 billion | -$755 billion |
| Improve tax compliance (American Families Plan) | -$193 billion | -$711 billion |
| Increase fossil fuel-related taxes (American Jobs Plan and FY 2022 Budget) | -$65 billion | -$147 billion |
| Limit the growth of defense discretionary spending | -$14 billion | -$169 billion |
| Strengthen program integrity | -$12 billion | -$45 billion |
| Subtotal, Tax Increases and Spending Reductions | -$1,578 billion | -$3,775 billion |
| Interest | $27 billion | $163 billion |
| Total, Proposals in FY 2022 Budget | $1,226 billion | $1,355 billion |
| Deficits Projected in FY 2022 Budget | $7,452 billion | $14,531 billion |
Sources: Office of Management and Budget and Committee for a Responsible Federal Budget staff calculations. Numbers may not sum due to rounding.
What Would the Budget Mean for Spending, Revenue, Deficits, and Debt?
Under the President’s budget, the budget deficit would fall from $3.7 trillion (16.7 percent of GDP) in FY 2021 to $1.8 trillion (7.8 percent of GDP) in 2022. The deficit would fall further to $1.4 trillion (5.6 percent of GDP) in FY 2023. From there, the deficit would increase to $1.5 trillion (5.5 percent of GDP) in FY 2025, fall back to between $1.3 trillion and $1.4 trillion through FY 2029, and then rise to $1.6 trillion (4.7 percent of GDP) by 2031.
Deficits over the next decade would be $1.4 trillion (0.5 percent of GDP) higher than OMB's baseline estimate of $13.2 trillion (4.7 percent of GDP). In FY 2031, the deficit would be $92 billion (0.3 percent of GDP) lower than OMB’s baseline projection of $1.7 trillion (5.0 percent of GDP).
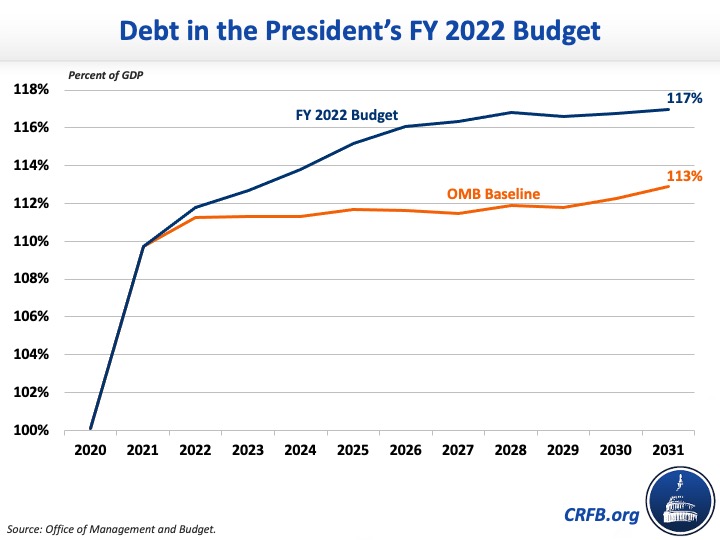
As a result of these deficits, debt under the President’s budget would grow substantially. Federal debt held by the public would rise from over 100 percent of GDP at the end of FY 2020 and 110 percent of GDP in 2021 – surpassing the prior record of 106 percent of GDP set just after World War II – to 117 percent of GDP by the end of FY 2031. Debt in 2031 would be roughly 4 percent of GDP higher than the 113 percent of GDP estimated under OMB’s baseline.
As a share of GDP, the budget would increase both spending and revenue. Spending over the 2022-2031 budget window would be 24.5 percent of GDP and total 24.6 percent of GDP in FY 2031. For comparison, ten-year spending would be 22.7 percent of GDP and spending would total 23.6 percent of GDP in FY 2031 under OMB’s baseline. Revenue, meanwhile, would total 19.3 percent of GDP over the next decade and 19.9 percent of GDP in FY 2031. Under OMB's baseline, ten-year revenue would total 18.0 percent of GDP and revenue would total 18.6 percent of GDP in FY 2031.
Key Numbers in the President's Budget
| 2020 | 2021 | 2022 | 2023 | 2024 | 2025 | 2026 | 2027 | 2028 | 2029 | 2030 | 2031 | Ten-Year* | |
|---|---|---|---|---|---|---|---|---|---|---|---|---|---|
| Revenues | |||||||||||||
| % of GDP | 16.3% | 16.3% | 17.8% | 18.9% | 18.9% | 19.0% | 19.4% | 19.7% | 19.8% | 19.8% | 19.8% | 19.9% | 19.3% |
| Outlays | |||||||||||||
| % of GDP | 31.2% | 32.9% | 25.6% | 24.5% | 24.2% | 24.5% | 24.5% | 24.3% | 24.6% | 24.1% | 24.4% | 24.6% | 24.5% |
| Deficit | |||||||||||||
| $ (billions) | $3,129 | $3,669 | $1,837 | $1,372 | $1,359 | $1,470 | $1,414 | $1,303 | $1,424 | $1,307 | $1,477 | $1,568 | $14,531 |
| % of GDP | 14.9% | 16.7% | 7.8% | 5.6% | 5.3% | 5.5% | 5.1% | 4.6% | 4.8% | 4.2% | 4.6% | 4.7% | 5.2% |
| Debt Held by the Public | |||||||||||||
| $ (trillions) | $21.0 | $24.2 | $26.3 | $27.7 | $29.1 | $30.5 | $32.0 | $33.3 | $34.7 | $36.0 | $37.5 | $39.1 | N/A |
| % of GDP | 100.1% | 109.7% | 111.8% | 112.7% | 113.8% | 115.2% | 116.1% | 116.4% | 116.8% | 116.6% | 116.8% | 117.0% | N/A |
Source: Office of Management and Budget. *Ten-year figures reflect the 2022-2031 budget window.
*****
The Committee for a Responsible Federal Budget has put out a press release and will publish a more detailed analysis of the President’s FY 2022 budget later today and over the course of the next several weeks. Our analyses of past budget proposals can be found here.


