How Much Could Build Back Better Add to the Debt?
Note: This analysis was updated for new data and details on August 11, 2021. See the updated analysis here.
While we do not have all the estimates for the bipartisan Infrastructure Investment and Jobs Act and details of the forthcoming reconciliation budget plan (collectively known as “Build Back Better”), current information about the packages suggest they are likely to set the stage for substantial new borrowing unless policymakers insist on more offsets, less spending and tax breaks, or some combination.
Though policymakers claim that both plans are paid for, we believe they will, in reality, require nearly $1 trillion of direct borrowing and set the stage for roughly $2.9 trillion of total borrowing over the next decade. This cost would lift debt to 115 percent of Gross Domestic Product (GDP) (as opposed to 106 percent) by 2031. If lawmakers also extend the 2017 tax cuts (and other expiring provisions) and grow discretionary spending with the economy, debt could reach 125 percent of GDP in 2031. In that scenario, deficits could rise above 8 percent of GDP and interest costs alone could exceed 3 percent of GDP, approaching the previous record set in 1991.
It's commendable that policymakers have called for fully offsetting new spending and tax breaks (see our five reasons to pay for investments). But rather than rely on gimmicks and sleights of hand to achieve this, they should either scale back the proposals, identify the necessary tax increases and spending reductions to cover the full costs of their proposals, or both.
How Much Would Build Back Better Add to the Deficit?
The Build Back Better plan consists of two parts: the $550 billion bipartisan Infrastructure Investment and Jobs Act and a plan to use reconciliation instructions to enact $3.5 trillion of spending and tax breaks, mostly related to family benefits, health care, and climate change mitigation.
Though policymakers claim both are paid for, a closer look suggests the offsets will fall short. The bipartisan infrastructure bill counts savings from policies that have already occurred, while the reconciliation plan is likely to claim excessive revenue from closing the tax gap and “long-term economic growth.”
We estimate the bipartisan infrastructure bill's offsets will total about $200 billion (excluding dynamic scoring), leaving a net cost of $350 billion. A conservative assumption of the reconciliation plan – one that assumes all $3 trillion of offsets are retained from the original plan promulgated by Senate Budget Committee Chairman Bernie Sanders (I-VT) – suggests its pay-fors will fall an additional $500 billion short (based on a Moody’s estimate, this figure could be higher). With interest, this suggests the two plans would directly add nearly $1 trillion to the debt over the next decade.
In addition, the reconciliation plan also relies on arbitrary sunsets to fit $5 trillion to $5.5 trillion worth of policies into a $3.5 trillion framework, and the bipartisan infrastructure bill appears to significantly increase baseline spending for highway and transit programs in the second half of the decade. Extensions could cost nearly $2 trillion, in total, as a result. Taken together, we estimate Build Back Better could ultimately set the stage for roughly $2.9 trillion more debt over the next decade.
Total Potential Net Cost of Build Back Better Agenda
| Ten-Year Cost | |
|---|---|
| Net cost of Infrastructure Investment and Jobs Act | $350 billion |
| Assumed net cost of reconciliation package | $500 billion |
| Potential cost of reconciliation package extensions | $1,750 billion* |
| Potential cost of transportation funding extensions | $70 billion |
| Debt service costs | $260 billion |
| Total potential net costs of Build Back Better | $2,930 billion |
*Assumes total cost of reconciliation policies, if made permanent, of $5.25 trillion – halfway between our published range of $5 to $5.5 trillion.
For reference, the combined cost of the Build Back Better agenda is similar to the total cost of the 2017 Tax Cuts and Jobs Act, if extended, over the same period (2022-2031). The $2.9 trillion is on top of the already-enacted American Rescue Plan, which added $2.1 trillion to the debt from 2021 through 2031.
How Much Would Build Back Better Boost the Debt?
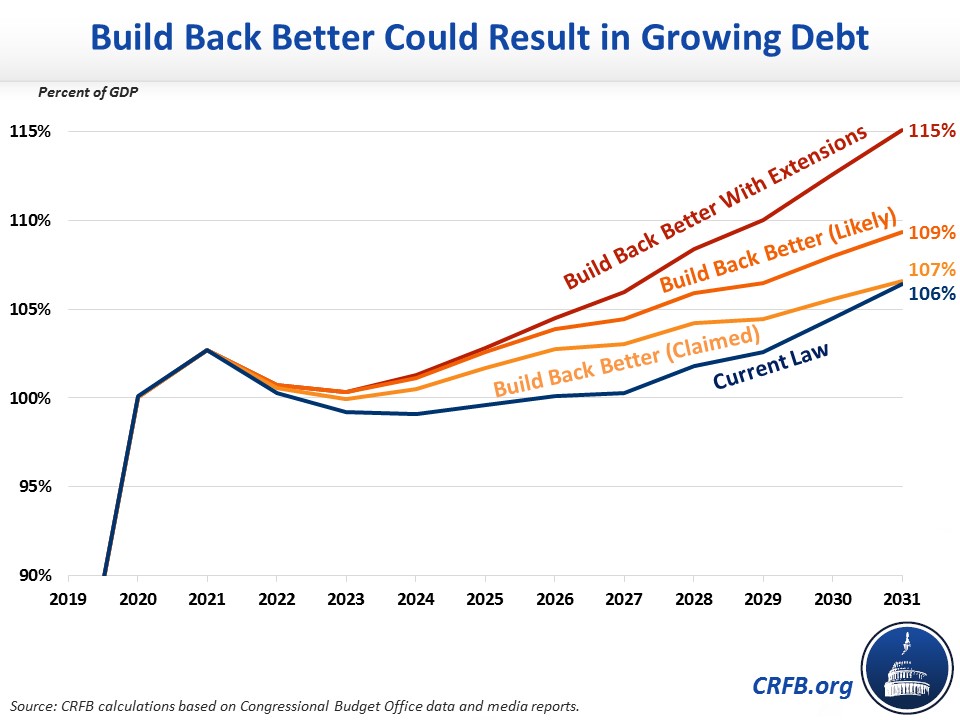
Under current law, debt is already slated to reach a new record – over 106 percent of GDP – by 2031. Under Build Back Better, it would hit that record sooner and grow much faster.
Even if fully paid for as claimed, the front-loaded nature of Build Back Better means debt would rise to 107 percent by 2031. Based on our estimates and assumptions of the direct costs of the plans, debt would reach a new record in 2029 and rise to 109 percent of GDP by 2031. Further incorporating possible extensions of expiring provisions and changes to the baseline, debt would reach a record in 2028 and rise to 115 percent of GDP by the end of the budget window.
How High Might Debt Go?
Without more robust offsets or lower spending, the Build Back Better plan, with extensions, could add 9 percent of GDP to the debt by the end of the decade. And there are risks that policymakers will make the situation far worse.
For example, if policymakers also extend various expiring tax provisions – mainly the expiration of individual provisions in the Tax Cuts and Jobs Act (TCJA) at the end of 2025 – debt will rise to 121 percent of GDP by the end of the decade. And if they grow appropriations with the economy rather than inflation, debt would reach 125 percent of GDP.1
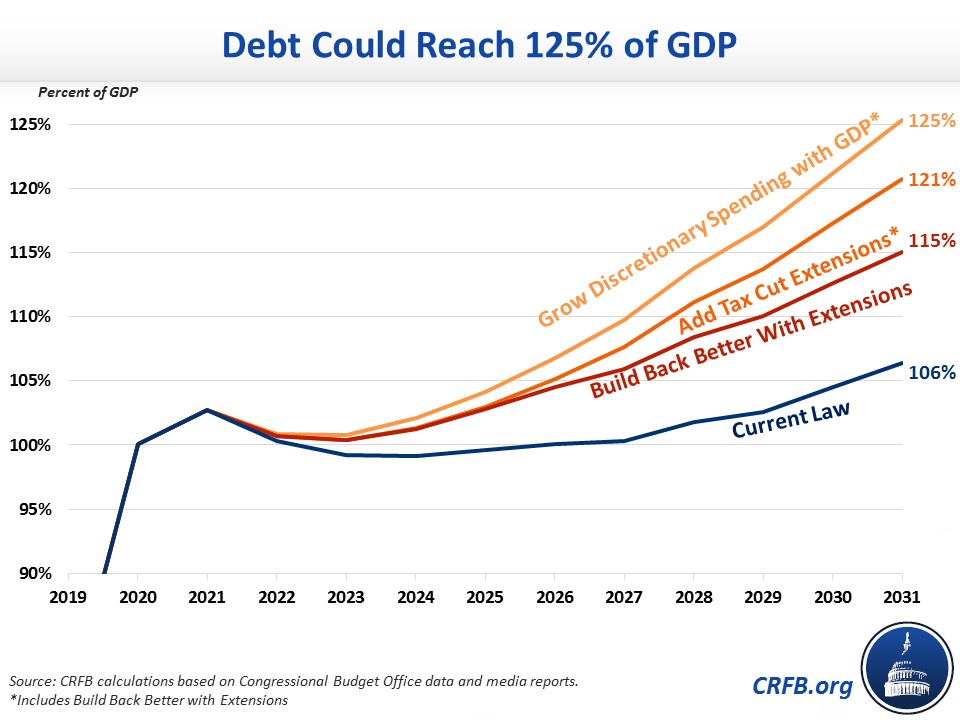
In that scenario, debt would be increasing much more rapidly over the long term than under current law, growing by about 4 percent of GDP annually by the end of the decade rather than 1 to 2 percent under current law. The budget deficit in this scenario would be above 8 percent of GDP by 2031, with interest costs above 3 percent of GDP, closing in on the previous record set in 1991. In nominal dollars, we estimate the deficit could grow to roughly $2.8 trillion by 2031, of which nearly $1.1 trillion would be interest payments.
Importantly, none of these estimates incorporate economic feedback effects, which could improve or worsen the situation. For example, Build Back Better and extensions of the TCJA could boost revenue if it resulted in larger GDP, but shrink revenue if new borrowing and taxes resulted in less output. In either case, the plans would almost certainly boost interest rates and debt service costs as a result of higher debt and increased labor productivity.
Whether any dynamic impact would increase or reduce costs is unclear. In 2016, the Congressional Budget Office estimated a generic package of paid-for public investments would generate feedback of 0 to 5 percent of gross costs while a deficit-financed package could worsen the deficit by 1 to 21 percent of gross costs. CBO estimated dynamic feedback from the original TCJA offset roughly 20 percent of net costs (and closer to 8 percent of gross costs).
*****
While it remains to be seen exactly what form the reconciliation plan will take and how the bipartisan infrastructure bill will score, all indications are that the plan will fall far short of being fully offset, particularly if temporary policies are made permanent. The Build Back Better plan would likely add about $1 trillion to deficits through 2031 as written and add $2.9 trillion if temporary policies are extended, causing debt to rise to 115 percent of GDP by 2031. Extending other temporary tax cuts and increasing discretionary spending with GDP would cause debt to reach 125 percent in 2031.
These numbers show that policymakers need to either reduce the gross cost of the infrastructure and reconciliation plans, incorporate additional offsets, or both to ensure a fiscally responsible plan. And going forward, policymakers should avoid enacting or extending other tax cuts and spending increases without fully offsetting the cost. Even under current law, debt is headed toward record levels. If policymakers abandon pay-as-you-go budgeting, the nation's debt trajectory would rise much more rapidly.
Read more options and analyses on our Reconciliation Resources page.
1 For Build Back Better, we assume the bipartisan Infrastructure Investment and Jobs Act includes $550 billion of front-loaded costs with $200 billion of offsets, and the reconciliation plan includes $3.5 trillion of partially front-loaded costs with $3 trillion of offsets. We assume extensions of the reconciliation plan will cost roughly $1.75 trillion over a decade, bringing total costs to $5.25 trillion. We also estimate an additional $70 billion of higher outlays from baseline changes from the infrastructure bill. For tax extensions, we assume all individual and estate tax provisions from the TCJA will be extended, except for the top rate (which we assume will remain 39.6 percent) and the limit on pass-through loss deductions (which we assume is already enacted in the reconciliation plan); we also assume the extension of 100 percent bonus depreciation and various tax extenders not related to renewable energy at a combined cost of roughly $250 billion. For discretionary spending, we assume annual appropriations will grow with potential nominal GDP rather than with inflation, at a cost of roughly $1.4 trillion before interest.


