Primary Care: Estimating Democratic Candidates’ Health Plans
Senator Bernie Sanders released a new set of proposals to offset the cost of his health care plan this week. Based on these new proposals, we have updated our paper – Primary Care: Estimating Democratic Candidates’ Health Plans – which estimates the fiscal impact of plans put forward by candidates Sanders, Biden, Buttigieg, and Warren. Whereas our previous estimates found Senator Sanders’s plan would fall $13.4 trillion short of being paid for, our newest estimates find his plan would fall just under $13 trillion short. The full analysis is available below. We have also updated our Primary Care infographics.
Health care is the single largest part of the federal budget and a key driver of our unsustainably rising national debt.1 Rising health care costs also place growing burdens on households and businesses and – along with a significant uninsured rate – have prompted those seeking higher office to propose bold solutions with significant fiscal implications.
As part of our US Budget Watch 2020 project, the Committee for a Responsible Federal Budget has analyzed the health care plans of four presidential candidates: Senator Bernie Sanders, Vice President Joe Biden, Mayor Pete Buttigieg, and Senator Elizabeth Warren.
On February 24, 2020, Senator Sanders released an updated set of options to offset his Medicare for All plan. This updated analysis incorporates those proposals.
For each plan, we score the fiscal impact of coverage and other spending provisions, reductions in current and proposed health care costs, direct offsets proposed as part of their plans to expand coverage, and further offsets meant to finance remaining costs. We focus on federal fiscal impact rather than the effect on total national health expenditures – though we estimate both.
Our estimates are rough and rounded, based on our best understanding of how campaign-level detail translates into specific policies, and subject to change as more details are made available.2 This report is for educational purposes and does not represent an endorsement of any candidate or any policy. It will be followed by further analysis of the candidates’ tax and spending proposals in the coming months.
This updated paper is part of US Budget Watch 2020, which analyzes policies put forward by the presidential candidates. Recent analyses we have released include the $4.7 trillion of new debt President Trump has signed into law and policy explainers of Joe Biden’s K-12 Plan, Elizabeth Warren's Higher Education Plan, and Bernie Sanders’s Social Security Expansion Act and Universal Child Care and Pre-K Plan. Our major papers from past election cycles include a comparison of the Trump and Clinton proposals and an analysis of Trump’s health plan in 2016, a comparison of the top four GOP primary candidates in 2012, and a series of papers comparing the candidates in the 2008 election. US Budget Watch 2020 is designed to inform the public and is not intended to express a view for or against any candidate or any specific policy proposal. Candidates’ proposals should be evaluated on a broad array of policy perspectives, including but certainly not limited to their approaches on deficits and debt.
The 2020 Democratic Candidate Health Plans at a Glance
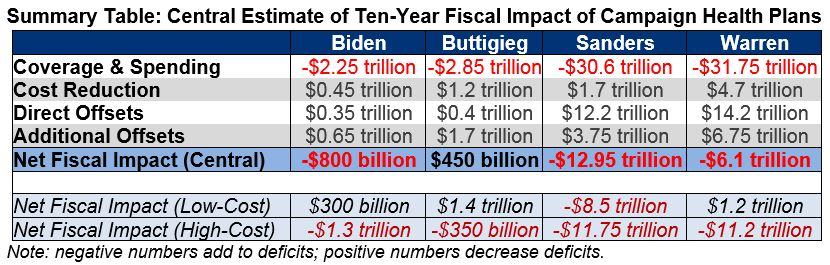
Our analysis estimates the budgetary implications of the health care plans put forward by the four leading Democratic presidential candidates based on national and early state polls. Our estimates find that:
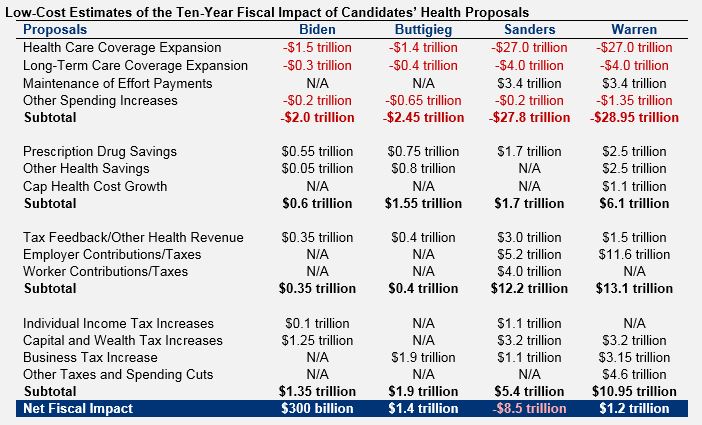
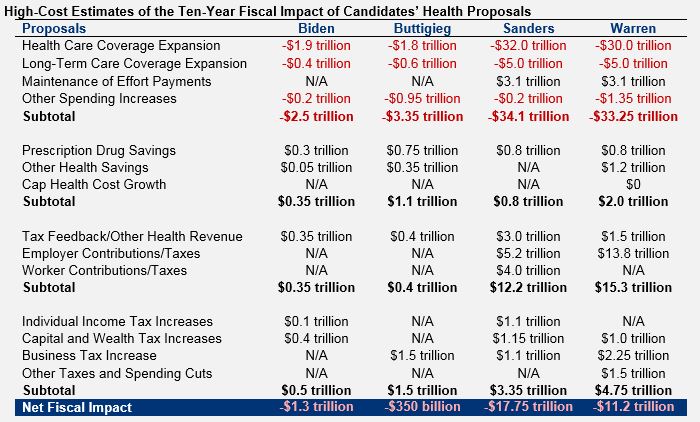
- Senator Bernie Sanders’s health plan has a gross cost of $30.6 trillion and, incorporating offsets, would add $12.95 trillion to deficits over ten years under our central estimate. It would add $8.5 trillion to deficits in our low-cost estimate and add $17.75 trillion to deficits in our high-cost estimate.
- Vice President Joe Biden’s health plan has a gross cost of $2.25 trillion and, incorporating offsets, would add $800 billion to deficits over ten years under our central estimate. It would save $300 billion in our low-cost estimate and add $1.3 trillion to deficits in our high-cost estimate.
- Mayor Pete Buttigieg’s health plan has a gross cost of $2.85 trillion and, incorporating offsets, would save $450 billion over ten years under our central estimate. It would save $1.4 trillion in our low-cost estimate and add $350 billion to deficits in our high-cost estimate.
- Senator Elizabeth Warren’s health plan has a gross cost of $31.75 trillion and, incorporating offsets, would add $6.1 trillion to deficits over ten years under our central estimate. It would save $1.2 trillion in our low-cost estimate and add $11.2 trillion to deficits in our high-cost estimate.
- Biden’s plan would cover an additional 15 to 20 million people, compared to 20 to 30 million for Buttigieg and 30 to 35 million for Sanders and Warren. In our central estimate, national health expenditures would fall modestly under the Biden and Buttigieg plans and rise modestly under the Sanders and Warren plans. Average premiums and out-of-pocket costs would fall under the Biden and Buttigieg plans and would be nearly eliminated under the Sanders and Warren plans.
Read the full PDF version.
What Are the Candidates Proposing?
The Democratic presidential candidates we analyzed have all put forward plans that to differing degrees expand coverage, further subsidize premiums and cost sharing, lower drug prices, increase support for long-term care, expand the government’s role as an insurer, and raise taxes. Details of the plans can be found on pages 10 to 38 of our paper and on the candidates’ websites.3
Senator Bernie Sanders proposes to replace most current public and private health insurance with a universal, publicly-funded “Medicare for All” program4 that would provide health and long-term care benefits to all U.S. residents with virtually no out-of-pocket costs or provider networks. He would also eliminate medical debt and enact other targeted spending increases. Provider payments under his plan would be based on Medicare rates, and drug prices would be set at the average of an international index. To finance his plan, Sanders put forward a number of revenue options on February 24, 2020, which include broad increases in tax rates for workers and employers as well as a series of targeted tax increases focused mainly on higher earners, wealthy households, and businesses. We assume all of these options would be enacted.
Vice President Joe Biden proposes to expand the Affordable Care Act by increasing marketplace subsidies, adopting auto-enrollment, and offering a new public option available to those in the individual market or with employer coverage. Biden would also offer a new long-term care tax credit and increase funding for rural health and mental health services. To finance the costs of this plan, Biden would enact reforms to reduce prescription drug prices, lower other health care costs, and raise taxes on capital gains and ordinary income for high earners and heirs.
Mayor Pete Buttigieg proposes to expand the Affordable Care Act by increasing marketplace subsidies, expanding auto-enrollment, establishing a retroactive enrollment process to essentially mandate coverage, and offering a new “Medicare for All Who Want It” public option available to those in the individual market or with employer coverage. Buttigieg would also establish a federal long-term care program, cap out-of-pocket costs in Medicare and for prescription drugs, and increase funding for rural health and mental health services. To finance the costs of this plan, he would enact reforms to reduce prescription drug prices, lower other health care costs – including capping out-of-network prices at 200 percent of Medicare rates and reducing Medicare payments – and raise corporate tax rates.
Senator Elizabeth Warren proposes to replace most current public and private health insurance with a universal, publicly-funded “Medicare for All” program that would provide health and long-term care benefits to all U.S. residents with virtually no out-of-pocket costs or provider networks; she would also enact several targeted spending increases. Her plan would pay most providers at or somewhat above Medicare rates and enact a number of targeted reforms to reduce provider payments. Her plan would also negotiate prescription drug prices substantially below current levels. Warren would finance her plan through direct employer contributions to replace current premium payments; through a series of tax increases focused on wealthy households, businesses, and the financial sector; and through immigration reform and defense cuts.
What is the Fiscal Impact of Each Candidate’s Plan?
Proposals to reform health care policy, if enacted, could have a substantial impact on the federal budget. However, the size and direction of that impact will depend on the specific tax and spending proposals put forward. The fiscal impact of any health care plan can be determined by summing net changes in federal spending and federal tax revenue.
While the candidates have proposed significant new tax and spending policies, the detail and specificity on their campaign websites is less than what would appear in legislation. Furthermore, few of the specific policies have been scored by the Congressional Budget Office (CBO), and many have not been estimated in their current forms by impartial sources.
We generated low-cost, central, and high-cost estimates for each candidate’s plan to best capture the likely cost range. These estimates are detailed on pages 10 through 38, with our methodology discussed mainly in the endnotes (especially endnote 2). Each scenario relies on different policy and estimating assumptions to present estimates that are rough, rounded, subject to change, and reflect our best understanding and estimates of the candidates’ policies given the information currently available and shared with us by the campaigns. The low- and high-cost estimates are not absolute bounds, as actual net costs could be below or above them. To allow for comparison across proposals, our estimates generally assume the candidates’ plans are fully phased in by the beginning of Fiscal Year (FY) 2021 and show the net fiscal impact between FY 2021 and FY 2030.
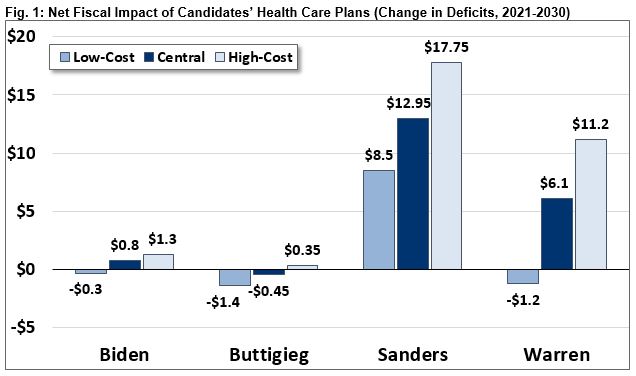
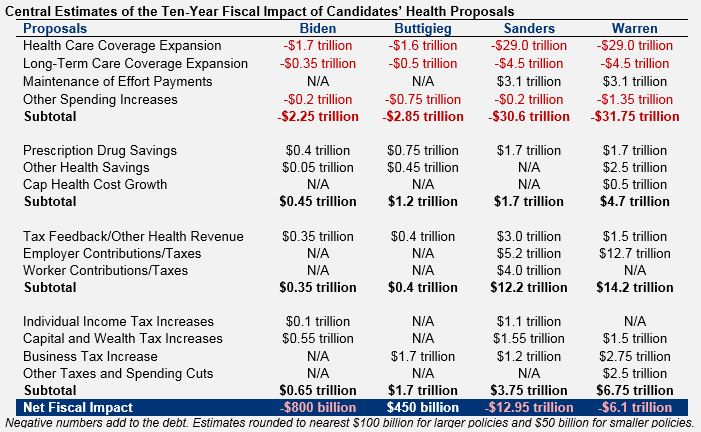
Under our central estimate, we find that Senator Sanders’s plan would increase deficits by $12.95 trillion over a decade, down from $13.4 trillion in our prior estimate. We find Vice President Biden’s health plan would increase deficits by $800 billion, Mayor Buttigieg’s plan would reduce deficits by $450 billion, and Senator Warren’s plan would increase deficits by $6.1 trillion.6 In our low-cost estimate, Sanders would increase deficits by $8.5 trillion, Biden would decrease deficits by $300 billion, Buttigieg would decrease deficits by $1.4 trillion, and Warren would decrease deficits by $1.2 trillion. Under our high-cost estimate, Sanders would increase them by $17.75 trillion, Biden would increase deficits by $1.3 trillion, Buttigieg would increase deficits by $350 billion, and Warren would increase deficits by $11.2 trillion. These figures represent the federal fiscal impact; greater federal costs are generally accompanied by lower household costs.
Our estimates represent the net effect of increases in spending, reductions to existing or proposed health spending, direct offsets that raise revenue as part of the candidates’ coverage plans, and additional offsets outlined by the campaigns to finance their plans.
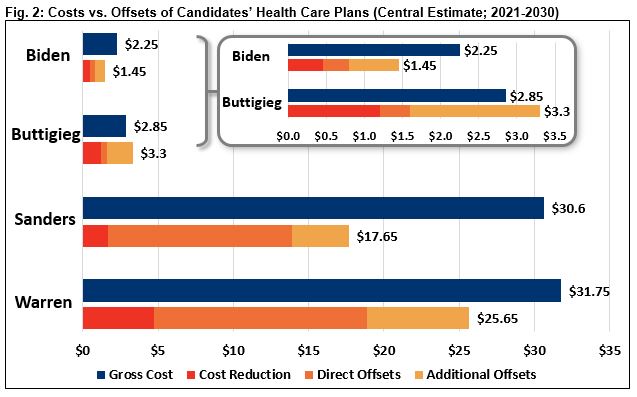
Under our central estimate, we find that Sanders would increase gross spending by $30.6 trillion, reduce costs by $1.7 trillion, raise $12.2 trillion in revenue through direct offsets, and raise another $3.75 trillion through additional offsets. Biden would increase gross spending by $2.25 trillion, reduce costs by $450 billion, and raise $1.0 trillion through direct and additional offsets. Buttigieg would increase gross spending by $2.85 trillion, reduce costs by $1.2 trillion, and raise $2.1 trillion through direct and additional offsets. Warren would increase gross spending by $31.75 trillion, reduce costs by $4.7 trillion, raise $14.2 trillion in revenue through direct offsets, and raise another $6.75 trillion through additional offsets.
What Are the Other Implications of the Candidates’ Plans?
While our analysis is focused on the fiscal impact of the presidential candidates’ health care plans, it is critical to also consider other implications of their proposals. These include, but are not limited to, their impact on health insurance coverage, national health expenditures, distribution of spending, and economic performance, as well as the effect on quality of care, access to care, provider viability, medical and pharmaceutical innovation, federal tax capacity, and other factors.
Our analysis provides some insight into how each plan might affect coverage, total costs, distribution, and economic growth – though estimates in these areas are rough and meant to show order of magnitude. Others have written on these and many other potential implications.7
Coverage
Over the next decade, an estimated 30 to 35 million people will lack comprehensive health insurance at some point in a given year, depending on the year, estimator, and definition of coverage. All four plans we analyzed would reduce the number of uninsured individuals substantially. We estimate Biden would reduce the number of uninsured by 15 to 20 million, mainly by improving the affordability of health coverage and auto-enrolling low-income Americans. We estimate Buttigieg would reduce the number of uninsured by 20 to 30 million by improving affordability and implementing auto-enrollment as well as retroactively enrolling and charging premiums to those who lack coverage – essentially establishing a stronger version of an individual mandate. Finally, both Warren and Sanders would reduce the number of uninsured by 30 to 35 million by offering universal Medicare for All coverage to virtually every U.S. resident.

National Health Expenditures
While all the candidates would increase federal health spending, the effects of each plan on total health spending – including spending from households and businesses – are more uncertain. National health expenditures would grow as a result of expanding coverage to more individuals, covering more services, and reducing or eliminating cost sharing and provider networks. Conversely, they would shrink due to lower drug costs, reduced reimbursements to providers, and administrative savings and efficiencies. The net effect for each of the candidates on total expenditures is likely small, and in most cases directionally ambiguous.
For Medicare for All plans especially, higher federal costs would be largely offset by lower household costs, leading total health costs to rise much less than federal spending. Even so, scholars at the Urban Institute has estimated that the version of Medicare for All they analyzed would increase national health expenditures by about 13 percent.8
We estimate Sanders’s plan as currently outlined would increase 2021-2030 national health expenditures by between 2 and 14 percent, with a central estimate of 6 percent – meaning that federal health expenditures would increase somewhat more than non-federal health spending would fall. Warren’s plan could reduce national health expenditures by as much as 4 percent or increase them by as much as 11 percent, with a central estimate that it would increase costs by about 3 percent.9 The magnitude of these increases would decline over time.
The effects of the Biden and Buttigieg plans on national health expenditures are far more uncertain. Under our central estimate, Biden’s plan would reduce national health expenditures by 1 percent and Buttigieg’s plan would reduce them by 2 percent.10 These estimates are very uncertain, and costs might rise or fall relative to current law under their plans.

Distribution of Health Spending
The four plans analyzed in this paper would all redistribute net income from high earners to low earners, on average, relative to current law.
All four plans reduce (or eliminate) premiums and cost sharing paid directly by households, on average, while also increasing average taxes. In each plan, taxes would increase significantly more for wealthy households than for low- and moderate-income households. New spending would be distributed across the income spectrum, particularly under Medicare for All plans. Overall, we expect some households in every income group to be better off and some to be worse off under each of the plans we analyzed. On net, however, each plan would significantly increase the progressivity of federal fiscal policy. This is especially true of the two Medicare for All plans, since they will nearly eliminate premiums and out-of-pocket health spending in favor of a much more progressive tax regime.
To the extent that any of these plans are deficit-financed or the offsets are not fully specified, they impose a hidden burden that would not be captured in a traditional distributional analysis. It is impossible to know the distribution of this burden between income groups, but it is likely to fall more heavily on younger and future generations than on older ones.
Macroeconomic Impact
The four plans analyzed in this paper are all likely to affect the economy in numerous ways. In addition to any possible near-term transitional effects, changes to the availability of health insurance could positively or negatively influence incentives to hire and work, the ability to move between jobs and ventures, incentives to save and invest, and other factors influencing the economy. As we’ve explained in prior work, the policies (or lack thereof) to finance the candidates’ health care proposals would also have significant impacts.11
While we have not estimated the effect of these four plans on economic growth, we believe standard economic models like those used by CBO would conclude that each plan has a statistically significant impact. Under these models, policies that substantially increase tax rates or expand deficits would tend to reduce the size of the economy over the long term, while policies that reduce deficits or more efficiently allocate taxes and spending would tend to increase the size of the economy. Further analysis is needed to determine the net impact of these particular plans on incomes, wages, and Gross Domestic Product (GDP).
Read the full PDF version.
Bernie Sanders’s Plan to Provide Health Care as a Human Right – Medicare for All
Note: The following analysis was updated on February 26, 2020, based on new revenue options released by Senator Sanders on February 24, 2020.
Senator Sanders has proposed to offer universal, publicly-funded “Medicare for All” health and long-term care benefits to all U.S. residents with virtually no out-of-pocket costs while also increasing other health-related spending and eliminating medical debt. Sanders also calls for reducing prescription drug spending and has proposed options to raise revenue through broad-based employee and employer taxes and tax increases focused on higher earners and the wealthy.
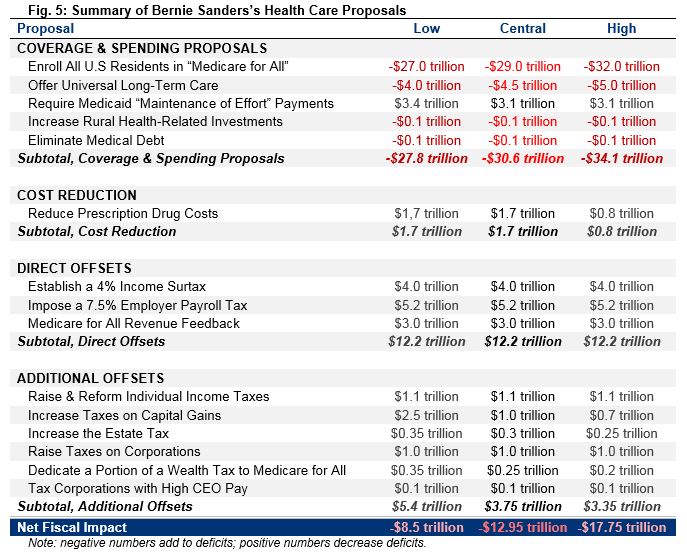
On net, we estimate his plan would add an additional $12.95 trillion to deficits over a decade under our central estimate. We estimate it would add $8.5 trillion to deficits in our low-cost estimate and $17.75 trillion in our high-cost estimate. Our estimates assume policies are fully phased in by 2021 for comparison purposes, though Sanders has proposed a four-year phase-in.
Sanders Coverage & Spending Proposals
Senator Sanders has proposed replacing the current mix of public and private financing of health care with a Medicare for All single-payer system where the federal government finances virtually the full cost of health care and offers a new long-term care program. On top of these programs, he would require states to contribute to the program in place of their current Medicaid spending, increase investments in rural health care, and eliminate all medical debt. We estimate these policies would have a gross cost of between $27.8 trillion and $34.1 trillion over a decade, with our central estimate being $30.6 trillion.
Methodological note: Though Sanders would phase in the program over four years, our analysis assumes his proposal is fully phased in by 2021. Our estimates are largely based on estimates of a plan similar to Sanders’s Medicare for All Act published by Blumberg, Holahan, Buettgens, Gangopadhyaya, Garrett, Shartzer, Simpson, Wang, Favreault, and Arnos of the Urban Institute (Urban).12 Our low-, central, and high-cost estimates reflect a variety of different assumptions. Our high-cost estimates match Urban most closely, whereas our low-cost figures incorporate insights from estimates of a similar proposal from the Warren campaign produced by Donald Berwick and Simon Johnson (Berwick & Johnson).13 Our low-cost estimates are also consistent with the $17.5 trillion estimate put forward by the campaign, adjusted to appropriately account for the cost of expanding long-term care and the federal cost of reduced state and local spending not covered under the maintenance of effort (roughly $10 trillion in total). It is possible the cost of Medicare for All might fall outside of our range, as a number of analysts have estimated.14
| Enroll All U.S. Residents in “Medicare for All” | -$27.0 trillion/-$29.0 trillion/-$32.0 trillion |
Sanders would replace the current system of public and private health insurance with a new government-run insurance program that would cover virtually all health care services without significant premiums, deductibles, copayments, coinsurance, or provider networks. All U.S. residents would be automatically enrolled in Medicare for All, which would cover all traditional medical care as well as dental, vision, hearing, and mental health services with provider payments based on Medicare rates. The Sanders campaign estimates this proposal would cost $17 trillion over a decade – $47 trillion of gross costs netted against $30 trillion of federal, state, and local spending that would occur under current law.15 Setting aside the methodological flaws of the underlying $47 trillion,16 a more appropriate estimate would subtract only the federal savings – which are closer to $20 trillion. Some state payments would continue under Maintenance of Effort provisions (estimated below). However, maintaining all of them would mean requiring local governments to continue paying the cost of health benefits for teachers, police, and other employees and compelling workers’ compensation insurers to charge current premiums and remit funds to the federal government. The Sanders campaign has made no such proposals.
Our low-cost estimate of $27 trillion is thus consistent with the campaign’s figures, properly estimated. We find Medicare for All would cost $29 trillion in our central estimate, which is similar to other credible estimates.17 Our high-cost estimate finds a cost of $32 trillion. These estimates differ in assumed administrative costs, utilization effects, and other assumptions; all assume drug payments remain at current levels and providers are paid based on Medicare rates.18
| Offer Universal Long-Term Care | -$4.0 trillion/-$4.5 trillion/-$5.0 trillion |
Under current law, many Americans lack access to long-term services and supports, and those who do use long-term care facilities often pay out of pocket until they exhaust their assets, at which point Medicaid covers the cost. Sanders’s plan would institute universal coverage for long-term services and supports. Consistent with the spirit of the Medicare for All Act (of which Sanders is the lead sponsor), Urban assumes this would be achieved through the creation of a new home- and community-based long-term care system that pays up to $150 per day, while maintaining Medicaid support of institutional care. Based on discussions with its authors, we understand Urban’s estimates show a cost of roughly $4.5 trillion over a decade.19 To account for possible differences in administrative costs, eligibility criteria, scope, reimbursement rates, and utilization assumptions, we assume $4 trillion in our low-cost estimate and $5 trillion in our high-cost estimate. This cost is on top of the Medicare for All costs estimated by the Sanders campaign.
| Require Medicaid “Maintenance of Effort” Payments | $3.4 trillion/$3.1 trillion/$3.1 trillion |
Because states pay for a substantial share of national health expenditures through Medicaid and the Children’s Health Insurance Program (CHIP), enacting Medicare for All on its own would effectively represent a significant cost transfer to the federal government from the states. To reduce the federal costs associated with Medicare for All, it is our understanding that Sanders would require states to pay the federal government what they otherwise would have paid for Medicaid and CHIP through a “Maintenance of Effort” payment. Based on the Urban study, we estimate this would reduce federal costs by $3.1 trillion over a decade in our central and high-cost estimates. Our low-cost estimate of $3.4 trillion in savings is based on Berwick & Johnson. Importantly, there is some uncertainty about the constitutionality of such a requirement.20 Since this policy would simply maintain current state spending and in order to maximize the comparability of our estimates, we count these savings as part of the gross cost of coverage.
| Increase Rural Health-Related Investments | -$100 billion |
Sanders would increase investments in rural communities and the health workforce serving them. Specifically, he would reauthorize and boost funding for Community Health Centers and increase the size of the rural health workforce through the National Health Services Corps. We estimate these proposals would cost roughly $100 billion over a decade.21
| Eliminate Medical Debt | -$100 billion |
In addition to making virtually all future health services free, Sanders would reduce the burden associated with past medical expenses by eliminating existing medical debt. Specifically, the government would pay off $81 billion of reported past-due medical debt. Sanders would also limit many existing debt-collection practices, reform bankruptcy laws to make it easier to discharge medical debt, and exclude medical debt from credit reports and various disclosure requirements. We assume these proposals would cost roughly $100 billion over a decade, based on what the Sanders campaign aims to pay for, though actual costs could be even lower if debt can be purchased at a discount.
| Subtotal, Sanders Coverage & Spending Proposals | -$27.8 trillion/-$30.6 trillion/-$34.1 trillion |
Sanders Cost Reduction
To limit the federal cost of Medicare for All, Senator Sanders would enact reforms to reduce prescription drug costs below current Medicare levels through price negotiation, re-importation, and international price indexing. We estimate these measures would achieve $800 billion to $1.7 trillion of savings over a decade, with our central estimate finding $1.7 trillion of savings.
| Reduce Prescription Drug Costs | $1.7 trillion/$1.7 trillion/$800 billion |
Sanders would work to reduce the costs of prescription drugs, with the goal of reducing prices of name-brand drugs by half. To achieve this, Sanders proposes to allow Medicare to negotiate drug prices directly, to allow re-importation of drugs from Canada and other industrialized countries, and – most significantly – to set name-brand drug prices at the median price across Canada, France, Germany, Japan, and the U.K.22 In our assessment, these policies could reduce the cost of name-brand drugs by roughly half as claimed.23 Under our low-cost and central estimates, we assume generic drug prices would also be cut by 25 to 30 percent. Taken together, these policies would result in $1.7 trillion of savings over a decade. Our high-cost estimate assumes all drug prices would be cut by an average of 25 to 30 percent, consistent with Urban’s assumption, resulting in $800 billion of savings.
| Subtotal, Sanders Cost Reduction | $1.7 trillion/$1.7 trillion/$800 billion |
Sanders Direct Offsets
Senator Sanders has proposed a number of options to finance Medicare for All.24 On February 26, 2020, we updated this analysis to incorporate these options, including three policies we view as direct offsets: an employer payroll tax, an income surtax (both are described as income-based premiums), and the elimination of health-related tax breaks. The Sanders campaign estimates these policies would raise $12.2 trillion – and we concur with these estimates.
| Establish a 4% Income Surtax | $4.0 trillion |
Sanders has suggested what he describes as a 4 percent income-based premium for Medicare for All. The tax would exempt the first $29,000 of income for a family of four, which is equivalent to the standard deduction and personal and dependent exemptions a four-person family would receive under the pre-2018 tax code. Effectively, this contribution is the equivalent of a 4 percent income surtax or an increase in every income tax rate by 4 percentage points. This would raise roughly $4 trillion over a decade.
| Impose a 7.5% Employer Payroll Tax | $5.2 trillion |
In addition to the individual contribution, Sanders proposes a 7.5 percent employer-paid income-based premium for Medicare for All. Essentially, employers would pay a 7.5 percent payroll tax on the wages they offer their employees, with the first $2 million of payroll exempt. Though technically paid by the employer, the tax – like current health premiums – would ultimately be borne by the employee. The Sanders campaign estimates this will raise $5.2 trillion. While we previously estimated it would raise $4 trillion, the difference is due to choices over how to distribute interactions – we concur with the $5.2 trillion estimate using the campaign’s method.
| Medicare for All Revenue Feedback | $3.0 trillion |
Because Americans would no longer pay premiums or face out-of-pocket costs, health-related tax breaks would become irrelevant. Specifically, the income and payroll tax deductions for employer-paid premiums, Health Savings Accounts, Flexible Spending Accounts, and itemized medical deductions would no longer be used, and employers would pay their employees more in the form of taxable wages as opposed to tax-free health care benefits. Partially offsetting these effects, the penalty for employers who do not provide health insurance coverage would no longer generate revenue. The Sanders campaign estimates this policy would raise $3 trillion over a decade. Assuming this figure estimates only the net reduction in employer spending – accounting for higher wages due to lack of premiums, partially offset by increased payroll tax contributions – we concur with this estimate.
| Subtotal, Sanders Direct Offsets | $12.2 trillion |
Sanders Additional Offsets
In addition to the direct offsets for Medicare for All, Senator Sanders has proposed a number of options for tax increases to offset the remaining costs. These options include increasing income taxes for high earners, taxing capital gains as ordinary income, increasing taxes on wealth, and raising taxes on businesses. Assuming all of these options are adopted, no additional policies are put forward, and that – where detail is missing – their structure is broadly similar to what Sanders proposed in 2017, we estimate these proposals would likely generate between $3.35 trillion and $5.4 trillion, with a central estimate of $3.75 trillion.
Methodological note: We assume the details not specified on the Sanders campaign’s website are generally based on Sanders’s 2017 options document. Our low-cost estimates are identical to those provided by the Sanders campaign. Our central and high-cost estimates match the campaign’s estimates in most cases but largely reflect our own estimates using the Open Source Policy Center’s Tax-Brain and a variety of credible sources. Future estimates may change if the policies are modeled by other independent estimators.
| Raise & Reform Individual Income Taxes | $1.1 trillion |
The current income tax imposes tax rates ranging from 10 percent up to 37 percent (39.6 percent after 2025) and allows for a number of deductions – including up to $10,000 in deductions for state and local taxes (SALT). Sanders proposes to increase income taxes on higher earners, including by raising the top rate to 52 percent on income above $10 million and replacing the current $10,000 cap on the SALT deduction with an overall cap on itemized deductions at a $50,000 fixed value for married couples (and presumably $25,000 for individuals). Based on Sanders’s revenue target and past proposals, we believe he would also increase the tax rate to 40 percent on income above $250,000, 45 percent above $500,000, and 50 percent above $2 million. We assume other individual income tax provisions currently in effect as a result of the Tax Cuts and Jobs Act are extended. The Sanders campaign estimates this would raise a combined $1.1 trillion over the next decade. Our own estimates are very similar.
| Increase Taxes on Capital Gains | $2.5 trillion/$1.0 trillion/$700 billion |
Under current law, long-term capital gains and qualified dividends are taxed at preferential rates that peak at 20 percent (23.8 percent including surtaxes). Sanders proposes to tax capital gains as ordinary income, equalizing the tax treatment of capital and wage income. This would result in a top ordinary capital gains rate of 52 percent, or 66 percent including various surtaxes. In addition, Sanders would tighten enforcement of capital gains taxation by “cracking down on gaming through derivatives, like-kind exchanges, and the zero tax rate on capital gains passed on through bequests.” In other words, Sanders would eliminate stepped-up basis of inherited assets and tax capital gains at death, count like-kind exchanges as an asset sale, and (in our understanding) tax derivatives on a mark-to-market basis. The Sanders campaign estimates this would raise $2.5 trillion over a decade, which we assume in our low-cost estimate. We believe this figure is likely too high, however, as higher capital gains rates tend to discourage realization of gains on assets.25 Under our central estimate, we find this policy will raise roughly $1 trillion over a decade.26 Under our high-cost estimate, which assumes stronger behavioral responses, these provisions would generate $700 billion.
| Increase the Estate Tax | $350 billion/$300 billion/$250 billion |
Under current law, very large estates face a one-time tax of 40 percent after a wealthy individual dies, with the first $11.6 million of wealth ($23.2 million for a couple) exempt from taxation. Sanders would increase the estate tax by enacting a version of the For the 99.8% Act. The proposal would lower the estate tax exemption to $3.5 million and tax estates at 45 percent up to $10 million, 50 percent up to $50 million, 55 percent up to $500 million, and 77 percent above that – doubling those amounts for couples. He would also close numerous estate tax loopholes. The Sanders campaign estimates this would raise almost $350 billion over a decade, which is our low-cost estimate. Our high-cost estimate is derived from Penn Wharton Budget Model’s estimate of just over $250 billion.27 Our central estimate assumes $300 billion in revenue – a midpoint between these estimates.
| Raise Taxes on Corporations | $1.0 trillion |
As part of his Corporate Accountability and Democracy plan, Sanders proposes numerous tax increases on businesses.28 Specifically, Sanders would raise the corporate tax rate from today’s 21 percent to 35 percent, eliminate almost all corporate tax breaks, transition to economic depreciation of assets, and limit interest deductibility to 20 percent of adjusted taxable income. He would also tax foreign and domestic corporate income at the same rates, limit the credit for foreign taxes paid on a per-country basis, strengthen rules against tax-advantaged inversions, and raise the minimum worldwide tax rate to 17.5 percent with various base broadeners. Finally, Sanders would eliminate the 20 percent pass-through business deduction entirely and tax all large pass-throughs at the corporate tax rate. The Sanders campaign estimates this plan would raise $3 trillion, $1 trillion of which Sanders would dedicate to paying for his health plan. We find this estimate to be credible and thus assume the full $1 trillion would be raised.29
| Dedicate a Portion of a Wealth Tax to Medicare for All | $350 billion/$250 billion/$200 billion |
Sanders has proposed “establishing a tax on extreme wealth.” Specifically, his proposed wealth tax would be imposed annually on households with over $32 million of net worth. The tax would be 1 percent of wealth up to $50 million, 2 percent up to $250 million, and would continue to rise on a graduated schedule until reaching 8 percent for household wealth over $10 billion.30 The Sanders campaign has said this wealth tax would raise $4.35 trillion over a decade, based on estimates from Emmanuel Saez and Gabriel Zucman (Saez & Zucman),31 and Sanders says $350 billion of this revenue would be used to fund Medicare for All. The other $4 trillion would be used to fund his Housing for All plan ($2.5 trillion) and his universal child care and pre-k plan ($1.5 trillion).
The Saez & Zucman estimates do not account for the fact that wealth tax avoidance will rise as tax rates do, nor the fact that a high tax on wealth will have the effect of reducing assets held by the wealthy and thus lead the tax base to shrink over time.32 Independent estimates that incorporate these effects have found the Sanders wealth tax will raise between $3 trillion and $3.3 trillion over a decade.33 Allocating the amount for Medicare for All proportionally with the total wealth tax revenue, we estimate this would be about $250 billion over a decade under our central estimate. Our low-cost estimate assumes it would raise $350 billion, and our high-cost estimate assumes it would raise $200 billion.
| Tax Corporations with High CEO Pay | $100 billion |
To finance his plan to eliminate medical debt, Sanders would increase the corporate income tax rate on companies who pay their CEOs substantially more than their workers.34 The policy would increase the tax rate by 0.5 percent for companies with CEO pay over 50 times that of the median worker, 1 percent for companies with CEOs paid over 100 times more, and by increasing amounts from there – with a 5 percent increase for companies with CEO pay of more than 500 times that of the median worker. The Sanders campaign estimates this would raise $150 billion over a decade assuming current trends continue. Since the policy would likely lead many companies to reduce (or stem increases in) CEO pay and/or engage in avoidance strategies, we estimate the policy would raise $100 billion.
| Subtotal, Sanders Additional Offsets | $5.4 trillion/$3.75 trillion/$3.35 trillion |
| Net Fiscal Impact, Sanders Health Plan | -$8.5 trillion/-$12.95 trillion/-$17.75 trillion |
Read the full PDF version.
Joe Biden’s Plan to Protect and Build on the Affordable Care Act
Vice President Biden has proposed to expand the Affordable Care Act (ACA), establish a new public insurance option, increase the affordability of long-term care, and increase other health care spending. He would offset the costs of these proposals by containing and reducing spending on prescription drugs and ending surprise billing, through the revenue feedback from his coverage expansion, and by increasing taxes on high-income households and heirs.
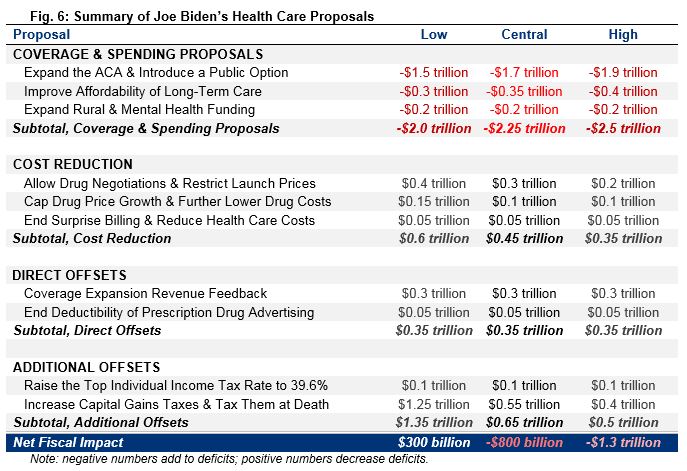
On net, we estimate these policies would add $800 billion to deficits over ten years under our central estimate. We estimate they would save $300 billion in our low-cost estimate and add $1.3 trillion to deficits in our high-cost estimate.
Biden Coverage & Spending Proposals
Vice President Biden has proposed expanding health care coverage by increasing the size of ACA subsidies, implementing a public option to compete with private insurance, increasing access to and affordability of long-term care and insurance, and expanding health funding for rural communities and mental health care. We estimate these policies would have a gross cost of between $2.0 trillion and $2.5 trillion, with our central estimate of $2.25 trillion.
| Expand the ACA & Introduce a Public Option | -$1.5 trillion/-$1.7 trillion/-$1.9 trillion |
Biden’s plan would build on the Affordable Care Act (ACA) by expanding current subsides, establishing a new public insurance option, and automatically enrolling low-income individuals into premium-free coverage.
His plan would increase the generosity of ACA premium subsidies in several ways. Currently, subsidies are determined based on the cost of a “silver” plan with a 70 percent actuarial value.35 Biden proposes basing subsidies on the cost of a “gold” plan with an 80 percent actuarial value. He would further increase subsidies by reducing the share of income that subsidized households would be expected to pay for their insurance and capping that share at 8.5 percent of income for all Americans (currently, those below 400 percent of the federal poverty level are capped at 9.8 percent, and those above that threshold have no cap).36
Biden would also establish a new Medicare-like public option that could be purchased with ACA subsidies. Because Medicare rates are generally lower than private insurance, the public option would be cheaper than alternatives in many cases – though competition from the public option could reduce the cost of private insurance as well. The public option would be available to those who lack insurance, those who purchase insurance through the exchanges, and low-income people in states that have not expanded Medicaid under the ACA (these individuals would receive premium-free coverage).37 The public option and subsidized coverage in the exchanges would also be made available to those with employer coverage (which implies a repeal of the ACA’s employer mandate). Biden would automatically enroll low-income beneficiaries into the public option when they interact with public institutions and programs such as public schools or the Supplemental Nutrition Assistance Program (SNAP, or food stamps).
Though not all details of Biden’s plan have been made public, the plan appears to be very similar to Variation #2 of the Healthy America Program proposed by Blumberg, Holahan, Buettgens, and Zuckerman of the Urban Institute (Healthy America) – which is cited on Biden’s campaign website.38 The most significant difference is that Biden would maintain the existing Medicaid program in roughly its current form, unlike Healthy America. Accounting for those and other differences, we estimate the proposal would cost about $1.7 trillion over a decade under our central estimate.39 Given uncertainty about both the estimates and plan details, we assume a cost of $1.5 trillion and $1.9 trillion under our low- and high-cost estimates, respectively.40
| Improve Affordability of Long-Term Care | -$300 billion/-$350 billion/-$400 billion |
Under current law, many Americans lack access to long-term services and supports and instead rely on family caretakers. Those who do use long-term care facilities often pay out of pocket until they exhaust their assets, at which point Medicaid covers the cost. Biden would expand access to and defray the cost of long-term care in two primary ways. First, he would establish a $5,000 tax credit for informal or family caregivers to cover out-of-pocket expenses based on the Credit for Caring Act.41 Second, he would increase the generosity of current tax benefits for purchasing long-term care insurance (including insurance paid for out of retirement savings). Based largely on estimates from Favreault and Spillman of the Urban Institute,42 we find this would cost $350 billion over a decade under our central estimate. It would cost $300 billion and $400 billion under our low- and high-cost estimates, respectively.43
| Expand Rural Health & Mental Health Funding | -$200 billion |
Biden would increase federal health care spending in several other areas – most significantly in relation to rural health care and mental health funding. For instance, he would double federal funding for Community Health Centers – more than half of which are located in rural communities.44 He would also increase funding for the USDA Community Facilities Direct Loan and Grant Program to build new health clinics and deploy telehealth services, reverse scheduled cuts to Disproportionate Share Hospital (DSH) payments for hospitals serving those without insurance, and adopt several other provisions included in the Save Rural Hospitals Act to support rural hospitals and expand care in rural communities. Separately, Biden would improve enforcement of mental health parity laws and expand funding for mental health services. We estimate these provisions would cost approximately $200 billion over a decade.
| Subtotal, Biden Coverage & Spending Proposals | -$2.0 trillion/-$2.25 trillion/-$2.5 trillion |
Biden Cost Reduction
While Vice President Biden would increase overall health care spending, he also proposes several measures to reduce both private and public health care costs. He would reduce prescription drug prices in a number of ways – most directly by restricting the launch price of new drugs based on an international average – and reduce other costs as well. We estimate these proposals would save between $350 billion and $600 billion over a decade, with a central estimate of $450 billion.
| Allow Drug Negotiations & Restrict Launch Prices | $400 billion/$300 billion/$200 billion |
To reduce prescription drug spending for both individuals and the federal government, Biden would use the federal government’s market and regulatory power to limit prices. Specifically, he would repeal the law that bans Medicare from negotiating drug prices directly.45 For new drugs and biologics sold without competition, Biden would establish an independent board to set reasonable prices based on the average price in other countries (when available). This price would be used in Medicare and the public option and would also be available for private plans on the individual market. Assuming the board relies on a proxy price when there is no international average (as many drugs are introduced first in the U.S.),46 we estimate these proposals would save about $300 billion over a decade under our central estimate, with savings of $400 billion in our low-cost estimate and $200 billion in our high-cost estimate.47
| Cap Drug Price Growth & Further Lower Drug Costs | $150 billion/$100 billion/$100 billion |
Biden would also reduce prescription drug prices in several other ways. Most significantly, he would limit price increases for name-brand drugs, biotech drugs, and “abusively priced” generic drugs to the rate of inflation. In order to participate in Medicare or the new public option, drug manufacturers would be required to adhere to this limit, which would be enforced with a tax penalty. In addition, Biden would allow the purchase of safe prescription drugs from other countries. Finally, the plan supports “numerous proposals” to encourage the accelerated development and introduction of generic drugs to increase competition. We estimate these proposals would save about $100 billion under our central and high-cost estimates. Our low-cost estimate of $150 billion assumes additional unspecified policies to encourage generics.48
| End Surprise Billing & Reduce Health Care Costs | $50 billion |
Biden would also enact several other provisions designed to reduce non-drug health care costs. He would end the practice of “surprise medical billing” – which occurs when a person goes to an in-network facility but receives care from an out-of-network clinician at an additional out-of-network cost – by requiring that providers at an in-network facility be paid in-network rates when the patient has little control over which provider they see. Biden would also address the issue of increasing market concentration among hospitals and health care providers by using existing antitrust authority to block health care industry mergers and acquisitions that would result in more expensive, lower quality, or less accessible care. Finally, he would partner with the health care workforce to deploy innovations designed to improve outcomes and lower costs. We estimate these provisions would save approximately $50 billion over ten years.49
| Subtotal, Biden Cost Reduction | $0.6 trillion/$0.45 trillion/$0.35 trillion |
Biden Direct Offsets
Vice President Biden’s health spending proposals would be partially offset by changes in health-related revenue. Expanding subsidized coverage would reduce employer-provided health coverage and thus reduce the cost of tax breaks associated with that coverage. Biden would also limit the deductibility of drug advertising. We estimate these proposals would save about $350 billion over a decade.
| Coverage Expansion Revenue Feedback | $300 billion |
By expanding coverage in the exchanges and creating a public option, Biden would reduce the number of Americans who receive health insurance benefits through their employer’s plan, might also reduce the per-person cost of employer-provided health insurance, and would lower out-of-pocket costs for many Americans. As a result, wages would be higher, and existing income and payroll tax breaks related to health care – especially the tax exclusion for employer-provided health insurance – would become less valuable. We estimate this would lead to roughly $300 billion in additional income and payroll tax revenue over a decade.50
| End Deductibility of Prescription Drug Advertising | $50 billion |
Under current law, pharmaceutical companies can deduct the cost of Direct-To-Consumer (DTC) advertising for tax purposes as a normal business expense. In order to discourage DTC advertising – which many argue leads to higher prescription drug demand and prices – Biden would eliminate this deduction, as proposed by the End Taxpayer Subsidies for Drug Ads Act.51 Assuming a 28 percent corporate tax rate (which Biden has proposed outside of his health plan52), we find this provision would raise less than $50 billion over a decade.53
| Subtotal, Biden Direct Offsets | $0.35 trillion/$0.35 trillion/$0.35 trillion |
Biden Additional Offsets
Vice President Biden proposes financing his health care plan by increasing taxes on high earners. Specifically, he would increase the top individual income tax rate, tax capital gains as ordinary income for high earners, and eliminate stepped-up basis of capital gains at death. We estimate these proposals would likely generate between $500 billion and $1.35 trillion in new revenue for the federal government over a decade, with a central estimate of $650 billion.
Methodological Note: Our low-cost estimates are based on numbers provided by the Biden campaign and reported by Jennifer Epstein of Bloomberg News.54 Our central and high-cost estimates are our own, largely calculated using the Open Source Policy Center’s Tax-Brain model.55 Future estimates may change as Biden’s tax policies are modeled by other independent estimators.
| Raise the Top Individual Income Tax Rate to 39.6% | $100 billion |
Currently, the top individual income tax rate is 37 percent on income above roughly $518,000 ($622,000 for married filers) through 2025. Prior to passage of the Tax Cuts and Jobs Act (TCJA), the top rate was 39.6 percent, and that rate will be restored in 2026 under current law. To help pay for his health care plan, Biden has proposed an immediate increase in the top rate to 39.6 percent. This would generate roughly $100 billion in new revenue over ten years (all by 2026).56
| Increase Capital Gains Taxes & Tax Them at Death | $1.25 trillion/$550 billion/$400 billion |
Under current law, long-term capital gains are taxed at a preferential rate (excluding surtaxes, the top rate is 20 percent, compared to 37 percent on earned income) and are assessed only after the gain has been realized. In addition, when an asset is passed on to heirs through inheritance, the cost basis of that asset gets “stepped up” to the market price at the time the asset was transferred – meaning all capital gains accrued over the deceased individual’s lifetime escape taxation. For those making over $1 million per year, Biden would tax capital gains at the ordinary income tax rate of 39.6 percent, nearly double the current rate.57 In addition, Biden would eliminate stepped-up basis so capital gains would generally be taxed at death as if they had been sold. Not only would taxing capital gains at death generate direct revenue, it would also magnify the revenue effect of raising the capital gains rate by reducing the incentive for taxpayers to hold stock until death.58 We find these provisions would raise about $550 billion over the next decade under our central estimate.59 Our low-cost scenario assumes $1.25 trillion of revenue, based on figures from the Biden campaign.60 Under our high-cost estimate, which assumes stronger behavioral responses, these provisions would generate $400 billion in revenue.
| Subtotal, Biden Additional Offsets | $1.35 trillion/$0.65 trillion/$0.5 trillion |
| Net Fiscal Impact, Biden Health Plan | $300 billion/-$800 billion/-$1.3 trillion |
Read the full PDF version.
Pete Buttigieg’s Plan for a New Era for Health in America
Mayor Buttigieg has proposed to expand the Affordable Care Act (ACA), establish a new “Medicare for All Who Want It” public insurance option with retroactive enrollment, increase the affordability of long-term care, and increase other health care spending. He would offset the cost of these proposals by reducing prescription drug prices, reducing and reforming Medicare provider payments, reducing private health costs (including by ending surprise billing and capping out-of-network care prices), generating feedback revenue through his coverage expansion proposals, and raising the corporate income tax rate.
On net, we estimate these proposals would likely save the federal government $450 billion over a decade under our central estimate. We estimate they would save $1.4 trillion under our low-cost estimate and increase deficits by $350 billion under our high-cost estimate.
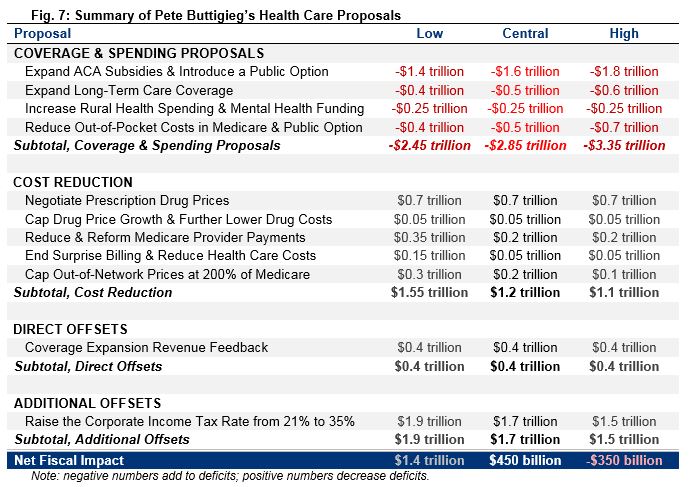
Buttigieg Coverage & Spending Proposals
Mayor Buttigieg has proposed to expand health care coverage by increasing ACA subsidies, implementing a public option to compete with private insurance, establishing a new long-term care program, expanding health funding for rural communities and mental illnesses, and reducing out-of-pockets costs for those in Medicare and the new public option. We estimate these policies would have a gross cost of between $2.45 trillion and $3.35 trillion over a decade, with our central estimate of $2.85 trillion.
| Expand ACA Subsidies & Introduce a Public Option | -$1.4 trillion/-$1.6 trillion/-$1.8 trillion |
Buttigieg would expand the Affordable Care Act (ACA), establish a “Medicare for All Who Want It” public option, automatically enroll eligible Americans into affordable coverage, retroactively enroll those who don’t sign up for insurance, and establish a new fund to reimburse providers for uncompensated care.
Buttigieg would increase the generosity of ACA premium subsidies in several ways. Currently, subsidies are based on the cost of a “silver” plan with a 70 percent actuarial value.61 Under Buttigieg’s proposal, subsidies would be determined based on the cost of a “gold” plan with an 80 percent actuarial value. He would further increase subsidies by reducing the share of income that subsidized households would be expected to pay for their insurance, capping it at 8.5 percent of income for all Americans (currently, those below 400 percent of the federal poverty level are capped at 9.8 percent; there is no cap for those above that threshold).62 In addition, he would restore funding for and expand cost-sharing reductions.63 Finally, he would overturn multiple Trump Administration rules supporting the sale of less generous insurance plans.64
Buttigieg would also establish a new “Medicare for All Who Want It” public option that would be available to those purchasing insurance on the insurance exchanges, low-income households in states that have not expanded Medicaid under the ACA, and those who currently lack insurance. In addition, those with employer coverage could opt to instead use their employer’s contribution to buy into the public plan, and employers themselves could buy the plan on behalf of their workers (this implies a repeal of the ACA’s employer mandate – though the campaign has said some employer contribution would remain). Buttigieg would automatically enroll individuals eligible for free coverage into the public option. Finally, he would establish a process to retroactively enroll Americans without insurance in the public option and charge them a premium after the fact (presumably as part of tax filing).65 Medical providers would be reimbursed for care given prior to enrollment through a new uncompensated care fund.
Buttigieg’s proposal resembles Option #5 in From Incremental to Comprehensive Health Reform by Blumberg, Holahan, Beuttgens, Gangopadhyaya, Garrett, Shartzer, Simpson, Wang, Favreault, and Arnos of the Urban Institute (Urban) in many ways.66 Based on Urban’s estimates, we believe these policies would cost $1.6 trillion over a decade under our central estimate and between $1.4 trillion and $1.8 trillion in our low- and high-cost scenarios. This is consistent with the campaign’s estimate of $1.5 trillion.67
| Expand Long-Term Care Coverage | -$400 billion/-$500 billion/-$600 billion |
Buttigieg would expand coverage for long-term care by establishing a federal Long-Term Care America program to provide coverage to people over age 65. The program would pay up to $90 per day, adjusted for geographic area and for inflation in future years. Buttigieg would also increase Medicaid income and asset limits for long-term care benefit eligibility, make permanent spousal impoverishment rules to protect a person’s assets when their spouse goes into long-term care, and eliminate Medicaid estate recovery of long-term care benefits.68 Based largely on work from Favreault and Johnson of the Urban Institute,69 we find this would cost about $500 billion over a decade under our central estimate. We assume $400 billion in our low-cost estimate, which is consistent with the campaign’s own estimates, and $600 billion under our high-cost estimate.70
| Increase Rural Health Spending & Mental Health Funding | -$250 billion |
Buttigieg would increase funding for rural health care in a variety of ways, including by increasing Medicare reimbursements in underserved areas, increasing and expanding reimbursements for telehealth, increasing funding for rural veterans’ health care, and expanding Public Service Loan Forgiveness to rural providers. For mental health care, he would increase reimbursements for mental health providers, expand current mental health parity rules (which require mental health coverage to be equivalent to physical health coverage), repeal the Medicaid prohibition on funding large mental health treatment facilities (known as the IMD exclusion), and eliminate the 190-day lifetime limit on Medicare inpatient psychiatric admissions. Based on campaign estimates, discussions with the campaign, and our own estimates, we believe these policies combined would cost roughly $250 billion over a decade.71
| Reduce Out-of-Pocket Costs in Medicare & Public Option | -$400 billion/-$500 billion/-$700 billion |
Buttigieg would enact several changes to reduce total cost sharing, especially among seniors. Most significantly, he would establish a new out-of-pocket cap for Medicare Parts A and B (currently, costs are only capped for those enrolled in Medicare Advantage), with a lower cap for low-income seniors. Further, he would cap out-of-pocket drug costs at $200 per month or $2,400 per year under Medicare Part D (currently, seniors are liable for 5 percent of costs after spending about $2,650 in a year and $250 per month72) or $3,000 per year under the public option. Finally, he would eliminate copays for generic drugs purchased by low-income beneficiaries in Medicare, the public option, and Medicaid.73 The campaign has told us that Buttigieg intends to fully offset the Medicare Parts A and B cap with health savings and would set the cap at an affordable level using these offsets. We currently do not have the details of these offsets; however, we will update our estimates as the campaign releases more details. Ignoring potential offsets, the total cost of these policies depends on the exact specifications, especially the magnitude of the Medicare cap. Under our central estimate, we assume a cap of $6,700 to match Medicare Advantage’s mandated cap (and budget-neutral adjustments to further reduce low-income cost sharing) based on the campaign’s argument that “seniors enrolled in Medicare Advantage are protected from high out-of-pocket costs” and “seniors in traditional Medicare deserve the same financial protection.” We find all of these proposals would cost roughly $500 billion over a decade. Under our low-cost estimate, they would cost $400 billion and $700 billion under our high-cost estimate.74
| Subtotal, Buttigieg Coverage & Spending Proposals | -$2.45 trillion/-$2.85 trillion/-$3.35 trillion |
Buttigieg Cost Reduction
To help offset the cost of his coverage and spending proposals while reducing health costs generally, Mayor Buttigieg would enact several changes to lower the cost of prescription drugs, reduce Medicare provider payments, lower spending on surprise billing, reduce administrative costs, and cap out-of-network care charges. We estimate these proposals would save between $1.1 trillion and $1.55 trillion over a decade, with a central estimate of $1.2 trillion.
| Negotiate Prescription Drug Prices | $700 billion |
Buttigieg proposes requiring the Secretary of Health and Human Services to negotiate the price of at least 25 prescription drugs per year on behalf of Medicare and the new public option and make these prices available to other payers. The Secretary would begin by negotiating down the price of the most expensive or overpriced drugs compared to international prices and based on the value and production cost of the drug, cost of alternative treatments, and the international cost of the drug. Negotiations would be enforced through a prohibitively high penalty (up to 95 percent of gross sales) and threat of patent confiscation for those companies who refuse to negotiate a “fair” price. In our assessment and based on conversations with the campaign, we believe this proposal closely matches provisions in the Elijah E. Cummings Lower Drug Costs Now Act, which would cap negotiated prices at 120 percent of an international average (or 85 percent of the average manufacturers price).75 We estimate the proposal would save about $700 billion if implemented immediately and enacted in concert with Buttigieg’s other proposals.
| Cap Drug Price Growth & Further Lower Drug Costs | $50 billion |
In addition to negotiating lower drug prices, Buttigieg would also reduce prescription drug prices by preventing drug price growth in excess of inflation for Medicare and the public option. In addition, he would prohibit certain practices used by drug manufacturers to delay generic drug competition. These include prohibiting “pay-for-delay” agreements, closing the “REMS loophole,” prohibiting meritless citizen petitions, and prohibiting “product hopping.”76 Buttigieg would also increase the fee on prescription drug manufacturers by an unspecified amount and use the revenue to further increase access to prescription drugs. In total, we estimate these policies would save about $50 billion over a decade.77
| Reduce & Reform Medicare Provider Payments | $350 billion/$200 billion/$200 billion |
Buttigieg would further reduce the cost of the Medicare program by reducing and reforming provider payments. Though it has not been made available on Buttigieg’s website, the campaign has shared with us and several press outlets a set of recommendations that it estimates would save Medicare nearly $300 billion through 2029.78 Specifically, Buttigieg would enact site-neutral payments so hospitals are paid the same as physician clinics for similar services, reduce payments for post-acute care, lower payments to hospitals that employ medical residents and interns (graduate medical education), and work to reduce adverse hospital events such as hospital-acquired infections.79 Most of these policies have been proposed on a bipartisan basis to reduce the costs of traditional Medicare. We estimate these policies would save about $200 billion over a decade under our central and high-cost estimates.80 Our low-cost estimate of $350 billion relies on the campaign’s estimates – some from the Office of Management and Budget – extrapolated through 2030.
| End Surprise Billing & Reduce Health Care Costs | $150 billion/$50 billion/$50 billion |
Buttigieg has a number of proposals to reduce other non-drug costs outside of Medicare. First, he would ban the practice of surprise billing – which occurs when a person goes to an in-network facility but receives care from an out-of-network clinician at an additional out-of-network cost – by requiring that all providers at an in-network facility be treated as in-network. Second, he would work to reduce administrative costs by standardizing health care transactions and billing, establishing an All-Payer Claims Database, and fully integrating electronic health records. Third, he would work to improve price and quality transparency throughout the health care system. Finally, he would work to limit hospital mergers and other anti-competitive behavior, including by non-profit hospitals. We expect these policies would reduce overall health care costs, reduce subsidized and tax-preferred insurance premiums, and save the federal government about $50 billion over a decade under our central and high-cost estimates.81 Our low-cost estimate finds $150 billion of savings, assuming significantly larger administrative savings based on an analysis by Elizabeth Wikler, Peter Basch, and David Cutler of the Center for American Progress.82
| Cap Out-of-Network Charges at 200% of Medicare | $300 billion/$200 billion/$100 billion |
On average, health care providers charge significantly more to private insurance companies than they do to Medicare, particularly for out-of-network services where insurance companies have little leverage. In order to reduce that price differential and increase the leverage of insurance companies trying to bring providers into their networks, Buttigieg would prohibit providers from charging more than twice Medicare rates for out-of-network services. This cap could significantly reduce private insurance premiums, as nearly half of hospital admissions and a smaller but still significant share of physician services currently cost at least twice as much under commercial plans than under Medicare.83 While we unfortunately do not have a strong basis for estimating the savings and revenue feedback from this policy, our present assumption is that it will save about $200 billion over the next decade.84 Our low-cost estimate assumes $300 billion of savings and our high-cost estimate assumes $100 billion. These figures are especially uncertain.
| Subtotal, Buttigieg Cost Reduction | $1.55 trillion/$1.2 trillion/$1.1 trillion |
Buttigieg Direct Offsets
Partially offsetting Mayor Buttigieg’s coverage expansions and spending increases would be the revenue feedback from those policies.
| Coverage Expansion Revenue Feedback | $400 billion |
By expanding coverage in the exchanges and through the public option, Buttigieg would reduce the number of Americans who get health insurance through their employer. In addition, the plan might reduce the cost of employer-provided insurance and would reduce out-of-pocket costs for many Americans. As a result, wages would be higher and existing income and payroll tax breaks related to health care – especially the tax exclusion for employer-provided health insurance – would become less valuable. Based on conversations with the campaign, we also understand employers would be responsible to contribute if their workers buy on the exchange – and so as a proxy we assume current revenue from the ACA’s employer mandate remains. We estimate this would lead to roughly $400 billion of additional revenue over a decade.85
| Subtotal, Buttigieg Direct Offsets | $400 billion |
Buttigieg Additional Offsets
Mayor Buttigieg proposes raising the corporate tax rate to raise additional revenues.
| Raise the Corporate Income Tax Rate From 21% to 35% | $1.9 trillion/$1.7 trillion/$1.5 trillion |
Buttigieg has said he would pay for his coverage expansions mainly by “rolling back the Trump corporate tax cuts,” which the campaign estimates would raise $1.4 trillion over ten years. Based on press reports and discussions with the campaign, we understand this policy to mean increasing the corporate tax rate from 21 percent to 35 percent while retaining other changes to the corporate code, including the base broadening enacted under the Tax Cuts and Jobs Act of 2017 (TCJA). This would not only restore the statutory tax rate to pre-TCJA levels, but also set overall corporate taxes higher than they were in 2017. As a result, we estimate the policy would raise $1.7 trillion over a decade under our central estimate. We estimate revenue of $1.9 trillion under our low-cost estimate and $1.5 trillion under our high-cost estimate using different sources for the estimate.86
| Subtotal, Buttigieg Additional Offsets | $1.9 trillion/$1.7 trillion/$1.5 trillion |
| Net Fiscal Impact, Buttigieg Health Plan | $1.4 trillion/$450 billion/-$350 billion |
Read the full PDF version.
Elizabeth Warren’s Plan to End the Stranglehold of Health Costs on U.S. Families
Senator Warren has proposed to offer universal, publicly-funded “Medicare for All” health and long-term care benefits to all U.S. residents with virtually no out-of-pocket costs while also increasing other spending. She would contain and offset the costs of adopting Medicare for All by reducing provider, drug, and administrative costs; requiring contributions from states and employers; and enacting a variety of tax increases and spending cuts.
On net, we estimate this plan would add an additional $6.1 trillion to deficits over a decade under our central estimate. It would reduce deficits by $1.2 trillion in our low-cost estimate and add $11.2 trillion to deficits in our high-cost estimate. Warren’s transition plan is not reflected in these estimates. Due to baseline and budget window differences, our estimates of specific policies are not directly comparable to the Warren campaign’s estimates – Appendix I offers a comparison.

Warren Coverage & Spending Proposals
Senator Warren has proposed replacing the current mix of public and private financing of health care with a Medicare for All single-payer system where the federal government finances virtually the full cost of health care and offers a new long-term care program. On top of these programs, she would ensure that all hospitals are paid at an average of 110 percent of Medicare rates, require states to contribute to the program in place of their current Medicaid spending, and increase rural health-related investments. We estimate these policies would have a gross cost of between $28.95 trillion and $33.25 trillion over a decade, with a central estimate of $31.75 trillion.
Methodological note: Though Warren has proposed a detailed transition plan, our analysis assumes her proposal is fully phased in by 2021. Our estimates largely based on (and adjusted from) estimates by Blumberg, Holahan, Buettgens, Gangopadhyaya, Garrett, Shartzer, Simpson, Wang, Favreault, and Arnos of the Urban Institute (Urban).87 Our low-, central, and high-cost estimates reflect a variety of different assumptions. Our high-cost estimates match Urban most closely, whereas our low-cost figures largely reflect estimated adjustments by Donald Berwick and Simon Johnson (Berwick & Johnson) provided by the campaign – though with some further downward adjustments and other differences.88 It is possible the cost of Medicare for All might fall outside of our range, as a number of analysts have estimated.89
| Enroll All U.S. Residents in “Medicare for All” | -$27.0 trillion/-$29.0 trillion/-$30.0 trillion |
Warren would replace the current system of public and private health insurance with a new government-run insurance program that would cover virtually all health care services without significant premiums, deductibles, copayments, coinsurance, or provider networks. All U.S. residents would be automatically enrolled in Medicare for All, which would cover ordinary medical care as well as dental, vision, hearing, and mental health services. We estimate this change in isolation would cost the federal government about $29 trillion over ten years under our central estimate. Most of this cost comes from eliminating premiums and cost sharing, meaning households will pay less as the government pays more. Our estimate represents a starting point, before proposed adjustments (analyzed in the following section). It assumes drug costs remain at current levels, provider payments are set to Medicare levels (significantly below payment rates offered by private insurance), and administrative costs total 4.5 percent.90 Our low-cost estimate of $27 trillion assumes administrative costs of 2.3 percent as Warren says she would set, whereas our high-cost estimate of $30 trillion relies on Urban’s assumption of 6.0 percent administrative costs. Our estimates also differ in their assumptions of increased utilization, which Berwick & Johnson argue are too high in Urban’s study.91
| Offer Universal Long-Term Care | -$4.0 trillion/-$4.5 trillion/-$5.0 trillion |
Under current law, many Americans lack access to long-term services and supports; those who do use long-term care facilities often pay out of pocket until they exhaust their assets, at which point Medicaid covers the cost. Warren’s Medicare for All plan would institute universal coverage for long-term services and supports. Consistent with the spirit of the Medicare for All Act (cosponsored by Warren), Urban assumes this would be achieved through the creation of a new home- and community-based long-term care system that pays up to $150 per day, while maintaining Medicaid support of institutional care. Based on discussions with authors of the Urban study, we find this would cost roughly $4.5 trillion over a decade. To account for possible differences in administrative costs, eligibility criteria, scope, reimbursement rates, and utilization, we assume $4 trillion in our low-cost estimate and $5 trillion in our high-cost estimate.92
| Increase Average Hospital Payments to 110% of Medicare | -$1.2 trillion |
Though our base cost estimate assumes that all provider payments would be set at Medicare levels, doing so would represent a steep reduction from current law and could leave many hospitals unable to remain in business. Warren proposes to alleviate this concern by paying hospitals at an average of 110 percent of current Medicare rates, with higher payments for primary care as well as rural and teaching hospitals and lower payments for hospitals with higher margins and “overpaid specialists.” Relative to the base estimate, this proposal would cost about $1.2 trillion over a decade.93 Importantly, it is possible hospitals would be unable to remain solvent at payments of only 110 percent of Medicare rates, which are significantly below what they currently charge in the private sector. Urban assumes payments at 115 percent of Medicare rates to keep hospitals solvent, which if implemented would cost an additional $600 billion above our estimate (Urban’s alternative scenario at 140 percent of Medicare would cost an additional $3.6 trillion).
| Require Medicaid “Maintenance of Effort” Payments | $3.4 trillion/$3.1 trillion/$3.1 trillion |
Because states pay for a substantial share of national health expenditures through Medicaid and the Children’s Health Insurance Program, enacting Medicare for All on its own would effectively represent a significant cost transfer to the federal government from the states. To reduce the federal costs associated with Medicare for All, Warren would require states to pay the federal government the same amount they otherwise would have paid for Medicaid and CHIP through a “Maintenance of Effort” payment. Based on the Urban study, we estimate this would reduce federal costs by $3.1 trillion over a decade in our central- and high-cost estimates. Our low-cost estimate of $3.4 trillion in savings is based on Berwick & Johnson. Importantly, there is some uncertainty about the constitutionality of such a requirement.94 Since this policy would simply maintain current state spending, and to maximize the comparability of our different estimates, we count these savings as part of the gross cost of coverage.
| Increase Rural Health-Related Investments | -$150 billion |
In addition to her plans for expanded coverage, Warren would increase investments in rural communities and the health workforce serving them. Specifically, she would reauthorize and boost funding for Community Health Centers (CHCs) by 15 percent per year over five years, implement a $25 billion capital fund for areas with health worker shortages, increase residencies for rural and underserved communities, and expand educational loan repayment plans for health workers. We estimate these proposals would cost roughly $150 billion over a decade – including roughly $40 billion to simply extend current funding for CHCs beyond May 2020.
| Subtotal, Warren Coverage & Spending Proposals | -$28.95 trillion/-$31.75 trillion/-$33.25 trillion |
Warren Cost Reduction
To limit the federal cost of Medicare for All and help contain economy-wide health care costs, Senator Warren would implement a series of reforms to reduce provider payments and prescription drug costs below Medicare levels. The campaign argues these and other policies would also reduce spending growth to the growth rate of the economy and proposes capping spending at that reduced growth rate. We estimate these measures would achieve $2 trillion to $6.1 trillion of savings over a decade, with our central estimate finding $4.7 trillion of savings.
Methodological note: Our low-cost estimate is based on the Berwick & Johnson estimates cited by the campaign, though reported figures differ due to different budget windows and measurement baselines used.95 Our central estimate represents our best projections of the proposals, and our high-cost estimate adjusts the costs based on the potential viability of the proposals.
| Reduce & Reform Provider Payments | $2.5 trillion/$2.5 trillion/$1.2 trillion |
Warren would adopt site-neutral payment reform so that medical services are reimbursed at the same rate whether offered in a hospital or physician’s office, reduce payment rates to post-acute care facilities, and expand the use of bundled payments that reimburse for an episode of care rather than per service provided.96 Most of these policies have been proposed on a bipartisan basis to reduce the cost of traditional Medicare. Warren would also increase antitrust enforcement for all providers, specifically hospital groups. These proposals would save a combined $2.5 trillion over a decade if implemented as proposed. However, the proposals may prove unachievable or unsustainable on top of the substantial cuts medical providers would already experience under Medicare for All. Our high-cost estimate assumes just over half the savings would be used to help meet those provider payment targets while the remaining $1.2 trillion would be used to further reduce the cost of the plan.
| Reduce Prescription Drug Costs | $2.5 trillion/$1.7 trillion/$800 billion |
Warren sets a goal of reducing name-brand prescription drug costs by 70 percent and generic drug costs by 30 percent below Medicare prices. She proposes achieving this goal primarily by allowing the government to negotiate lower drug prices in a manner similar to the Elijah E. Cummings Lower Drug Costs Now Act (H.R. 3). Warren’s proposal would be more aggressive because it would allow the government to negotiate prices for all drugs (H.R. 3 focuses on a finite set of drugs that don’t face competition), would cap prices at 110 percent of an international average price index (H.R. 3 caps them at 120 percent), and sets no floor on prices (H.R. 3 sets a floor at the lowest price in the index). She would enforce this negotiation and improve the government’s leverage through a large tax penalty for non-compliance and a process for compulsory licensing and/or public manufacturing as a backstop. She would also effectively cap drug price growth in excess of inflation. We estimate these specific policies – if used aggressively and implemented fully in year one – could reduce the price of name-brand drugs roughly by half.97 Assuming generic drug prices are reduced 30 percent, we find these proposals would shrink the cost of Medicare for All by $1.7 trillion over a decade in our central estimate.98 Our low-cost estimate, which assumes the full 70 percent price reduction target is met, finds $2.5 trillion of savings. Our high-cost estimate finds $800 billion of savings from the 25 to 30 percent reduction in Medicare drug prices assumed in the Urban study.
| Limit Health Care Cost Growth to Economic Growth | $1.1 trillion/$500 billion/$0 |
National health expenditures typically grow faster than the economy and have roughly doubled as a share of GDP over the past four decades. Warren argues that her plan would slow health care cost growth to the nominal rate of economic growth – reducing annual health care cost growth from above 5 percent under current law and 4.4 percent under our central estimate of her plan to about 3.9 percent per year. The campaign states that “if growth rates exceed this rate, [Warren] will use available policy tools, which include global budgets, population-based budgets, and automatic rate reductions, to bring it back into line.” We interpret this policy to mean that if health care spending growth exceeds 3.9 percent in a given year (adjusted for timing shifts), payments to providers would be cut for future years. In our central estimate, we find this enforcement mechanism would go into effect most years and save about $500 billion over a decade. Under our low-cost estimate, we assume growth would be successfully capped at 3.9 percent per year, resulting in $1.1 trillion of savings.99 Our high-cost estimate does not credit any savings from this cap due to both a lack of specificity and questions over its viability.
| Subtotal, Warren Cost Reduction | $6.1 trillion/$4.7 trillion/$2.0 trillion |
Warren Direct Offsets
A significant portion of the cost of Medicare for All would be financed by diverting and adjusting funds currently used to pay for private health insurance. Specifically, Senator Warren’s plan would effectively eliminate all tax breaks associated with private health insurance and would require private and public employers to make contributions to Medicare for All that resemble their current premium payments to insurers. We estimate these proposals would likely generate between $13.1 trillion and $15.3 trillion over a decade, with a central estimate of $14.2 trillion.
Methodological note: Estimates are based on Simon Johnson, Betsey Stevenson, and Mark Zandi (Johnson, Stevenson, & Zandi) and Berwick & Johnson, provided by the campaign, with which we largely concur.100
| Medicare for All Revenue Feedback | $1.5 trillion |
Because Americans would no longer pay premiums or face out-of-pocket costs, health-related tax breaks would become irrelevant. Income and payroll tax deductions for employee-paid premiums, Health Savings Accounts, and Flexible Spending Accounts would no longer reduce federal revenue; money previously used to pay for these items would be treated instead as taxable income. Income and payroll tax revenue raised from this change would generate about $1.5 trillion over a decade. Importantly, employer-paid premiums would be replaced with new contributions and would thus have little effect on taxable income.
| Require Private Employer Medicare Contributions | $8.9 trillion/$9.7 trillion/$10.6 trillion |
Though employers would no longer buy health insurance on behalf of their employees, Warren’s plan would assess an Employer Medicare Contribution on private-sector employers to ensure they continue contributing to health care financing. At first, these contributions would be set at 98 percent of average employer payments for health care over the past three years; over time, they would transition to a fixed per-employee cost that would grow with the cost of Medicare for All. Adjustments and exemptions would exist for small employers, part-time employees, merging firms, and firms that currently offer high-quality benefits. Ultimately, this contribution would serve as a “head tax,” or a fixed-dollar amount paid per employee. Though technically paid by employers, the tax – like current health insurance premiums – would ultimately be borne by employees in the form of reduced wages. This would raise $9.7 trillion, $8.9 trillion, and $10.6 trillion over a decade in our central, low-cost, and high-cost estimates, respectively.101
| Require State & Local Government Medicare Contributions | $2.7 trillion/$3.0 trillion/$3.2 trillion |
Currently, state and local governments generally compensate their employees with health benefits, just as private employers do. Under Warren’s plan, state and local governments would instead redirect these funds to the federal government. Functionally, this contribution would be very similar to the Employer Medicare Contribution, but Warren would administer this contribution like the Medicaid Maintenance of Effort requirement. This policy would raise about $3 trillion in revenue over a decade under our central estimate. It would raise $2.7 trillion under our low-cost estimate and $3.2 trillion under our high-cost estimate.102
| Subtotal, Warren Direct Offsets | $13.1 trillion/$14.2 trillion/$15.3 trillion |
Warren Additional Offsets
In addition to the direct offsets for Medicare for All, Senator Warren proposes a number of tax increases and spending cuts to offset the remaining costs. Specifically, her plan would increase taxes on financial institutions, wealthy investors and asset owners, and corporations. She would also improve tax compliance, reform immigration laws, and reduce defense spending on conflicts abroad. We estimate these proposals would likely save between $4.75 trillion and $10.95 trillion over a decade, with a central estimate of $6.75 trillion.
Methodological note: In general, our low-cost estimates are based on the Johnson, Stevenson, & Zandi estimates provided by the campaign.103 Our central and high-cost estimates come from a variety of credible sources and also reflect our own estimates – accounting as best we can for various interactions. Future estimates may change as Warren’s tax policies are modeled by other independent estimators.
| Establish New Financial Taxes | $1.0 trillion |
Warren proposes two new taxes on the financial sector. First, she would impose a 0.1 percent financial transactions tax on the sale of securities and any payments made under derivatives contracts in order to limit the influence and market distortion of high-frequency trading. Second, Warren would institute a fee on large financial institutions with assets greater than $50 billion in order to reduce risks associated with “too big to fail” banks. These policies would raise about $900 billion and $100 billion over a decade, respectively, or $1 trillion total.104
| Reduce the Tax Gap | $2.4 trillion/$300 billion/$100 billion |
More than 15 percent of owed taxes are never collected due to under-reporting of income, over-reporting of tax-preferred activity, underpayment of taxes, or nonfiling. Warren would aggressively boost enforcement of tax laws in order to reduce this tax gap. Specifically, she would increase funding for the Internal Revenue Service (IRS) for enforcement and auditing activities, require greater withholding and reporting from third parties, match foreign tax compliance reports to tax returns, simplify filing, redirect enforcement resources from lower earners to higher earners, give the IRS the resources it needs to audit nonfilers, strengthen international income reporting requirements, enforce cash income compliance with currency transaction reports, strengthen virtual- and crypto-currency reporting, and allow whistleblower protections for employees who disclose tax evasion. While there is not enough detail for us to estimate all of these policies, we assume they would generate $300 billion in revenue over a decade in our central estimate – which is the most we think could credibly be scored from measures to reduce the tax gap without fundamentally restructuring the tax system.105 In our high-cost estimate, we assume savings of $100 billion – in line with what could be assumed from available scores alone.106 Our low-cost estimate of $2.4 trillion reflects the campaign’s stated goal of a one-third reduction in the tax gap, as estimated by Johnson, Stevenson, & Zandi. In our view, there is little basis to support this $2.4 trillion estimate – though Natasha Sarin and Larry Summers recently put forward a proposal that they estimated could raise roughly $1 trillion over a decade.107
| Repeal Accelerated Depreciation | $1.3 trillion |
Under a proper income tax, companies would deduct the cost of investments over the course of their useful life (i.e. if a computer lasts for five years, a company would deduct one-fifth of its cost each year for five years) through a process known as depreciation.108 The current tax code allows most investments to be deducted faster through a process called accelerated depreciation. This provides a significant tax benefit to corporations and other businesses, allowing them to accelerate tax savings associated with investment and thus reducing the present value of taxes paid. Warren would instead move to economic depreciation, adopting a reform to pool and depreciate assets put forward by former Senate Finance Committee Chairman Max Baucus (D-MT) in 2013.109 Assuming all parts of the 2017 Tax Cuts and Jobs Act are first repealed, this proposal would raise about $1.3 trillion over a decade (relative to current law, it would likely raise about half of that). Importantly, much of this revenue represents a one-time shift in tax payments – in a steady state, this proposal would raise $850 billion to $950 billion over a decade.110
| Enact a 35% Global Minimum Tax | $1.7 trillion/$1.3 trillion/$800 billion |
Under current law, American multinational corporations generally pay taxes only in the country where they earn that money – though a variety of base erosion provisions create an effective minimum tax of 10 percent to 13 percent of global income (compared to the 21 percent domestic corporate rate). Warren would establish a country-by-country minimum tax of 35 percent. This would be on top of her proposal to reinstate the 35 percent corporate tax rate for U.S. corporations (up from 21 percent under current law).111 Under this tax, if a company paid a 25 percent tax to a specific foreign country, they would pay an additional 10 percent to the U.S. government. Warren would also impose an additional tax on foreign companies that sell a fraction of their goods in the U.S. Under our central estimate, these proposals would raise $1.3 trillion over a decade – the average of our low- and high-cost estimates. Our low-cost estimate of $1.7 trillion is based on figures provided by the campaign from economists Emmanuel Saez and Gabriel Zucman (Saez & Zucman).112 Our high-cost estimate of $800 billion is derived from Tax Policy Center’s estimates of a similar proposal put forward by the Economic Policy Institute.113
| Increase Taxes on Wealth & Accrued Capital Gains | $3.2 trillion/$1.5 trillion/$1.0 trillion |
Currently, capital gains and dividends are taxed at a preferential rate and only when gains are realized. For the top 1 percent of households, Warren would tax dividends and capital gains as ordinary income – increasing the top rate from 20 percent to 39.6 percent114 – and on a “mark-to-market” basis where increases in asset value are taxed annually even if gains are not realized.115 Additionally, Warren would impose an annual 3 percent wealth surtax on household assets over $1 billion. This would be on top of her previously proposed tax of 2 percent on wealth above $50 million and 3 percent above $1 billion, bringing the total top wealth tax rate to 6 percent. Combined with the mark-to-market system, most wealth above $1 billion would be taxed at an effective rate of between 7 and 10 percent per year.116 Under our central estimate, these proposals would raise about $1.5 trillion over a decade.117 Under our low-cost estimate, based on Johnson, Stevenson, & Zandi as well as Saez & Zucman, they would raise $3.2 trillion. Under our high-cost estimate, they would raise $1 trillion. The primary reason our central estimate is so much lower than the low-cost estimate is related to interactions between the wealth surtax, the initial wealth tax, mark-to-market taxation, and other taxes on capital income. In combination, these taxes would lead to high rates of avoidance while also eroding the wealth base they are taxing – leading to reduced revenue over time.118
| Modify Taxation of Acquisitions & Mergers | $150 billion |
Warren has said she would pay for her rural agenda, including her rural health investments, “by changing the tax laws that encourage companies to merge and reduce competition.”119 Through conversations with the campaign, we understand this would involve a package of recommendations that include repealing tax-free all-stock mergers, limiting the deductibility of interest on debt used for corporate reorganizations, making it more difficult for firms to spin off and re-merge for tax purposes, and taxing monopoly profits from industry consolidation.120 Although we are unable to score these specific provisions or determine how they might interact with other proposals, we believe they could be scaled to raise sufficient revenue to cover the health portion of Warren’s rural plan and thus assume $150 billion of revenue over a decade.
| Enact Comprehensive Immigration Reform | $400 billion |
As an additional offset for Medicare for All, Warren has proposed passing comprehensive immigration reform in a manner similar to the 2013 Senate-passed immigration bill. This includes providing a pathway to citizenship for many undocumented immigrants and expanding legal immigration as a whole. Doing so would increase the number of taxpayers and thus tax revenue collected. Johnson, Stevenson, & Zandi estimate this proposal would save about $400 billion over a decade on net; we find this estimate credible and assume it in our estimates.
| End Spending on Overseas Contingency Operations | $800 billion/$800 billion/$0 |
Warren would reduce military spending by ending all funding designated as Overseas Contingency Operations, which is mostly used to fund ongoing military operations in Afghanistan and Iraq. Warren would instead fund any necessary overseas military operations within the context of the base defense budget. We estimate this would save about $800 billion over a decade, which is similar to estimates from Johnson, Stevenson, & Zandi. Due to lack of specificity over how defense savings would be generated, we assume no savings in our high-cost estimate.
| Subtotal, Warren Additional Offsets | $10.95 trillion/$6.75 trillion/$4.75 trillion |
| Net Fiscal Impact, Warren Health Plan | $1.2 trillion/-$6.1 trillion/-$11.2 trillion |
Conclusion
Each of the four candidates we analyze here takes a different approach to health care reform, and their spending and financing choices would have significant implications for our fiscal future. Health care reform – depending on its exact details – could greatly improve or worsen the federal government’s unsustainable debt situation. It is important for the public to understand the fiscal implications of the proposals each candidate puts forward and to weigh those implications against other important factors.
Endnotes
1 See Committee for a Responsible Federal Budget, “American Health Care: Health Spending and the Federal Budget,” May 2018, https://www.crfb.org/papers/american-health-care-health-spending-and-federal-budget.
2 Notes on methodology: The basis of the estimate for each provision is discussed within the section the option is presented and, in more detail, in the endnotes.
To develop our estimates, we identified the universe of health-care-related policies proposed by the candidates based on their official campaign websites as of January 13, 2020. We narrowed those to policies that we believe would have a significant fiscal impact and grouped individual policy changes into broader recommendations. To understand the details of the proposals, we relied on campaign material when possible and also reached out to representatives of each campaign for clarification. Where detail on the campaign website or from campaign representatives was insufficient to understand the full parameters of the proposal, we supplemented the material on their websites with additional information from news articles, legislative proposals, and proposals by outside experts and think tanks – with stronger emphasis on proposals cited or linked to by the campaigns.
Once policy details (or possible details) were determined, we generated a low-cost, central, and high-cost estimate for each recommendation. These estimates cover the ten-year period from Fiscal Years 2021 through 2030, assuming that the policies are in full effect by the beginning of FY 2021. The estimates thus ignore the effects of any transition plan or any realistic assumptions over lags in implementation. Differences between our low-cost, central, and high-cost estimates may reflect uncertainty about the fiscal impact of a given policy (for example, if there are multiple estimates), the policy itself (for example, if there is insufficient detail or multiple possible interpretations), or both. In many cases, costs ended up being the same in our low, central, and high estimates or in two of the three estimates. All estimates are based on conventional scorekeeping – meaning they account for the behavioral effects of policies but not their impact on the broader economy. Once estimated, policies scored less than $1 trillion were rounded to the nearest $50 billion, and those scored above $1 trillion were rounded to the nearest $100 billion.
Our estimates themselves come from a variety of respected sources, with specific sources cited in the endnotes of each policy. When the campaigns provided their own estimates, we evaluated the validity of those estimates, and if we found them to be credible, we relied on them to generate either our low-cost or central estimate. For many policies, we relied on outside sources such as the Congressional Budget Office (CBO) or the Urban Institute. In many cases, we generated our own estimates using our own models or existing open-source models. All estimates were sent to the campaigns for review and feedback – though only some campaigns responded to our multiple requests.
Our estimates should be considered both rough and rounded. As more information becomes available and more policies are put forward, we intend to continue to update our estimates of the candidates’ plans.
3 For candidate websites, see: Joe Biden, Biden for President, https://joebiden.com/; Pete Buttigieg, Pete for America, https://peteforamerica.com/; Bernie Sanders, Bernie 2020, https://berniesanders.com/; and Elizabeth Warren, Warren for President, https://elizabethwarren.com/.
4 In this reference and all subsequent references, “Medicare for All” is used as the common term to refer to a universal, government-run, and single-payer health system that would replace most public and private health insurance and virtually eliminate premiums and out-of-pocket costs. Medicare for All actually has little resemblance to the current Medicare program and should not be confused with a policy that expands traditional Medicare to cover more people. Traditional Medicare has both premiums and cost sharing and allows beneficiaries to enroll in a private alternative or purchase supplemental insurance. Medicare for All has no premiums, cost sharing, or private alternative and also – unlike traditional Medicare – covers dental, vision, maternal, and additional health service. We use the term Medicare for All because of its use as a term of art in the health reform space and the public policy sphere generally.
5 In reality, fiscal year 2021 would start before the next presidential term begins, and it would be impossible to implement most of the policies proposed at any point in 2021. Indeed, many of the new spending and savings policies would take several years to put into effect and might need to be phased in after that. Some candidates have discussed specific transition plans for some parts of their agenda. Estimating the plans based on realistic start dates and proposed transitions, however, would require subjective judgements on our part and would make it difficult to compare the candidates’ plans on an apples-to-apples basis.
6 Our estimates focus on primary costs only, excluding changes to interest payments. We believe it is more appropriate to include debt service when estimating their entire agendas and incorporating proposed phase-ins. Depending on the timing of the policies, incorporating interest would increase the cost or savings associated with a plan by 13 percent to 15 percent over ten years.
7 For more information, see Kaiser Family Foundation, “Where Do the Democratic Candidates Stand on Health Reform?”, December 2019, https://www.kff.org/slideshow/where-do-the-democratic-candidates-stand-on-health-reform/; RAND Corporation, “The Future of U.S. Health Care: Replace or Revise the Affordable Care Act?”, https://www.rand.org/health-care/key-topics/health-policy/in-depth.html; Charles Blahous, “The Costs of a National Single-Payer Healthcare System,” Mercatus Center, July 2018, https://www.mercatus.org/publications/government-spending/costs-national-single-payer-healthcare-system; Matthew Fiedler, Henry J. Aaron, Loren Adler, Paul B. Ginsburg, and Christen L. Young, “Building on the ACA to Achieve Universal Coverage,” New England Journal of Medicine, May 2019, https://www.nejm.org/doi/full/10.1056/NEJMp1901532; Jodi L. Liu and Christine Eibner, “National Health Spending Estimates Under Medicare for All,” RAND Corporation, 2019, https://www.rand.org/pubs/research_reports/RR3106.html; and Committee for a Responsible Federal Budget, “Choices for Financing Medicare for All: A Preliminary Analysis,” October 2019, https://www.crfb.org/papers/choices-financing-medicare-all-preliminary-analysis.
8 See Linda J. Blumberg, John Holahan, and Michael Simpson, “Don’t Confuse Changes in Federal Health Spending with National Health Spending,” Urban Institute, October 2019, https://www.urban.org/urban-wire/dont-confuse-changes-federal-health-spending-national-health-spending.
9 These estimates are derived from the Urban Institute’s NHE estimates for a comprehensive single-payer plan with adjustments to reflect the details of the candidates’ plans, our own estimates, and a different budget window. Figures should be considered rough.
10 Biden’s and Buttigieg’s plans are far more difficult to estimate than Warren’s and Sanders’s plans because estimates require determining how changes to public policy will impact private sector health spending. Our low-cost, central, and high-cost estimates for these plans differ not only in assumed federal cost, but also in the assumed effect these costs would have on private spending. These estimates are meant to provide comparable orders of magnitude.
11 See Committee for a Responsible Federal Budget, “Choices for Financing Medicare for All: A Preliminary Analysis,” October 2019, https://www.crfb.org/papers/choices-financing-medicare-all-preliminary-analysis.
12 See Linda J. Blumberg, John Holahan, Matthew Buettgens, Anuj Gangopadhyaya, Bowen Garrett, Adele Shartzer, Michael Simpson, Robin Wang, Melissa M. Favreault, and Diane Arnos, “From Incremental to Comprehensive Health Insurance Reform: How Various Reform Options Compare on Coverage and Costs,” Urban Institute Health Policy Center, October 2019, https://www.urban.org/research/publication/incremental-comprehensive-health-reform-how-various-reform-options-compare-coverage-and-costs. Unless otherwise noted, high-cost estimates match numbers from this source; however, policies are measured over a different budget window (2021-2030 as opposed to 2020-2029), and costs and savings are split among different policies compared to the source estimates.
13 See Donald M. Berwick and Simon Johnson, Letter to Senator Elizabeth Warren, October 31, 2019, https://bit.ly/2ZVDf4N. Unless otherwise noted, low-cost estimates match numbers from this source; however, policies are measured over a different budget window (2021-2030 as opposed to 2020-2029), and costs and savings are split among different policies compared to the source estimates. Appendix I compares our numbers to theirs on an apples-to-apples basis.
14 See Committee for a Responsible Federal Budget, “How Much Will Medicare for All Cost?” February 2019, https://www.crfb.org/blogs/how-much-will-medicare-all-cost.
15 See Bernie Sanders, “How Does Bernie Pay for His Major Plans?”, https://berniesanders.com/issues/how-does-bernie-pay-his-major-plans/.
16 The campaign-cited Lancet study by Alison Galvani, Alyssa Parpia, Eric Foster, Burton Singer, and Meagan Fitzpatrick, which finds Medicare for All would reduce national health expenditures by $450 billion per year, has several serious methodological flaws. First, it excludes the expansion of long-term care benefits proposed under the Medicare for All Act – which we account for in a separate option. Second, it assumes eliminating all deductibles, copayments, and other cost sharing would have no impact on utilization of health care for those who currently have adequate insurance – this assumption is inconsistent with the theory and the empirical literature. Third, as health expert Adrianna McIntyre has pointed out, the study “suggests that universal coverage will decrease avoidable [emergency room] visits and admissions [whereas] the best relevant evidence we have (from Oregon's randomized Medicaid expansion) is that coverage actually increases use of the [emergency department], including for nonemergency care.” Additionally, the estimates assume extremely aggressive and likely inconsistent savings from lower fraud and administrative costs. They find health care costs will be reduced by 4 percent due to fraud reduction – a massive reduction that would likely mean more than halving all improper payments. They also assume 2.2 percent administrative costs – Urban has argued that administrative costs much below 6 percent “would be insufficient to carry out necessary tasks under a single-payer program.” If administrative costs could be set that low, they would leave the government little capacity for anti-fraud activities and thus would likely to result in much higher, rather than lower, levels of fraud. For more information, see Alison Galvani, Alyssa Parpia, Eric Foster, Burton Singer, and Meagan Fitzpatrick, “Improving the Prognosis of Health Care in the USA,” The Lancet, February 2020, https://doi.org/10.1016/S0140-6736(19)33019-3; Jonathan Gruber, Johanna Catherine Maclean, Bill J. Wright, Eric S. Wilkinson, and Kevin Volpp, “The Impact of Increased Cost-sharing on Utilization of Low Value Services: Evidence from the State of Oregon,” National Bureau of Economic Research, December 2016, https://www.nber.org/papers/w22875; Kaiser Family Foundation, “The Impact of Cost Sharing on Appropriate Utilization and Health Status: A Review of the Literature on Seniors,” November 2004, https://www.kff.org/medicare/the-impact-of-cost-sharing-on-appropriate/; Emmeett B. Keeler, “Effects of Cost Sharing on Use of Medical Services and Health,” RAND Corporation, 1992, https://www.rand.org/pubs/reprints/RP1114.html; RAND Corporation, “Determining the Effects of Cost-Sharing in Health Care,” https://www.rand.org/capabilities/solutions/determining-the-effects-of-cost-sharing-in-health-care.html; Hitoshi Shigeoka, “The Effect of Patient Cost Sharing on Utilization, Health, and Risk Protection,” National Bureau of Economic Research, December 2013, https://www.nber.org/papers/w19726; and Adrianna McIntyre, “The latest results from Oregon aren’t actually very counterintuitive,” The Incidental Economist, January 2014, https://theincidentaleconomist.com/wordpress/the-latest-results-from-oregon-arent-actually-very-counterintuitive/.
17 See Committee for a Responsible Federal Budget, “How Much Will Medicare for All Cost?” February 2019, https://www.crfb.org/blogs/how-much-will-medicare-all-cost; and Committee for a Responsible Federal Budget, “Analysis of the Sanders Single-Payer Offsets,” February 2016, https://www.crfb.org/blogs/analysis-sanders-single-payer-offsets/.
18 Note that our estimates are based on the Urban study, but assumptions differ from the Urban study in all three scenarios. Urban assumes hospital payment rates at 115 percent of Medicare rates, drug prices at 25 to 30 percent below current Medicare prices, and administrative costs of 6 percent. Our low-cost and central estimates assume all payments at Medicare rates, while our high-cost estimate assumes hospitals are paid at 115 percent of Medicare rates, per Urban, and that other providers are paid slightly above Medicare rates. Our low-cost estimates assumes administrative costs of 2.3 percent, while our central estimate assumes 4.5 percent and our high-cost estimate assumes 6 percent. Urban has argued that administrative costs much below 6 percent “would be insufficient to carry out necessary tasks under a single-payer program.” Insufficient administrative spending could also lead to higher rates of fraud and improper payments, reduced ability for the government to negotiate lower drug payments, and less success with payment reforms. All three of our estimates assume drug prices at current levels – reductions are estimated in a separate policy. Each option has different utilization rates. Expanding health coverage to more people and more services at virtually no cost to the user will lead people to utilize more health services; however, the magnitude of this effect is unknown. For our low-cost estimate, we assume utilization is about 2.5 percent lower than Urban estimates, which we believe is consistent with several other studies. Our high-cost estimate assumes utilization roughly 0.5 percent above Urban, as some have estimated utilization could increase by more.
19 Urban includes this cost within the overall estimate of Option #8 in its study. We separated it for comparison purposes, based on discussions with the authors of the study.
20 The constitutionality of Maintenance of Effort payments is unclear. Some analysts think such efforts could be viewed as “constitutionally coercive” by the Supreme Court, which ruled a similar provision in the Affordable Care Act – which threatened to reduce base Medicaid payments of states that did not adopt a Medicaid expansion – was unconstitutional. However, states are already required to pay a Maintenance of Effort under Medicaid Part D, and no similar challenge has been made to its constitutionality (see “State Contributions” section in Congressional Research Service, “Medicare Part D Prescription Drug Benefit,” https://crsreports.congress.gov/product/pdf/R/R40611).
21 Although Sanders’s campaign does not provide specifics on these policies, we assume they will be roughly equivalent to his Community Health Center and Primary Care Workforce Expansion Act of 2019, which we estimate would cost about $100 billion over the 2021-2030 period if extended over a decade.
22 Sanders has proposed three pieces of legislation reflecting these policies, including the Medicare Drug Price Negotiation Act, the Affordable and Safe Prescription Drug Importation Act, and the Prescription Drug Price Relief Act.
23 CBO estimates that reducing drug prices to 114 percent of an international price index would reduce the prices of the most expensive and uncompetitive drugs by 40 to 55 percent, implying a 47 to 61 percent reduction to get down to 100 percent of the international index. Assuming remaining drug prices would be cut by about one-third would lead to an average cut of roughly 50 percent. See CBO’s preliminary analysis of the drug price negotiation methods in H.R. 3, the Elijah E. Cummings Lower Drug Costs Now Act of 2019.
24 See Bernie Sanders, “How Does Bernie Pay for His Major Plans?”, Bernie 2020, https://berniesanders.com/issues/how-does-bernie-pay-his-major-plans/.
25 While taxing capital gains at death reduces this incentive, it does not eliminate it. Most scorekeepers and modelers estimate a semi-elasticity for capital gains of about 3 percent (implying a revenue-maximizing capital gains rate of about 30 percent). To generously account for the effects of taxing capital gains at death, we modeled this policy assuming a semi-elasticity of 1.75 percent (implying a revenue-maximizing capital gains rate above 50 percent). This implies an improvement in the elasticity nearly twice as large as assumed by Penn Wharton Budget Model (PWBM); in other words, our central estimate is generous. Our high-cost estimate assumes elasticities more similar to those assumed by PWBM. To read more about capital gains elasticities, see Congressional Research Service, “Capital Gains Tax Options: Behavioral Responses and Revenues,” April 2019, https://fas.org/sgp/crs/misc/R41364.pdf.
26 This estimate is derived by combining modeling using the Open Source Policy Center’s Tax-Brain, estimates of similar provisions in the Biden plan from Penn Wharton Budget Model, CBO estimates, and our own calculations. See See Open Source Policy Center, Tax-Brain, https://www.ospc.org/taxbrain/; Penn Wharton Budget Model, “The Biden Tax Plan: Budgetary, Distributional, and Economic Effects,” January 2020, https://budgetmodel.wharton.upenn.edu/issues/2020/1/23/the-biden-tax-plan; and Congressional Budget Office, “Tax Gains from Derivatives as Ordinary Income on a Mark-to-Market Basis,” December 2018, https://www.cbo.gov/budget-options/2018/54824.
27 Penn Wharton Budget Model estimates that the reforms proposed in the For the 98% Act would raise $267 billion over the 2021-2030 budget window. See Penn Wharton Budget Model, “Senator Bernie Sanders’ Estate Tax: Budgetary Effects,” January 2020, https://budgetmodel.wharton.upenn.edu/issues/2020/1/23/sanders-estate-tax.
28 Sanders’s entire Corporate Accountability and Democracy plan is wide-ranging and includes sweeping changes to corporate governance and regulation; however, for our estimation purposes, we only looked at the corporate tax reform aspect of this plan. We do not make any qualitative or quantitative judgements on the effects of the other aspects of this plan. For more information, see Bernie Sanders, “Corporate Accountability and Democracy,” Bernie 2020, https://berniesanders.com/issues/corporate-accountability-and-democracy/.
29 See estimates of a similar policy proposed by the Economic Policy Institute and estimated by the Tax Policy Center: Economic Policy Institute, “Detailed estimates for policies in EPI’s ‘Budget for Shared Prosperity’,” July 2019, https://www.epi.org/blog/detailed-estimates-for-policies-in-epis-budget-for-shared-prosperity/. See also Erica York, “Analysis of Democratic Presidential Candidates Corporate Income Tax Proposals,” Tax Foundation, February 2020, https://taxfoundation.org/2020-corporate-tax-proposals/#5.
30 Specifically, Sanders would tax the wealth of married couples from $32 million to $50 million at 1 percent, from $50 million to $250 million at 2 percent, from $250 million to $500 million at 3 percent, from $500 million to $1 billion at 4 percent, from $1 billion to $2.5 billion at 5 percent, from $2.5 billion to $5 billion at 6 percent, from $5 billion to $10 billion at 7 percent, and 8 percent for all wealth over $10 billion. These thresholds are half as large for single people.
31 See Emmanuel Saez and Gabriel Zucman, Public Letter, September 22, 2019, https://gabriel-zucman.eu/files/saez-zucman-wealthtax-sanders-online.pdf.
32 There are three main reasons we believe Sanders’s wealth tax will raise substantially less than estimated by Saez & Zucman. First, the high effective tax rates will lead to high rates of legal and illegal avoidance, including through donation, distribution, and consumption of wealth. Saez & Zucman estimate 15 percent avoidance, but that figure is based on an 8 percent elasticity and thus would only apply to a 2 percent wealth tax (see Max Ghenis, “Warren’s wealth tax would raise less than she claims – even using her economists’ own assumptions,” November 8, 2019, https://medium.com/@MaxGhenis/warrens-wealth-tax-would-raise-less-than-she-claims-even-using-her-economists-own-assumptions-bea43840bc0a). Assuming this elasticity, we should assume 8 percent avoidance on wealth from $32 million to $50 million, 15 percent up to $250 million, 21 percent up to $500 million, 27 percent up to $1 billion, 33 percent up to $2.5 billion, 38 percent up to $5 billion, 43 percent up to $10 billion, and 47 percent above $10 billion. (Though 47 percent seems high, it is worth noting that roughly half of individuals with net worth above $10 billion have taken the “Giving Pledge” to donate half or more – and in many cases almost all – of their wealth to charity.) This factor alone would greatly reduce the revenue raised. In addition to high levels of avoidance, significant wealth taxation would have the intended effect of reducing wealth and thus reducing the base of taxation. For example, Saez & Zucman estimate the 15 wealthiest individuals would be worth $196 billion today if the Sanders wealth tax had been in effect since 1982 – only a fifth of the $943 billion they are currently worth. Bill Gates would only be worth $10 billion as opposed to $97 billion. This reduction in wealth means less would be available to tax and thus would reduce revenue collection over time. Finally, Sanders’s proposals to dramatically increase taxes on earned income, capital gains, dividends, and estates would all have the effect of reducing wealth among multi-millionaires and billionaires – thus further shrinking the tax base. In addition to those three reasons, some research suggests the Saez & Zucman figures substantially overstate the amount of wealth held by billionaires and/or understate the appropriate elasticity, though our figures assume their estimates are accurate in our central estimate. Our estimates also ignore dynamic effects, which are likely to further reduce revenue collection. There are also potential constitutional issues with a wealth tax that we set aside for purposes of our analysis.
33 Penn Wharton Budget Model has estimated that Sanders’s wealth tax would raise $3.35 trillion on a conventional basis and $2.8 trillion on a dynamic basis, while Huaqun Li and Karl Smith of the Tax Foundation have estimated it would raise $3.26 trillion on a conventional basis and $2.55 trillion on a dynamic basis. Additionally, Max Ghenis of The UBI Center estimates Sanders’s wealth tax would raise $3 trillion using proper elasticity treatment and CBO growth projections. See Penn Wharton Budget Model, “Senator Bernie Sanders’ Wealth Tax: Budgetary and Economic Effects,” January 2020, https://budgetmodel.wharton.upenn.edu/issues/2020/1/23/sanders-wealth-tax; Huagun Li and Karl Smith, “Analysis of Sen. Warren and Sen. Sanders’ Wealth Tax Plans,” January 2020, https://taxfoundation.org/wealth-tax/; and Max Ghenis, “Warren’s wealth tax would raise less than she claims — even using her economists’ own assumptions,” December 2019, https://medium.com/@MaxGhenis/warrens-wealth-tax-would-raise-less-than-she-claims-even-using-her-economists-own-assumptions-bea43840bc0a.
34 For more information, see Bernie Sanders, “The Sanders Income Inequality Tax Plan,” Bernie 2020, https://berniesanders.com/issues/income-inequality-tax-plan/.
35 Actuarial value of 70 percent means that, on average, 70 percent of covered health costs would be paid by the insurer (financed with premiums) and 30 percent would be paid through deductibles, copayments, and coinsurance.
36 Those earning less than 400 percent of the Federal Poverty Level (FPL) are generally eligible for premium subsidies if they buy insurance on the insurance exchanges. Subsidies are calculated based on income and family size but do not generally vary based on the insurance package someone buys. Instead, subsidies are set based on the second-lowest available silver plan – offering buyers a large enough subsidy to limit the cost of that plan to anywhere from 2.06 to 9.78 percent of income. So for example, a family of four making $40,000 (about 150 percent of the FPL) would benefit from a cap of roughly 4 percent of income. If the second-lowest silver plan in their market cost $20,000, their subsidy would total $18,400 – allowing them to purchase a silver plan for $1,600 (4 percent of income). They could also choose to buy a cheaper ‘bronze” plan and use their subsidy to further reduce or eliminate costs, or for an additional price, they could purchase a gold or platinum plan (if a such a plan cost $30,000, the family would pay $11,600 – the cost of the plan minus the $18,400 subsidy). No subsidy is available for those making above 400 percent of the FPL or for those who would be able to buy the second-lowest silver plan for below the cap on their percentage of income.
37 States that have already expanded coverage could also transfer Medicaid beneficiaries to the public option with a “Maintenance of Effort” payment.
38 See Linda J. Blumberg, John Holahan, Matthew Buettgens, and Stephen Zuckerman, “The Healthy America Program, An Update and Additional Options,” Urban Institute, September 2019, https://www.urban.org/research/publication/healthy-america-program-update-and-additional-options.
39 See Ibid. Variation #2 of the Healthy America Program would cost the federal government about $141 billion in 2020 and roughly $1.5 trillion through 2029. To get $1.7 trillion, we removed the costs and savings associated with covering Medicaid acute care enrollees under the public option, removed Medicare Part D drug savings (counted elsewhere), and adjusted to the 2021-2030 budget window. Figures do not include income tax offsets, which are counted as part of “revenue feedback” later in the analysis.
40 The Biden campaign has estimated its core health care plan would cost $750 billion over ten years. Accounting for drug and health savings and revenue feedback, we estimate a net cost of $900 billion under our central estimate, savings of $550 billion under our low-cost estimate, and $1.2 trillion under our high-cost estimate – meaning the campaign’s numbers (if we understand them correctly) fall between our low and central estimates. See Appendix I for more discussion.
41 S. 1443/H.R. 2730, the Credit for Caring Act, would offer a 30 percent credit, up to $3,000, on direct caregiving costs that exceed $2,000 in a taxable year.
42 See Melissa M. Favreault and Brenda C. Spillman, “Tax Credits for Caregivers' Out-of-Pocket Expenses and Respite Care Benefits: Design Considerations and Cost and Distributional Analyses,” Urban Institute, January 2018, https://www.urban.org/research/publication/tax-credits-caregivers-out-pocket-expenses-and-respite-care-benefits-design-considerations-and-cost-and-distributional-analyses.
43 The Biden campaign does not specify how it would make existing tax benefits for long-term care insurance more generous. For purposes of scoring this provision, we assume the cost is similar to that of a Bush-era proposal to move the long-term care insurance deduction from itemized to “above the line,” which would remove it from income before the standard or itemized deductions.
44 H.R. 2957, the Save Rural Hospitals Act, would also eliminate Medicare sequestration for rural hospitals, reverse cuts to the reimbursement of bad debt for Critical Access Hospitals (CAHs) and rural hospitals, extend payment levels for low-volume hospitals and Medicare Dependent Hospitals (MDHs), reinstate revised diagnosis-related group payments for MDHs and Sole Community Hospitals (SCHs), reinstate hold harmless treatment for hospital outpatient services for SCHs, delay application of penalties for failure to be a meaningful electronic health record user, make permanent increased Medicare payments for ground ambulance services in rural areas, extend Medicaid primary care payments, equalize beneficiary copayments for services furnished by CAHs, establish a “Community Outpatient Hospital” program, enhance grant funding for rural hospitals, and enact regulatory reforms. Although Biden does not say specifically which provisions he would seek to enact as part of his plan, we assume all of them would be enacted.
45 Under Medicare Part D, seniors purchase privately-run but publicly-funded prescription drug insurance, and each insurance company negotiates its own rates with drug companies. In theory, allowing the Medicare program (or the Secretary of Health and Human Services) to negotiate on behalf of all Part D insurance companies, as well as the new public option, could push down prices by taking advantage of the large monopsony market power the government would have. However, without any ability to restrict what drugs are covered or to regulate prices, the federal government would have little leverage and thus savings would be modest. See Committee for a Responsible Federal Budget, “Could Negotiating Medicare Drug Prices Save $300 Billion Per Year?” March 2016, https://www.crfb.org/blogs/negotiating-medicare-drug-prices-could-save-300-billion-year.
46 In the case of no available international reference price – which would be common for new drugs first introduced in the U.S. – we assume prices would be similar to the average manufacturer price (AMP) provision in H.R. 3, the Elijah E. Cummings Lower Drug Costs Now Act of 2019, which would limit prices to 85 percent of the AMP.
47 This estimate is largely based on CBO’s preliminary analysis of the drug price negotiation methods in H.R. 3, the Elijah E. Cummings Lower Drug Costs Now Act of 2019. The range reflects a number of factors, but most significantly where the reasonable price is set relative to the external reference price (under H.R. 3, it is capped at 120 percent of the average price with a floor at the lowest price in any country).
48 Savings estimates for many of these policies are featured in the health section of our Budget Offsets Bank. Note that savings estimates will differ somewhat from those in Biden’s plan due to interactions.
49 CBO scored one plan to ban surprise medical billing – H.R. 2328, the Reauthorizing and Extending America’s Community Health Act – as saving $21 billion from 2020 to 2029. Depending on the details, actual savings could be somewhat lower or somewhat higher. Absent more specifics, we expect Biden’s other proposals to generate modest additional savings for the federal government.
50 Blumberg, Holahan, Buettgens, and Zuckerman estimate Variation #2 of the Healthy America Program would raise about $16 billion from the income tax exclusion in 2020. We adjusted these figures to account for payroll taxes and other tax preferences, partially offset by reduced revenue from the lack of an employer mandate and higher Social Security benefits associated with higher wages. We then extrapolated it over the 2021-2030 period.
51 S. 73, the End Taxpayer Subsidies for Drug Ads Act, would prohibit tax deductions for expenses relating to “Direct-to-Consumer” (DTC) advertising of prescription drugs. DTC advertising refers to any dissemination, by or on behalf of a sponsor of a prescription drug product, of an advertisement that is in regards to the drug product and primarily targeted to the general public.
52 See Jennifer Epstein, “Biden to Target Tax-Avoiding Companies Like Amazon with Minimum Federal Levy,” Bloomberg News, December 4, 2019, https://www.bloomberg.com/news/articles/2019-12-04/biden-to-target-tax-avoiding-companies-with-minimum-federal-levy.
53 Because this provision is likely to raise over $25 billion, we have rounded to $50 billion in keeping with our rounding conventions.
54 See Jennifer Epstein, “Biden to Target Tax-Avoiding Companies Like Amazon with Minimum Federal Levy,” Bloomberg News, December 4, 2019, https://www.bloomberg.com/news/articles/2019-12-04/biden-to-target-tax-avoiding-companies-with-minimum-federal-levy.
55 See Open Source Policy Center, Tax-Brain, https://www.ospc.org/taxbrain/.
56 We generated this estimate using Tax-Brain. It is roughly in line with the Biden campaign’s estimate of $90 billion.
57 Both under current law and under Biden’s proposal, capital gains would be subject to the additional 3.8 percent Net Investment Income Tax, increasing the current effective top rate to 23.8 percent and the top rate under Biden’s proposal to 43.4 percent.
58 Though not specified on the campaign’s website, we assume qualified dividends would also be taxed as ordinary income for those earning over $1 million and that the $1 million threshold is the same for couples and individuals. We assume the proposal to tax capital gains at death is similar to the proposal put forward in President Obama’s FY 2017 budget, which included a $100,000 exemption along with special rules for real estate and other non-financial assets. See “General Explanations of the Administration’s Fiscal Year 2017 Revenue Proposals,” U.S. Treasury, February 2016, https://www.treasury.gov/resource-center/tax-policy/Documents/General-Explanations-FY2017.pdf#page=166.
59 This estimate was generated largely with Tax-Brain, using off-model estimates for capital gains at death. While our estimate for taxing capital gains at death is similar to the Biden campaign’s, we find that taxing capital gains as ordinary income will raise less than $200 billion – compared to the campaign’s estimate of $800 billion. The capital gains rate increases raise significantly less than a static estimate would imply largely due to behavioral responses; when the capital gains rate goes up, investors hold onto their assets longer to avoid taxation. While taxing capital gains at death reduces this incentive, it does not eliminate it. Most scorekeepers and modelers estimate a semi-elasticity for capital gains of about 3 percent (implying a revenue-maximizing capital gains rate of about 30 percent). To generously account for the effects of taxing capital gains at death, we modeled this policy assuming a semi-elasticity of 1.75 percent (implying a revenue-maximizing capital gains rate above 50 percent). This implies an improvement in the elasticity nearly twice as large as assumed by the Penn Wharton Budget Model (PWBM) – in other words, our central estimate is generous. Our high-cost estimate assumes elasticities more similar to those assumed by PWBM. To read more about capital gains elasticities, see Congressional Research Service, “Capital Gains Tax Options: Behavioral Responses and Revenues,” April 2019, https://fas.org/sgp/crs/misc/R41364.pdf.
60 The campaign estimates $800 billion of revenue from taxing capital gains as ordinary income and $440 billion from ending stepped-up basis at death.
61 Actuarial value of 70 percent means that, on average, 70 percent of covered health costs would be paid by the insurer (financed with premiums) and 30 percent would be paid through deductibles, copayments, and coinsurance.
62 Current subsidies are designed to limit the second-lowest cost silver plan’s premium to between 2.06 and 9.78 percent of income for people making between 100 and 400 percent of the poverty level in 2020. The same amount of subsidy is available for any eligible plan, meaning that a person could purchase a cheaper plan for less than that share of income or a more expensive plan for a higher share of income. The percent of income limit generally increases as income rises, and people making more than 400 percent of the poverty level are ineligible for any subsidy.
63 The ACA requires insurers to offer reduced cost sharing (lower deductibles and copayments) for low-income enrollees in silver plans on the individual exchange. Initially, the federal government funded this cost directly; while this was the intent of the law, there is some ambiguity as to whether it is technically allowed under the law as written. In 2017, the Trump Administration discontinued these payments; as a result, insurance companies have continued to offer reduced cost sharing but now fund the cost through higher premiums at the silver tier (which are subsidized by the federal government). Funding cost sharing reductions would thus have little effect on cost sharing but would reduce premiums and government subsidies. Expanding cost-sharing reductions would further reduce deductibles and copayments for those already eligible for them and/or expand the number of people who would get them.
64 Buttigieg specifically mentions the rules related to Association Health Plans (AHPs) and short-term limited duration (STLD) insurance. These rules allow AHPs to offer less generous benefits than the ACA requires and expand STLD insurance so that people can hold it for longer. Reversing these rules would cause generally more healthy people to enroll in exchange plans, consequently lowering exchange plan premiums and subsidies (though these plans would generally have higher premiums than the short-term plans). CBO has estimated that reversing the STLD rule alone would reduce deficits by $9 billion over ten years.
65 For more discussion on this retroactive enrollment, which many have described as a stronger version of the individual mandate, see Jeff Stein and Chelsea Janes, “Buttigieg health plan hinges on ‘supercharged’ version of unpopular Obamacare mandate,” The Washington Post, December 24, 2019, https://www.washingtonpost.com/business/economy/buttigieg-health-plan-hinges-on-supercharged-version-of-unpopular-obamacare-mandate/2019/12/24/415ae876-21bb-11ea-9146-6c3a3ab1be6c_story.html.
66 See Linda J. Blumberg, John Holahan, Matthew Buettgens, Anuj Gangopadhyaya, Bowen Garrett, Adele Shartzer, Michael Simpson, Robin Wang, Melissa M. Favreault, and Diane Arnos, “From Incremental to Comprehensive Health Reform: How Various Reform Options Compare on Coverage and Costs,” Urban Institute, October 2019, https://www.urban.org/research/publication/incremental-comprehensive-health-reform-how-various-reform-options-compare-coverage-and-costs.
67 See Pete for America, “Medicare for All Who Want It,” https://peteforamerica.com/policies/health-care/.
68 See Pete for America, “Dignity & Security in Retirement,” https://peteforamerica.com/policies/dignity/.
69 Long-Term Care America was estimated based on Melissa M. Favreault and Richard W. Johnson, “Microsimulation Analysis of Financing Options for Long-Term Services and Supports,” Urban Institute, November 2015, https://www.thescanfoundation.org/sites/default/files/nov_20_revised_final_microsimulation_analysis_of_ltss_report.pdf. Significant adjustments were made to assume the plan was fully phased in, universal, and offering the benefit level proposed by the campaign.
70 The remaining parts of Buttigieg’s long-term care plan were estimated based on data or estimates from CBO, the Congressional Research Service, the Centers for Medicare and Medicaid Services, the Department of Health and Human Services, and the Census Bureau.
71 The Buttigieg campaign has estimated its rural plan would cost $50 billion over a decade (our estimates are similar) and its mental health and opioid plans would cost a combined $300 billion over a decade (see Jacob M. Schlesinger and John McCormick, “Buttigieg, Billed as Moderate, Touts Progressive Economic Plan,” The Wall Street Journal, December 13, 2019, https://www.wsj.com/articles/buttigieg-billed-as-moderate-touts-progressive-economic-plan-11576233001). Based on discussions with the campaigns and estimates of component parts, we believe $200 billion of that cost would be designated for mental health services.
72 See Tara O’Neill Hayes, “Comments on the Part D Reform Discussion Draft,” American Action Forum, June 2019, https://www.americanactionforum.org/comments-for-record/comments-on-the-part-d-reform-discussion-draft/.
73 Note that Medicare Part D's Low-Income Subsidy program already limits generic copays to only a few dollars, and state Medicaid programs charge little or no copays for generic drugs, limiting the additional cost of these proposal.
74 Our estimates of the Medicare Part A/B cap are based on: Bowen Garrett, Anuj Gangopadhyaya, Adele Shartzer, and Diane Arnos, “A Unified Cost-Sharing Design for Medicare: Effects on Beneficiary and Program Spending,” Urban Institute, July 2019, https://www.urban.org/research/publication/unified-cost-sharing-design-medicare-effects-beneficiary-and-program-spending; Congressional Budget Office, “Options for Reducing the Deficit: 2019 to 2028,” December 2018, https://www.cbo.gov/budget-options/2018/54731; Medicare Payment Advisory Commission, “June 2018 Data Book, Section 3: Medicare beneficiary and other payer financial liability,” June 2018, https://www.medpac.gov/docs/default-source/data-book/jun18_databooksec3_sec.pdf?sfvrsn=0; and Centers for Medicare and Medicaid Services, “Medicare Cost Sharing,” 2013, https://www.cms.gov/Research-Statistics-Data-and-Systems/Statistics-Trends-and-Reports/MedicareMedicaidStatSupp/Medicare-and-Medicaid-Statistical-Supplement-Items/2013CostSharing. We assume a cap of $8,150 in our low-cost estimate, consistent with the out-of-pocket maximum currently allowed for those under 65. We assume a cap of $6,700 in our central estimate, consistent with the current allowable maximum under Medicare Advantage. In both cases, we assume additional support for low-income seniors is designed in a budget-neutral manner. Our high cost estimate assumes a cap of $5,000 – which is closer to the cap we would expect under the public option – and an expansion of low-income-subsidies (LIS) similar to what was proposed in H.R. 3. Other policies are estimated from a variety of sources, including CBO estimates and Kaiser Family Foundation data on Medicaid generic co-pays and prescriptions.
75 See Congressional Budget Office, “Effects of Drug Price Negotiation Stemming From Title 1 of H.R. 3, the Lower Drug Costs Now Act of 2019, on Spending and Revenues Related to Part D of Medicare,” October 2019, https://www.cbo.gov/publication/55722, and Congressional Budget Office, “H.R. 3, Elijah E. Cummings Lower Drug Costs Now Act,” December 2019, https://www.cbo.gov/publication/55936.
76 Pay-for-delay agreements involve name-brand drug manufacturers paying generic drug manufacturers to delay entry. The REMS loophole involves name-brand manufacturers using drug safety procedures to unnecessarily deny generic manufacturers getting samples of a drug. Meritless citizen petitions are when name-brand manufacturers file petitions with the Food and Drug Administration to delay generic entry. Product hopping involves name-brand manufacturers slightly changing a product to secure a new patent period and delay generic entry.
77 Estimates for the inflation cap are based on Congressional Budget Office, “H.R. 3, Elijah E. Cummings Lower Drug Costs Now Act,” December 2019, https://www.cbo.gov/publication/55936. Additional policies can largely be found in our Budget Offsets Bank. Note that this inflation cap saves less than the cap proposed by Biden, whereas the negotiation and regulation of initial prices saves more. As we interpret the policies, Buttigieg would use regulation and negotiation to reduce the price of new and existing drugs whereas Biden would mainly focus on new drugs (existing drugs could be negotiated, but with limited leverage on the part of the government). Because inflation cap savings come largely from existing drugs (prices for new drugs would be set after accounting for the cap to the extent they can), reductions in their initial prices would substantially reduce the savings associated with an inflation cap.
78 See Jacob M. Schlesinger and John McCormick, “Buttigieg, Billed as Moderate, Touts Progressive Economic Plan,” The Wall Street Journal, December 13, 2019, https://www.wsj.com/articles/buttigieg-billed-as-moderate-touts-progressive-economic-plan-11576233001; and Pete for America, “Expenditures and Pay-Fors,” https://www.chalkbeat.org/wp-content/uploads/2019/12/UPDATED_-Expenditures-and-pay-fors-Dec-7-1.pdf.
79 The campaign’s estimates for these policies come from the following sources: “Putting America’s Health First: FY 2020 President’s Budget for HHS,” U.S. Department of Health and Human Services, March 2019, https://www.hhs.gov/sites/default/files/fy-2020-budget-in-brief.pdf; Congressional Budget Office, “An Analysis of the President’s 2017 Budget,” March 2016, https://www.cbo.gov/sites/default/files/114th-congress-2015-2016/reports/51383-apbonecol.pdf; William H. Shrank, Teresa L. Rogstad, and Natasha Parekh, “Waste in the US Health Care System: Estimated Costs and Potential for Savings,” Journal of the American Medical Association, October 2019, https://jamanetwork.com/journals/jama/article-abstract/2752664; and “Fiscal Year 2016 Budget in Brief: Strengthening Health and Opportunity for All Americans,” U.S. Department of Health and Human Services, February 2015, https://www.hhs.gov/sites/default/files/budget/fy2016/fy-2016-budget-in-brief.pdf.
80 Our central estimate for these policies comes from the following sources: Congressional Budget Office, “Proposals Affecting Medicare—CBO’s Estimate of the President’s Fiscal Year 2020 Budget,” May 2019, https://www.cbo.gov/system/files/2019-05/55210-medicare.pdf; Congressional Budget Office, “Proposals for Health Care Programs—CBO’s Estimate of the President’s Fiscal Year 2017 Budget,” March 2016, https://www.cbo.gov/publication/51431; and Committee for a Responsible Federal Budget, “Budget Offsets Bank,” https://www.crfb.org/offsets.
81 CBO has estimated that banning surprise billing alone would save roughly $25 billion over a decade under some designs. See Congressional Budget Office, “S. 1895, Lower Health Care Costs Act,” July 2019, https://www.cbo.gov/publication/55457.
82 See Elizabeth Wikler, Peter Basch, and David Cutler, “Paper Cuts: Reducing Health Care Administrative Costs,” Center for American Progress, June 2012, https://cdn.americanprogress.org/wp-content/uploads/issues/2012/06/pdf/papercuts_final.pdf.
83 See Jared Lane Maeda and Lyle Nelson, “An Analysis of Private-Sector Prices for Hospital Admissions: Working Paper 2017-02,” Congressional Budget Office, April 2017, https://www.cbo.gov/publication/52567, and Daria Pelech, “An Analysis of Private-Sector Prices for Physicians’ Services: Working Paper 2018-01,” Congressional Budget Office, January 2018, https://www.cbo.gov/publication/53441.
84 This estimate is based on rules of thumb provided by Ben Ritz of the Progressive Policy Institute and our own analysis of potential changes to average payment rates using data from the CBO working papers cited above.
85 Urban Option #5 would raise $189 billion in income tax revenue from 2020 to 2029. We adjusted these figures to account for payroll taxes and other tax preferences. We then extrapolated them over the 2021-2030 period. While our low-cost, central, and high-cost estimates differ slightly, they all round to $400 billion.
86 These estimates are all of the same policy, based on (and adjusted from): Congressional Budget Office, “Options for Reducing the Deficit: 2019 to 2028,” December 2018, https://www.cbo.gov/budget-options/2018/54810; Economic Policy Institute, “Detailed estimates for policies in EPI’s ‘Budget for Shared Prosperity’,” July 2019, https://www.epi.org/blog/detailed-estimates-for-policies-in-epis-budget-for-shared-prosperity/; Penn Wharton Budget Model, “Model Estimates,” April 2019, https://budgetmodel.wharton.upenn.edu/model-estimates; and Senate Democrats, “Senate Democrats’ Jobs & Infrastructure Plan for America’s Workers: Returning the Republican Tax Giveaway for the Wealthy to the American People,” March 2018, https://www.democrats.senate.gov/imo/media/doc/Senate%20Democrats'%20Jobs%20and%20Infrastructure%20Plan.pdf.
87 See Linda J. Blumberg, John Holahan, Matthew Buettgens, Anuj Gangopadhyaya, Bowen Garrett, Adele Shartzer, Michael Simpson, Robin Wang, Melissa M. Favreault, and Diane Arnos, “From Incremental to Comprehensive Health Insurance Reform: How Various Reform Options Compare on Coverage and Costs,” Urban Institute Health Policy Center, October 2019, https://www.urban.org/research/publication/incremental-comprehensive-health-reform-how-various-reform-options-compare-coverage-and-costs. Unless otherwise noted, high-cost estimates match numbers from this source; however, policies are measured over a different budget window (2021-2030 as opposed to 2020-2029), and costs and savings are split among different policies compared to the source estimates.
88 See Donald M. Berwick and Simon Johnson, Letter to Senator Elizabeth Warren, October 31, 2019, https://bit.ly/2ZVDf4N. Unless otherwise noted, low-cost estimates match numbers from this source; however, policies are measured over a different budget window (2021-2030 as opposed to 2020-2029), and costs and savings are split among different policies compared to the source estimates. Appendix I compares our numbers to theirs on an apples-to-apples basis.
89 See Committee for a Responsible Federal Budget, “How Much Will Medicare for All Cost?” February 2019, https://www.crfb.org/blogs/how-much-will-medicare-all-cost.
90 Our 4.5 percent figure represents the average administrative cost percentage of all estimates of Medicare for All or single-payer health care of which we are aware. Importantly, Warren proposes capping net administrative costs at only 2.3 percent – a figure in line with fee-for-service Medicare costs. While Berwick & Johnson argue these estimates are reasonable and in line with international comparisons, Urban has argued that administrative costs much below 6 percent “would be insufficient to carry out necessary tasks under a single-payer program” and that “because a single-payer approach exposes the federal budget to greater financial risks than other reforms, processes to prevent fraud and abuse and programs to manage care and monitor quality and access under centralized provider rates will be even more important than they are today.” Setting administrative costs at 2.3 percent might therefore be inconsistent with achieving other parts of Warren’s plan or could result in significantly higher costs and less in per-capita savings due to higher rates of fraud and improper payments, reduced ability for the government to negotiate lower drug payments, and less success around payment reforms. We therefore set administrative costs at 2.3 percent in our low-cost estimate only (assuming no effect on non-administrative costs), at 4.5 percent in our central estimate, and at Urban’s 6 percent in our high-cost estimate. Our central estimate of 4.5 percent administrative costs is roughly equal to holding administrative costs at 2.3 percent as Warren proposed and, as a result, experiencing a 2 to 2.5 percent increase in costs due to improper and fraudulent payments, greater overutilization of wasteful care, and reduced ability for the government to implement price reductions and payment reforms. Assuming administrative spending is focused first and foremost on delivering Warren’s proposed universal health services, it is not difficult to imagine that each dollar of administrative cuts below 4.5 percent would increase program costs by roughly a dollar, given the high returns to increasing current spending on health care fraud and abuse control programs, negotiating lower prices for drug and properly implementing payment reforms. See Harry Stein and Hilary Gelfond, “How Shortsighted Spending Cuts Reduce Waste, Fraud, and Abuse,” Center for American Progress, October 2014, https://www.americanprogress.org/issues/economy/reports/2014/10/01/98164/how-shortsighted-spending-cuts-increase-waste-fraud-and-abuse/; and Congressional Budget Office, “Budgetary Effects of H.R. 3, the Elijah E. Cummings Lower Drug Costs Now Act,” December 2019, https://www.cbo.gov/system/files/2019-12/hr3_complete.pdf.
91 Expanding health coverage to more people and more services at virtually no cost to the user will lead people to utilize more health services. However, the magnitude of this effect is unknown, and Berwick & Johnson argue the increase assumed by Urban is too high (see appendix B). Despite that argument, Berwick & Johnson continue to rely on the Urban figures in their estimate of Warren’s plan; we do the same for our central estimate. For our low-cost estimate, we assume utilization is about 2.5 percent lower than Urban estimates – we believe this is consistent with several other studies. Our high-cost estimate assumes utilization roughly 0.5 percent above Urban, as some have estimated utilization could grow more.
92 Note that our low-cost estimate is below implicit estimates used by the Warren campaign.
93 However, relative to the Urban study – which assumes hospitals are paid at 115 percent of Medicare and which Berwick & Johnson use as a benchmark – this would save about $600 billion.
94 The constitutionality of Maintenance of Effort payments is unclear. Some analysts think such efforts could be viewed as “constitutionally coercive” by the Supreme Court, which ruled a similar provision in the Affordable Care Act – which threatened to reduce base Medicaid payments of states who did not adopt a Medicaid expansion – was unconstitutional. However, states are already required to pay a Maintenance of Effort under Medicaid Part D, and no similar challenge has been made to its constitutionality (see “State Contributions” section in Congressional Research Service, “Medicare Part D Prescription Drug Benefit,” https://crsreports.congress.gov/product/pdf/R/R40611).
95 Berwick & Johnson estimate their savings relative to the Urban numbers over the 2020-2029 budget window. Our savings are measured from 2021-2030 and against a stricter interpretation of Medicare for All, which assumes providers are paid at Medicare rates (increased to 110 percent for hospitals by Warren in the section above) and drug prices remain at current projected levels. See Appendix I for more details.
96 Berwick & Johnson estimate these policies would save $0.5 trillion, $0.5 trillion, and $1.2 trillion, respectively, through 2029. We concur with these estimates and find the policies would save a total of $2.5 trillion from 2021 through 2030.
97 This estimate is based in large part on CBO’s preliminary analysis of the drug price negotiation methods in H.R. 3, the Elijah E. Cummings Lower Drug Costs Now Act of 2019. Note that in order to reduce the cost of name-brand drugs by 70 percent, most prices would need to be set at 50 percent to 75 percent of the average international price – well below the 110 percent cap Warren proposes.
98 This includes $800 billion already assumed under the Urban study and another $800 billion from the policy.
99 The enforcement saves significantly less than assuming 3.9 percent growth largely because it would apply the year following the excess cost increase and because its size would be determined by the growth rate year over year rather than the savings needed to hold costs to a fixed share of GDP. In our estimates, we assume all provider cuts will flow through to future years at the same underlying growth rate as the overall Medicare for All program.
100 See Simon Johnson, Betsey Stevenson, and Mark Zandi, Letter to Senator Elizabeth Warren, October 31, 2019, https://bit.ly/2ZVDf4N. Our estimates generally match numbers from this source, with adjusted growth rates to account for the fact that Warren indexes many of these provisions to overall health care costs. Policies are also measured over a different budget window (2021-2030 as opposed to 2020-2029).
101 The revenue rises between the low- and high-cost estimates because the contribution is pegged to overall health costs, which are higher in the high-cost estimate.
102 The revenue rises between the low- and high-cost estimates because the contribution is pegged to overall health costs, which are higher in the high-cost estimate. Unlike the Medicaid Maintenance of Effort, we view little potential for a constitutional issue for this policy, since it could easily be adjusted to match the employer-contribution required by private employers.
103 See Simon Johnson, Betsey Stevenson, and Mark Zandi, Letter to Senator Elizabeth Warren, October 31, 2019, https://bit.ly/2ZVDf4N.
104 See Congressional Budget Office, “Impose a Tax on Financial Transactions,” https://www.cbo.gov/budget-options/2018/54823; and “Impose a Fee on Large Financial Institutions,” https://www.cbo.gov/budget-options/2018/54822, respectively.
105 Our estimate of $300 billion is rough but meant to represent what we believe is the maximum that can be realistically raised from a tax gap regime in the spirit of Warren’s proposal under a point estimate meant to represent the middle of a range of likely outcomes (which is how CBO and others estimate). The savings is net of new spending and assumes roughly $200 billion from enhanced and improved enforcement and $100 billion from new rules and regulations. CBO estimates that increasing the IRS’s enforcement budget by $20 billion over a decade would raise $55 billion of revenue, for $35 billion in net savings (see revenue option 40). Because CBO and other estimators believe the IRS will prioritize compliance activities with the highest rates of returns, further increases in the IRS enforcement budget would raise more revenue but by declining amounts. Although CBO has not provided public estimates of how returns on investment would decline as investment rises, we believe they would decline roughly 0.5 percent to 1 percent for every $1 billion increase over a decade. Based on this assumption, a $200 billion increase in IRS enforcement – which would be the equivalent of quintupling the IRS enforcement budget and raises it to about four times above its modern annual record level (in real dollars) – would generate roughly $400 billion, leading to $200 billion of net savings over a decade. Further spending increases beyond that would face low returns that in many cases would be smaller than the new spending required (in other words, $1 of enforcement might generate less than $1 of revenue). Because CBO’s estimates already assume the IRS will begin with the highest-return activities, some of Warren’s policy proposals (as opposed to funding) would be captured within this figure or would actually have the effect of reducing it by diverting resources at the IRS toward activities with a lower return on investment. Other measures would result in additional revenue; however, there is little evidence that the revenue would be in the hundreds of billions or trillions. Existing CBO and JCT scores of past and proposed compliance measures suggest revenue in the billions or tens of billions. For example, JCT estimates oversight on paid preparers would raise $164 million and IRS flexibility to fix correctible errors would raise $300 million; they estimate greater information reporting related to contractors, mortgage interest, and FATCA would raise less than $2.5 billion; they estimate improving worker reclassification rules could raise $11 billion, streamlining audits and adjustment procedures for large partnerships could raise $7.5 billion, and making shareholders liable for unpaid corporate taxes would raise $1.8 billion. In the past, JCT has estimated that (enacted) information reporting requirements for corporations raised $17 billion, information reporting on third-party transactions raised $9.5 billion, and stronger information reporting on capital gains raised less than $7 billion.
For more information, see Janet Holtzblatt and Jamie McGuire, “Factors Affecting Revenue Estimates of Tax Compliance Proposals,” Joint Working Paper of the Congressional Budget Office and the Staff of the Joint Committee on Taxation, November 2016, https://www.cbo.gov/sites/default/files/114th-congress-2015-2016/workingpaper/52199-wp-taxcompliance.pdf.
106 All tax gap measures in President Trump’s FY 2020 budget were projected to raise $30 billion over a decade, net of new spending. The proposals in President Obama’s FY 2016 budget were projected to raise about $60 billion, net of new spending. See Joint Committee on Taxation, “Description Of Certain Revenue Provisions Contained in The President’s Fiscal Year 2020 Budget Proposal,” July 2019, https://www.jct.gov/publications.html?func=startdown&id=5209; Joint Committee on Taxation, “Description Of Certain Revenue Provisions Contained in The President’s Fiscal Year 2016 Budget Proposal,” September 29, 2015, https://www.jct.gov/publications.html?func=startdown&id=4842; and Committee for a Responsible Federal Budget, “President’s Budget Gets Serious About Cutting Waste, Fraud, and Abuse,” May 2019, https://www.crfb.org/blogs/presidents-budget-gets-serious-about-cutting-waste-fraud-and-abuse.
107 As made clear in the two endnotes above, no package of tax gap measures has ever been scored as raising over $100 billion over a decade, and there is little evidence to suggest savings 24 times as large are plausible – certainly not in a point estimate meant to represent the center of a range of possible outcomes. We believe our estimate of $300 billion to be a generous point estimate and believe it is at least as likely that Warren’s proposals would save less as it is that they would save more. However, at least two key factors might lead the policies to save more: if the IRS is currently grossly misusing its enforcement resources, or if greater tax enforcement leads to substantially greater pre-emptive tax compliance. Our estimates rely on insights and assumptions from CBO and JCT that suggest the IRS is currently aiming to maximize return on its enforcement budget (given legal constraints) and that there is insufficient evidence to conclude that enforcement would raise more from the indirect compliance effects than it would lose from taxpayers adapting to enforcement techniques with smarter evasion techniques. However, a recent paper by Natasha Sarin and Lawrence H. Summers argues these assumptions are wrong and estimates $1 trillion of revenue from tax gap reduction. We believe their estimates are likely extremely optimistic and represent figures far higher than what JCT or CBO would credit their proposal. Sarin’s and Summers’s $1 trillion would be an appropriate low-cost estimate, in our opinion. In deference to Johnson, Stevenson, & Zandi and to the campaign, however, we assume their estimate of $2.4 trillion (from 2021-2030) in our low-cost scenario.
108 The Tax Cuts and Jobs Act (TCJA) further allows businesses to deduct the cost of most equipment immediately through a process called 100 percent expensing; however, this full expensing is scheduled to phase out under current law and would be repealed entirely under our understanding of Warren’s intention to fully repeal the TCJA cited by Johnson, Stevenson, & Zandi. For more about accelerated depreciation, see Committee for a Responsible Federal Budget, “The Tax Break-Down: Accelerated Depreciation,” September 2013, https://www.crfb.org/blogs/tax-break-down-accelerated-depreciation.
109 See Chairman Max Baucus, “Summary of Staff Discussion Draft: Cost Recovery and Accounting,” U.S. Senate Committee on Finance, November 21, 2013, https://www.finance.senate.gov/imo/media/doc/Chairman's%20Staff%20Discussion%20Draft%20on%20Cost%20Recovery%20and%20Accounting%20Summary1.pdf.
110 See Lily L. Batchelder, “Accounting for Behavioral Considerations in Business Tax Reform: The Case of Expensing,” January 24, 2017, https://bit.ly/2Fy0mcs; and Committee for a Responsible Federal Budget, “The Tax Break-Down: Accelerated Depreciation,” September 2013, https://www.crfb.org/blogs/tax-break-down-accelerated-depreciation.
111 This proposal is implied by Warren’s clean energy plan, which is “fully paid for by reversing Trump’s tax cuts for the wealthiest individuals and giant corporations” (see Warren for President, “100% Clean Energy for America,” https://elizabethwarren.com/plans/100-clean-energy); it is further assumed by the letter from Johnson, Stevenson, and Zandi and clarified based on our discussions with the Warren campaign.
112 See Emmanuel Saez and Gabriel Zucman, “Appendix A: Estimates on improvements to international taxation,” October 30, 2019. https://bit.ly/2ZVDf4N.
113 See Economic Policy Institute, “Detailed estimates for policies in EPI’s ‘Budget for Shared Prosperity,’” July 2019, https://www.epi.org/blog/detailed-estimates-for-policies-in-epis-budget-for-shared-prosperity/. Estimate is based on a proposal to “end offshore outsourcing,” increased by 25 percent to account for the tax on foreign companies.
114 This excludes the 3.8 percent Net Investment Income Tax under current law and the 14.8 percent increase in that tax under Warren’s Social Security plan.
115 For more discussion of mark-to-market taxation, see Lily L. Batchelder and David Kamin, “Taxing the Rich: Issues and Options,” September 2019, https://papers.ssrn.com/sol3/papers.cfm?abstract_id=3452274; Ranking Member Ron Wyden, “Treat Wealth Like Wages,” U.S. Senate Committee on Finance, September 2019, https://www.finance.senate.gov/imo/media/doc/Treat%20Wealth%20Like%20Wages%20RM%20Wyden.pdf; and Eric Toder and Alan D. Viard, “Replacing Corporate Tax Revenues with a Mark to Market Tax on Shareholder Income,” Tax Policy Center, October 2016, https://www.urban.org/sites/default/files/publication/84456/2000949-replacing-corporate-tax-revenues-with-a-mark-to-market-tax-on-shareholder-income.pdf.
116 A mark-to-market tax of 39.6 percent is roughly equivalent to a 2 percent wealth tax assuming 5 percent annual returns (0.05*0.396=0.0198) and a 4 percent wealth tax assuming 10 percent annual returns.
117 Most of this revenue comes from the mark-to-market taxation, which we find will raise about $1.4 trillion over a decade in our central estimate based on an average of adjusted Tax Policy Center estimates of the above mentioned Economic Policy Institute proposal and estimates from Lily L. Batchelder and David C. Kamin assuming 30 percent avoidance. Our low-cost estimate, which reflects numbers provided by the Warren campaign, assumes only 15 percent tax avoidance. However, when stacked on top of Warren’s wealth tax of 2 percent or 3 percent, we expect a higher avoidance rate. Depending on asset return, stacking the mark-to-market tax on top of these existing taxes will result in effective wealth tax rates ranging from 2 percent to 7 percent in most cases. While a wealth tax elasticity of 8 (as estimated by Saez & Zucman) would imply an avoidance rate of 15 percent for a 2 percent wealth tax, it would imply a 21 percent avoidance rate on a 3 percent wealth tax and a 38 percent avoidance rate on a 6 percent tax (see Max Ghenis, “Warren’s wealth tax would raise less than she claims – even using her economists’ own assumptions,” November 8, 2019, https://medium.com/@MaxGhenis/warrens-wealth-tax-would-raise-less-than-she-claims-even-using-her-economists-own-assumptions-bea43840bc0a).
118 Our wealth tax estimate relies on assumptions from Saez & Zucman on the revenue raised from a 2 percent wealth tax in year 1 and adjusts those estimates to appropriately account for higher rates, multiple years, and interactions with other provisions. Stacked on top of a 3 percent wealth tax for billionaires, mark-to-market taxation, and other policies, we believe the additional 3 percent wealth tax will raise very little revenue over the next decade. This is consistent with estimates from Ghenis that show a proper use of the Saez & Zucman elasticities alone would lead the 6 percent wealth tax to raise only $300 billion (as opposed to $1 trillion) more than a 3 percent tax, estimates from Penn Wharton Budget Model that find the 6 percent tax would raise only about $100 billion more (derived by Zucman and confirmed by PWBM), and estimates from Saez & Zucman that the long-run revenue-maximizing wealth tax rate is about 6.25 percent.
There are three main reasons the wealth surtax will raise little when stacked upon other proposed taxes. First, the high effective tax rate on wealth above $1 billion (7 percent to 10 percent in most cases) will lead to high rates of legal and illegal avoidance, including through donation, distribution, and consumption of wealth. Saez & Zucman’s 15 percent avoidance estimate is based on an estimated 8 percent elasticity. However, as Ghenis and others have pointed out, an 8 percent elasticity only applies a 15 percent avoidance rate for a 2 percent wealth tax. For a 6 percent wealth tax, it implies a 38 percent avoidance rate; for an 8 percent effective wealth tax, it implies a 47 percent avoidance rate; and for a 10 percent effective wealth tax, it implies a 55 percent avoidance rate. Second, in addition to high levels of avoidance, significant wealth taxation will have the (intended) effect of reducing wealth and thus reducing the base of taxation. For example, if a billionaire’s asset value grew by 6 percent per year, their wealth would decline by one-quarter after a decade, and revenue from the wealth and mark-to-market taxes would fall almost in half relative to GDP over that same period. Finally, Warren’s proposals to increase corporate taxes, tax financial transactions, and tax other earned and investment income will all have the effect of reducing wealth and returns to wealth among billionaires – thus further shrinking the tax base. In addition to those three reasons, some research suggests the Saez & Zucman substantially overstate the amount of wealth held by billionaires and/or understates the appropriate elasticity, though our figures assume their estimates are accurate in our central estimate. Our estimates also ignore dynamic effects, which several studies have shown are likely to further reduce revenue collection. There are also potential constitutional issues with a wealth tax that we set aside for purposes of our analysis.
119 See Warren for President, “Investing in Rural America,” https://elizabethwarren.com/plans/invest-rural.
120 See recommendation IIA of Jeremy Bearer-Friend, “Restoring Democracy Through Tax Policy,” December 2018, https://greatdemocracyinitiative.org/wp-content/uploads/2018/12/Tax-and-Democracy-121118.pdf.