Taking a Look at CBO's New Transparency Efforts
The Congressional Budget Office (CBO) has worked hard to improve transparency and accessibility of its data and analysis. Over the past two years, CBO director Keith Hall has made transparency a priority, and CBO has released numerous pieces explaining its operations, assumptions, methods, and processes over the last few months as well as interactive tools and data that help us take a deeper dive into how illustrative changes to its assumptions can affect projections.
Two weeks ago, CBO published "An Update on Transparency at CBO," which outlines and lists all of its transparency efforts over the past year. As CBO explained, the transparency efforts have focused on the three goals of "showing the connections to data, professional research, and feedback from experts," promoting "a thorough understanding of the analyses through accessible, clear, and detailed communication," and helping "people gauge how estimates might change if policies or circumstances differed."
The 24-page report itself breaks down CBO's transparency efforts into ten types of activities: CBO's various Congressional testimonies this year (from eight total appearances), reports that explain its analytical methods (divided between general and technical information), the supporting data it has released, CBO's projection accuracy, how its current estimates line up with previous estimates, how CBO compares to other estimators, the effects of alternative policy assumptions on CBO projections, the inherent uncertainty of its projections, data visualization, and outreach efforts.
With the goal of transparency in mind, CBO also recently released an Interactive Force Structure Tool. This tool allows users to input different changes to the Defense Department's operations and support costs, which represent about two-thirds of the department's base budget (the other third being acquisition and construction).
The tool allows you to either increase or decrease different parts of the military. For example, you can change the number of combat teams, aircraft carriers, or B-52 bomber squadrons in the military, and the tool shows you what these changes mean for the size of the military and total military spending. The tool offers over 50 choices and allows users to adjust most within a relatively wide range.
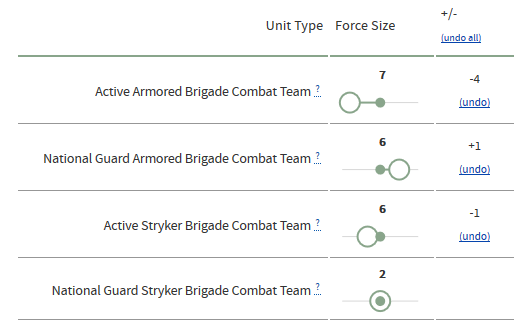
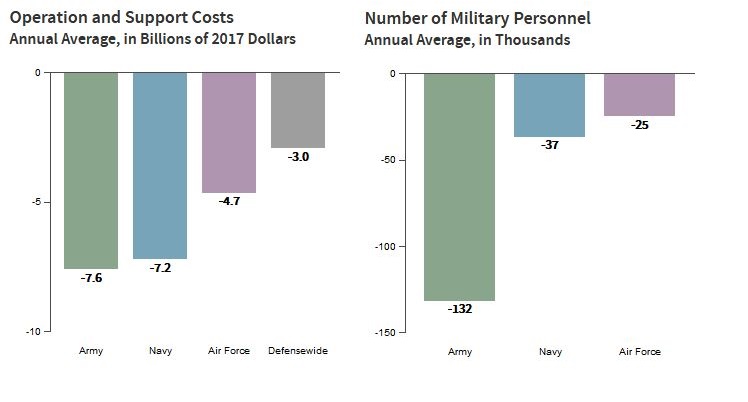
As an illustrative example, lowering the number of National Guard Infantry Brigade Combat Teams from a projected 20 to 10, reducing the number of Naval aircraft carriers from 12 to 6, eliminating 20 F-16 Fighter Aircraft Squadrons, and cutting the Special Operations Command (SOCOM) by 50 percent would result in $22.5 billion average annual savings and nearly 200,000 fewer military personnel every year. The interactive tool provides a helpful visualization of these changes.
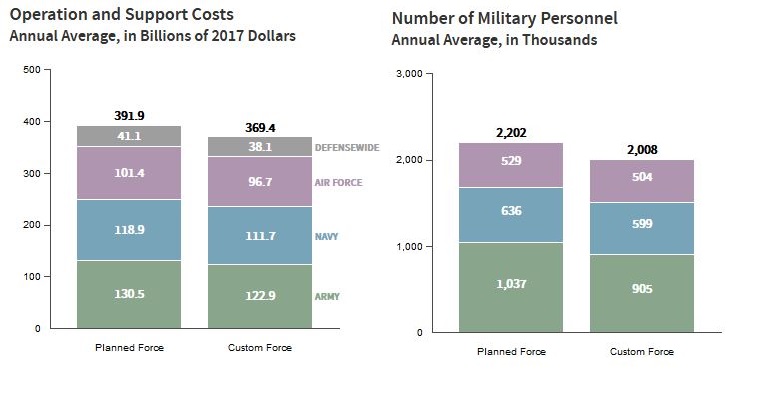
As a result of these illustrative changes, average spending on operation and support costs (in 2017 dollars) would drop from $391.9 billion to $369.4 billion while military personnel would average 2 million instead of 2.2 million.
This tool, along with CBO's other tools and transparency efforts, helps policymakers understand CBO's methods and better identify the best course toward putting debt on a sustainable path. We're excited to see CBO's efforts this year and look forward to future content that sheds even more light on budgeting and economic policy.
What's Next
-
Image

-
Image

-
Image