COVID Relief Includes $360 Billion of State and Local Aid
This analysis has been updated based on new information. As of October 15, we estimate roughly $280 billion of allowed federal aid to state and local governments. See our updated analysis here.
Most state and local governments are experiencing substantial revenue losses and new spending needs as a result of the COVID-19 pandemic and economic crisis. While estimates differ on the magnitude of state and local needs, federal funding from recent COVID-relief legislation may help defray some of these losses.
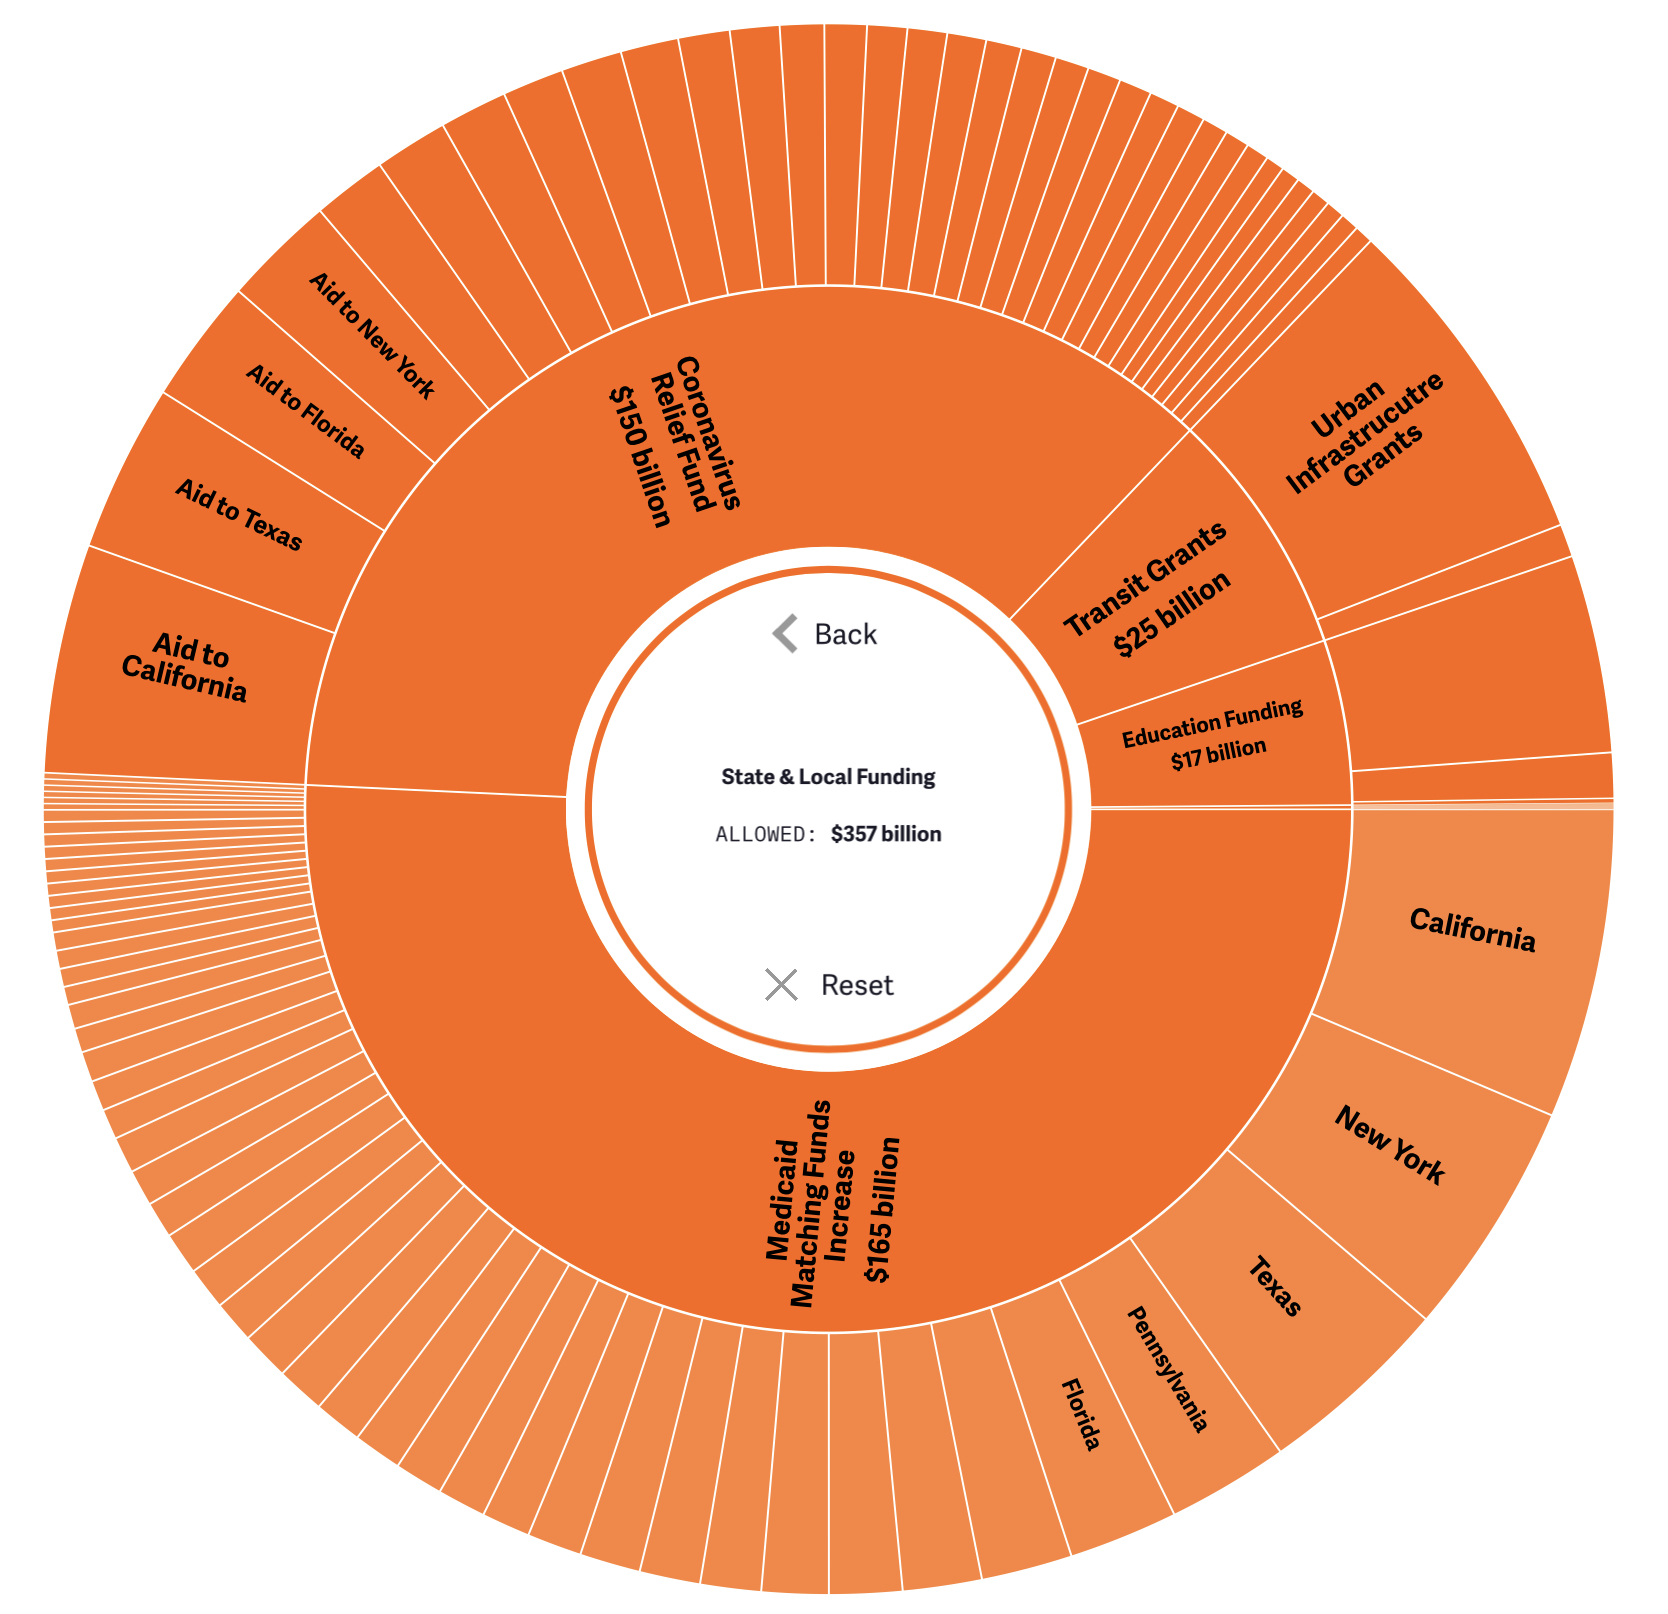
Using our COVID Money Tracker tool, we estimate the federal government has allocated almost $360 billion toward state and local aid1 — this is significantly larger than our prior estimate of roughly $240 billion because it incorporates updated Medicaid estimates from the Congressional Budget Office (CBO).
This figure includes both restricted and flexible aid to states, but excludes indirect aid to states and localities, or funding that uses states as a pass-through (for example, disaster funding or housing support). So far, we estimate about $230 billion of the $360 billion has been committed or disbursed.
You can explore the data in more detail at COVIDMoneyTracker.org.

Almost half of the aid to states and localities — $165 billion — comes from an increased federal Medicaid match. The Families First Coronavirus Response Act (FFCRA) increased the Federal Medical Assistance Percentages (FMAPs) by an additional 6.2 percentage points, on top of the 50 to 78 percent a state was slated to receive, for the duration of the public health emergency. This is more than triple the original $50 billion estimate, since many more people are now on Medicaid and CBO expects the national emergency to last longer than it originally assumed. Specifically, CBO assumes the public health emergency will continue into 2022, compared to Spring of 2021 in their initial analysis. The actual amount of federal Medicaid support will depend on when the public health emergency declaration ends.
For the most part, the FMAP increase represents an unrestricted transfer to states. However, enhanced FMAP funds are conditional on states offering continuous coverage and maintaining benefit levels over the course of the pandemic, so some spending is to cover new costs.
The second largest pot of funding is the $150 billion Coronavirus Relief Fund that allocated direct aid to state and local governments. These funds are specifically designated for new expenses related to the addressing the pandemic or economic crisis and thus are less flexible than the Medicaid funds. Nearly all of the funds have been distributed to states and localities, though most states have not spent their whole allocation.
The remaining funds we tally include $17 billion of aid to public schools, $25 billion of transit grants, and $400 million of election security grants. These funds are mostly allowed to cover existing costs and thus are flexible. Nearly all these funds have been committed.
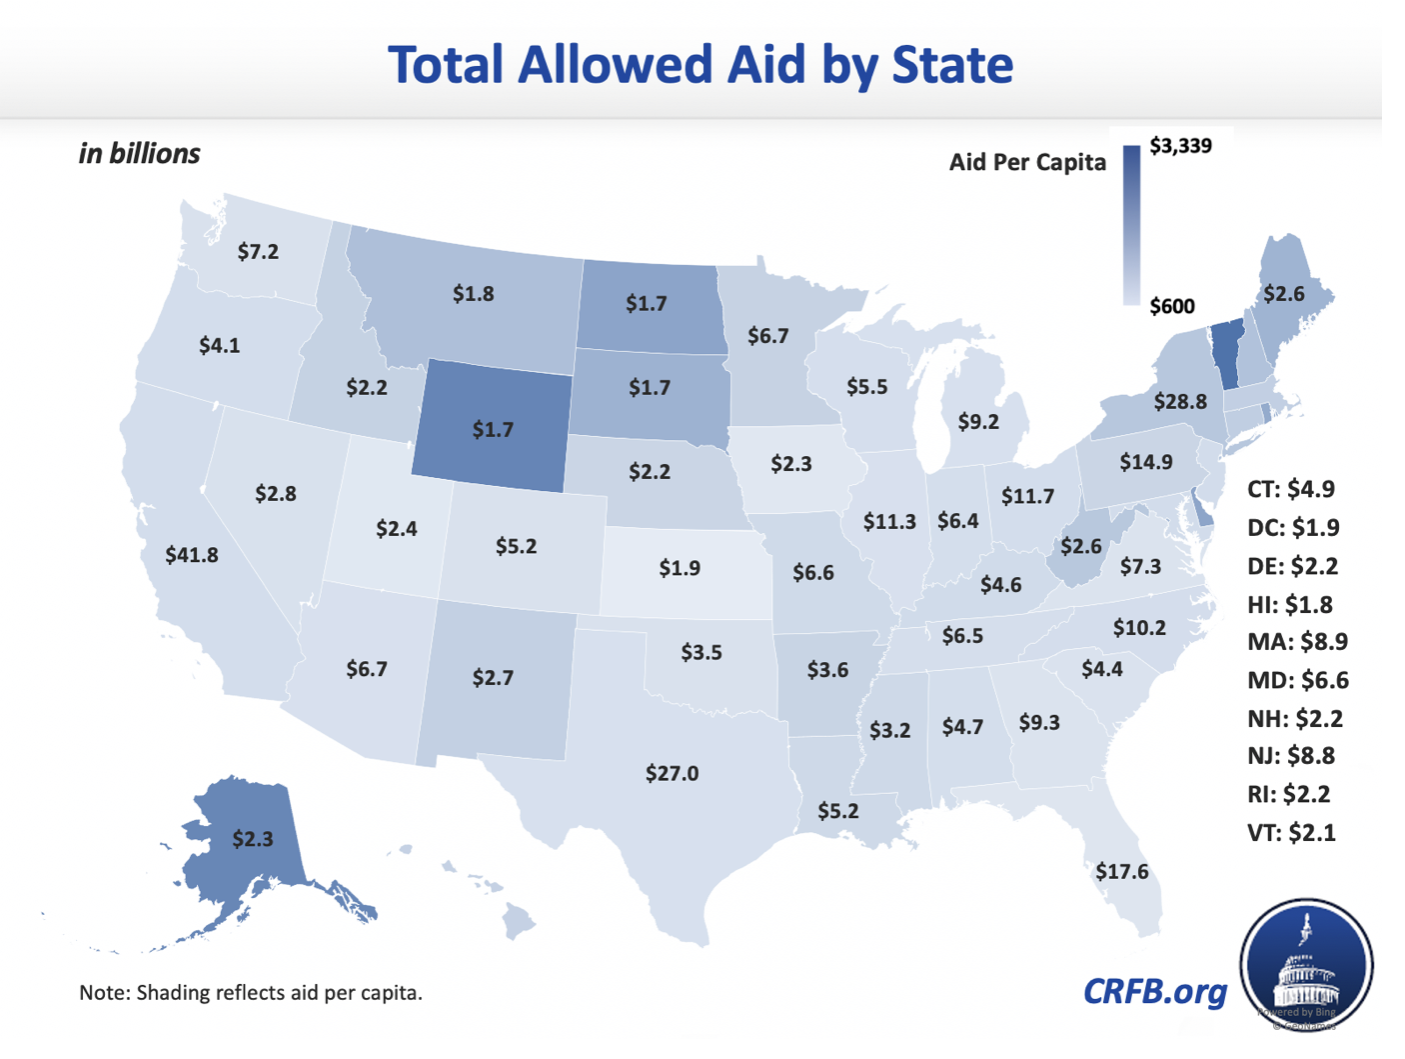
Funding has been distributed to all 50 states, the District of Columbia, tribal areas, and overseas U.S. territories. We estimate California will get the most aid — $42 billion — while Vermont will get the most aid per capita.3

Our COVID Money Tracker tool allows users to filter aid by state. For example, the state of New York is slated to receive nearly $30 billion, including $16 billion from Medicaid, $8 billion from the Coronavirus Relief Fund, $4 billion in transit grants, and at least $1 billion in education funding. You can explore your state here.

Importantly, this analysis does not cover all dollars that went to state and local governments. About $100 billion of aid allocated to state and local governments was to cover disaster costs, community development, housing, health preparedness, reimbursement of certain prior-law unemployment benefit costs, and other spending where (in most cases) the states essentially administer federal initiatives. Another $35 billion has been allocated to support up to $500 billion in state and local bond purchases by the Federal Reserve — though so far the Municipal Lending Facility has only purchased $1.7 billion.
The analysis also does not include any indirect support to states. For example, the roughly $500 billion of expanded unemployment benefits policymakers have enacted is likely to generate tens of billions in state and local income and sales tax revenue (unemployment is taxable as income in the majority of states). And in general, policies which boost economic output will improve the finances of state and local governments.
Even with this support, states and localities may still face substantial shortfalls. Policymakers should work together to identify a reasonable package to help address the needs of states and localities, the broader economy, and those suffering as a result of the current pandemic and economic crisis.
Note: We updated this blog on 9/25/2020 based on new information on CBO's estimate of the duration of the public health emergency in their 2020 Long-Term Budget Outlook.

This blog post is a product of the COVID Money Tracker, a new initiative of the Committee for a Responsible Federal Budget focused on identifying and tracking the disbursement of the trillions being poured into the economy to combat the crisis through legislative, administrative, and Federal Reserve actions.
1 Includes District of Columbia, tribal, and U.S. territory assistance.
2 Coronavirus Relief Fund, transit grants, and education grants are based on actual allocations, whereas our Medicaid estimates are based on a combination of the aggregate cost of the 6.2 percent increase in the Federal Assistance Matching Percentages (FMAPs) according to CBO’s September 2020 baseline and the proportional increase in the federal share of Medicaid payments by state per the Urban Institute (Table 1).

