Sizing Up Social Security's Solvency Challenge
Social Security faces a large shortfall between scheduled benefits and dedicated revenue, and the program is currently on a path toward insolvency. However, official estimators disagree on the extent of the program’s financial woes.
The Social Security Trustees project the program’s trust funds face a 75-year gap equal to 2.7 percent of payroll (1.0 percent of GDP) and will be depleted by 2034, on a (theoretical) combined basis. Meanwhile, the Congressional Budget Office (CBO) projects a trust fund gap equal to 4.7 percent of payroll (1.6 percent of GDP) and a depletion date of 2029.
Fig. 1: CBO Shows a Much Larger 75-Year Actuarial Shortfall Than the Trustees
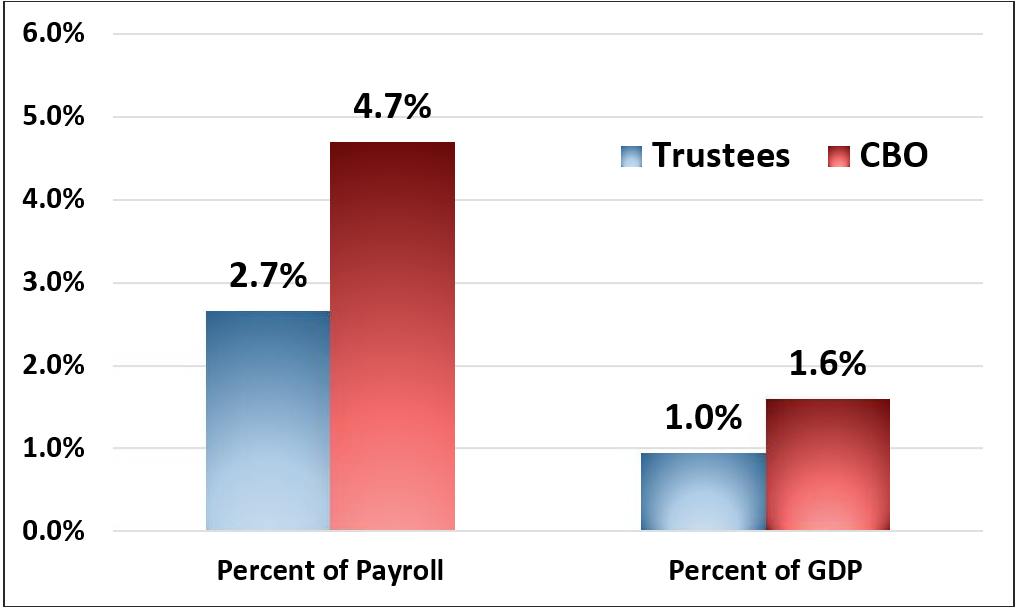
Sources: Social Security Administration, Congressional Budget Office
The difference between the Trustees and CBO is driven by a number of factors, including differences in projected life expectancy, interest rates, and taxable income. While CBO projects a much less favorable outlook, today’s workers and retirees will face deep across-the-board cuts in only a few years under either projection.
To avoid these cuts, policymakers should enact a thoughtful mix of revenue and benefit changes that begin soon, phase in slowly, strengthen retirement security for those who rely on benefits, promote economic growth, and secure Social Security’s long-term finances. Ideally, any Social Security reform should include robust changes designed to achieve 75-year sustainable solvency, regardless of which estimate proves more accurate.
How Do CBO and the Trustees Differ?
CBO and the Trustees differ substantially in their 75-year projections. In terms of revenue and assets, CBO projects an average of 4.6 percent of GDP over 75 years while the Trustees project 5.0 percent of GDP. Both fall just short of 14 percent of payroll. Meanwhile, CBO projects average costs of 6.2 percent of GDP while the Trustees project 5.9 percent. As a percent of payroll, CBO estimates 18.6 percent compared to the Trustees’ 16.5 percent.
Fig. 2: Differences in Revenue and Spending Between CBO and Trustees (Percent of GDP)
Sources: Social Security Trustees, Congressional Budget Office
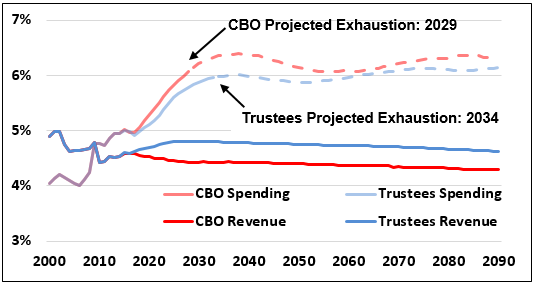
As a result, CBO estimates Social Security’s 75-year shortfall will be substantially larger than the Trustees estimate – 4.7 percent of payroll and 1.6 percent of GDP as opposed to 2.7 percent of payroll and 1.0 percent of GDP. CBO also projects the Social Security trust funds will run out of reserves five years earlier than the Trustees – 2029 as opposed to 2034 – and the needed tax and benefit changes to achieve solvency are substantially larger.
Fig. 3: Differences in Trustees’ and CBO Financial Projections
| Trustees | CBO | |
|---|---|---|
| 75-Year Projected Spending | 16.5% of Payroll (5.9% of GDP) |
18.6% of Payroll (6.2% of GDP) |
| 75-Year Projected Income | 13.8% of Payroll (5.0% of GDP) |
13.9% of Payroll (4.6% of GDP) |
| 75-Year Shortfall | -2.7% of Payroll (-1.0% of GDP) |
-4.7% of Payroll (1.6% of GDP) |
| Shortfall in 2090 | -4.4% of Payroll (-1.5% of GDP) |
-6.4% of Payroll (-2.1% of GDP) |
| Year of Insolvency | 2034 | 2029 |
| Automatic Benefit Cut At Insolvency | 21% | 29% |
| Immediate Benefit Cut Needed for 75-Year Solvency | 16% | 25% |
| Immediate Tax Increase Needed for 75-Year Solvency | 22% | 38% |
| Percent of 75-Year Shortfall Closed by Eliminating Tax Max | 72% | 38%* |
| Percent of 75-Year Shortfall Closed by Price Indexing Benefits | 104% | 75%* |
Source: Social Security Administration, Congressional Budget Office
*Note: CBO options for 2015, adjusted for the new 75-year window.
Explaining the Difference Between CBO and the Trustees
The difference in Social Security projections between CBO and the Trustees are driven by the demographic and economic assumptions made by each estimator. Each estimate long-term values for variables such as birth rates, life expectancy, earnings growth, interest rates, and other factors that heavily influence Social Security’s finances. While CBO and the Trustees differ on a number of assumptions, three factors stand out as most significant:
- Taxable Payroll: Over the past two decades, growing inequality has reduced the share of wages below the $118,500 (wage-indexed) payroll tax cap from 87 percent to 83 percent. The Trustees believe the percent of wages subject to the payroll tax will stabilize at 82.5 percent of earnings, while CBO projects growing inequality will ultimately lead the payroll tax to cover about 77 percent of wages. As a result, CBO projects less future payroll tax revenue.
- Life Expectancy: Both CBO and the Trustees believe life expectancy will continue to grow over time, but CBO projects a somewhat faster rate of growth. Specifically, CBO assumes the mortality rate will continue to decline at its historical average, while the Trustees anticipate a slowdown in longevity gains. As a result, CBO projects life expectancy at age 65 to grow by 5.2 years by 2090, while the Trustees project it to grow by 4.2 years. These differences lead CBO to project higher spending growth.
-
Interest Rates: The Social Security trust funds hold special bonds that pay an interest rate above (but based upon) the average rate paid on debt held by the public. Between 2010 and 2014, the average interest rate paid on these bonds was about 2.2 percent, the lowest it has been since at least 1960. Though neither the Trustees nor CBO believe interest rates will remain this low, CBO believes they will remain much lower than the Trustees. Specifically, CBO estimates the interest rate for Treasury bonds held by the trust funds will reach a long-term steady state of roughly 4.7 percent, compared to 5.3 percent projected by the Trustees. While some of this is due to lower inflation expectations from CBO, most is due to lower expected real interest rates. Lower interest rates mean that the trust funds will receive less in interest on their reserve holdings, while the present value of future cash flow deficits will be greater. As a result, CBO projects faster exhaustion of the trust fund and the need for larger adjustments today to secure future solvency. Technical Panel, which convened in 2015, made recommendations somewhere between the two. With regards to wages below the taxable maximum, the Technical Panel’s recommendations are closer to the Trustees. On interest rates, the Technical Panel’s recommendations are part way between the Trustees and CBO. And when it comes to life expectancy, the Technical Panel projects even longer lives than CBO.
Using the Technical Panel’s assumptions, Social Security’s 75-year shortfall would total 3.5 percent of payroll – roughly half way between the estimates of CBO and the Trustees (though a bit closer to the Trustees). In the 75th year the panel estimates a shortfall of 6.1 percent of payroll, almost as large as CBO’s estimate.
Fig. 4: Differences in Trustees, CBO, and Technical Panel Assumptions
| Trustees | CBO | Tech. Panel | |
|---|---|---|---|
| 75-Year Shortfall (Percent of Payroll) | -2.7% | -4.7% | -3.5%* |
| 75th Year Shortfall (Percent of Payroll) | -4.4% | -6.4% | -6.1% |
| Insolvency Date | 2034 | 2029 | 2033 |
| Ultimate Share of Wages Below the Tax Max | 82.5% | 77% | 82.2% |
| Increase in Life Expectancy at Birth by 2090 | +6.6 years | +8.1 years | +9.0 years |
| Increase in Life Expectancy at age 65 by 2090 | +4.2 years | +5.2 years | +5.9 years |
| Ultimate Nominal Interest Rates | 5.3% | 4.7% | 5.0% |
| Ultimate Annual CPI Growth | 2.6% | 2.4% | 2.5% |
| Ultimate Real (CPI-Adjusted) Interest Rates | 2.7% | 2.3% | 2.5% |
| Ultimate Fertility Rate (Births Per Woman) | 2.0 | 1.9 | 1.9 |
Sources: Social Security Administration, Congressional Budget Office, Social Security Advisory Board
*Note: The 75-Year Imbalance for the Technical Panel is for 2015, adjusted for the new 75-year window. Ultimate represents steady-state values.
Conclusion
Differences between the Social Security Trustees and CBO underscore that no projections for Social Security will be exact. Rather, they give a general idea of the program’s future under a reasonable set of economic and demographic data assumptions. However, both sets of projections show that under virtually any circumstance policymakers will need to act soon to avoid trust fund exhaustion within the next two decades.
The uncertainty between the two also shows the importance of making Social Security not only solvent, but working toward robust solvency so that changes in demographic and economic projections don't knock a solvency plan off course. Some policies – such as indexing the retirement age to longevity growth and locking the taxable maximum to a fixed percentage of wages – are far better at assuring robust solvency than other ad-hoc changes (including ad-hoc changes to the retirement age or taxable maximum). Ideally, a plan will be designed with enough robustness to be estimated as producing solvency under both Trustees and CBO projections.
Sadly, many recent Social Security discussions have focused more on broad-based benefit expansions for those who don’t need them rather than assuring benefits are payable for those who do. Policymakers should instead look to the five recent Social Security reform plans that can truly strengthen Social Security and assure its solvency for current and future generations.