Medicaid Provider Taxes Inflate Federal Matching Funds
This paper is part of a series on Medicaid financing. Other papers in the series discuss an overview of state financing schemes and supplemental payments.
The Medicaid program, which provides health care to 93 million lower-income Americans, is jointly financed by state governments and the federal government. Based on the Federal Medical Assistance Percentage (FMAP) formula, the federal government contributes an average of roughly 60 percent of reported Medicaid costs – $594 billion in 2023 and a projected $6.8 trillion over the next decade.1
While the formulas that determine federal and state contributions are meant to reflect state need, these formulas have been subverted by numerous state schemes that reduce state general fund financing, inflate federal spending, and increase health care costs. We discuss this issue generally in an earlier issue brief Time to Fix Medicaid Financing Schemes. The most utilized schemes, by far, involve taxes imposed on health care providers and related entities, or provider taxes.
Despite some federal restrictions on state use of provider taxes, these taxes continue to grow. Provider taxes are currently the second largest source of funding for states’ share of Medicaid costs behind general funds. And although rules aim to limit states’ use and abuse of these taxes to boost their federal funding, states continue to find ways to utilize provider taxes in order to shift more and more Medicaid costs from the state onto the federal government, distorting the intended shared responsibility between the federal government and the states.
More specifically, the federal government covers over 5 percent more in Medicaid costs than it would without various state financing schemes.2 With federal debt approaching record levels while states are flush with cash, policymakers should work to rein in excessive federal Medicaid spending by limiting the use of provider taxes to inflate reported Medicaid costs and shift costs onto the federal government.3
In this paper, we explain:
- What state provider taxes are and how their use has grown
- Current federal requirements for provider taxes and their limits
- Options for addressing abuse of provider taxes
States Increasingly Rely on Provider Taxes to Inflate Their Medicaid Payments
All states besides Alaska impose taxes, fees, and assessments on various health care providers in order to help fund their Medicaid programs. This most commonly includes taxes on hospitals, nursing homes, and intermediate care facilities, but also taxes on managed care organizations, ambulance services, ambulatory surgical centers, physician services, and more.
On paper, provider tax revenue simply helps states to fund their portion of Medicaid costs. In practice, however, states often use these provider taxes to inflate their effective federal match by simultaneously taxing and boosting payments to the same health care providers. In doing so, states can report higher costs without having to boost their net spending.
Under the FMAP, the federal government will pay from 50 percent to 83 percent of ordinary Medicaid costs and 90 percent of costs for the ACA expansion population, which in 2023 equaled a total average FMAP of 60 percent.4 In 2018 (the most recent year with available data), provider taxes funded 17 percent of states’ contributions to Medicaid, equaling $37 billion.
The Government Accountability Office (GAO) has estimated that this and other financing schemes have boosted “real FMAP” rates by an average of 5 percentage points, so the federal government is paying almost 65 percent of Medicaid costs, as opposed to 60 percent.5
To simply illustrate how states boost the effective federal match, one could imagine a state with a 50 percent FMAP that makes a $500 million payment to hospitals. That payment is split with the federal government, who reimburses the state (the match) with $250 million.

Then, we can imagine that state wanting to send a larger payment to hospitals the following year. Using a provider tax scheme, the state can impose a $150 million tax on hospitals and report to the federal government an expected $200 million increase in its hospital payment. The federal government then reimburses the extra spending at the match rate, sending an additional $100 million to the state government.
In that scheme, hospitals receive $700 million and send $150 million back to the state government through the tax, netting an extra $50 million. The state also nets an extra $50 million and can reduce their general funding by that amount.
The federal government is now paying for $350 million of the $550 million in net hospital spending. Thus, the effective federal match rate moves from 50 percent (prior to the tax) to 64 percent. Furthermore, in cases like this, the tax scheme increases total Medicaid spending beyond what would be likely otherwise, since it reduces costs to states and is attractive to providers.
The proliferation of Medicaid supplemental and directed payments, which are lump-sum payments not tied to specific health care services, has made such schemes even easier for states by removing the need to link service-by-service payment increases to provider tax payments.6
The use of provider taxes has grown substantially over the past two decades. In 2003, 21 states had at least one provider tax in place. By 2018, all but one state (Alaska) had at least one provider tax in place, 34 states including DC had three or more provider taxes in place, and 11 states had two.7 As for the size of the taxes, 45 states and the District of Columbia had at least one health care tax that exceeded 3.5 percent of net patient revenue and 32 states had at least one tax that exceeded 5.5 percent of net patient revenue.8
States’ use of revenue from provider taxes to fund state Medicaid costs has increased significantly from $10 billion (7 percent of the total state Medicaid costs) in 2008 to $37 billion (17 percent of total state Medicaid costs) in 2018.9 The extent of states’ increasing reliance is best illustrated when looking at the percentage change in provider tax revenue compared to percentage change in state general fund revenue and other funding sources. From 2008 to 2018, Medicaid spending supported by provider taxes increased by more than 270 percent ($27 billion), while Medicaid spending supported by state general funds increased by 52 percent ($57 billion).10

Limitations on Provider Taxes Have Failed to Prevent Their Expansion
The fundamental problem with provider taxes is that they operate in a way that resembles a kickback. Providers welcome the use of these taxes because they lead to higher Medicaid spending and, in general, that spending increases provider revenue by enough to largely cover the cost of the tax. States benefit because the federal government matches the additional spending, leaving states without the need to use general funds to cover program expenditures.
Over time, federal rules have attempted to prevent states from using provider taxes as kickbacks. These rules have had some success in preventing direct kickbacks and have imposed limits on the overall size of provider taxes. However, these rules have not been sufficient to truly stem the attractiveness and abuse of provider taxes.
The primary restrictions on provider taxes today include:
- They must be broad-based so that all providers within the same category get taxed. This prevents states from taxing specific institutions or targeting taxes to high-volume Medicaid providers (e.g., taxing only hospitals that treat a large number of Medicaid patients and thus receive a larger Medicaid payment).
- Tax rates must be uniform for all providers within the same category. This prevents states from levying larger taxes on high-volume Medicaid providers and minimizing taxes on providers that receive relatively small or no Medicaid payments.
- States cannot hold providers harmless from taxes above 6 percent of revenue by either directly or indirectly offsetting the costs of the taxes paid by providers with higher re-imbursements. This provision intends to prevent states from guaranteeing providers that they will receive a payment to reimburse them fully or partially for the costs of the tax.
The broad-based and uniform requirements make it difficult for states to collude with individual medical institutions to boost states’ federal match. However, the “hold harmless” limitation is waived when taxes are set below the federally-mandated maximum threshold of 6 percent of net patient revenue. This creates a “safe harbor” for states to collude with classes of providers. The 6 percent limit has also effectively served as a hard cap on provider tax rates, since no states appear interested in imposing taxes on providers that are not ultimately recycled back to those providers while boosting federal matching funds.
States and providers have also identified loopholes and shortcomings of federal limits that allow them to skirt the federal requirements intended to restrict circular tax and payment arrangements. Some examples include:
- Private redistribution arrangements – One common scheme by providers involves hospital trade associations collecting donations from hospitals with a larger share of Medicaid patient revenue and in excess of their tax contributions, and then sending the donations to hospitals with Medicaid patient revenue lower than their tax payments.11 These arrangements are secretive and effectively undermine the fiscal integrity of Medicaid. In Texas and California, such arrangements have drawn media scrutiny and been targeted by the Centers for Medicare & Medicaid Services (CMS).12
- Waiver of broad-based and uniform requirements – States have found ways to pass the mathematical tests required to waive broad-based and uniform requirements, but still place the burden of the tax on Medicaid providers. For example, in a 2019 rule, CMS singled out one state that managed to pass the required waiver tests, while still targeting the tax burden. Specifically, 88 percent of the state’s provider tax revenue came from high volume Medicaid providers even though Medicaid services represented 45 percent of the total health care services being taxed.13
- Hiding impermissible provider taxes – Some states have designed and implemented tax schemes that hide impermissible provider taxes by inserting them into broader taxes unrelated to health care. For example, the Office of Inspector General (OIG) found that Pennsylvania hid a 5.9 percent provider tax on Medicaid managed care organizations (MCOs) into an existing gross receipts tax levied on electric companies and other utilities, and then offset most of the tax through supplemental Medicaid payments.14
Some of these schemes are legally questionable, meaning that they could be challenged and possibly stopped under current law. However, lack of transparency and data makes it difficult for the federal government to even identify these schemes, let alone stop them. Moreover, the “hold-harmless” rule effectively allows states and provider groups to collude to drive up reported costs even absent loopholes and workarounds, leaving the federal government with a far higher cost burden.
Federal Policymakers Should Scrutinize Provider Taxes
Given the limitations of current efforts to prevent the abuse of provider taxes, policymakers should consider further reforms to enhance transparency, improve accountability, and reduce unintended federal payments to states. More generally, they should consider provider tax limitations as an opportunity to either redistribute the federal Medicaid spending for other, more efficient beneficiary-focused investments or to reduce federal Medicaid spending.
Among the options include:
- Improving transparency, federal oversight, and enforcement of state provider taxes.
- Closing loopholes that allow states to game provider taxes and waivers from the rules (hiding impermissible taxes, pooling arrangements to ensure all providers are held harmless, excluding providers from taxes if they receive no or small Medicaid payments).
- Reducing or phasing out the 6 percent safe harbor threshold.
- Limiting provider taxes as a share of state general funding.
One of the most important steps needed to help crack down on evasion of the current provider tax limitations would be to increase transparency of state use of provider taxes. Federal auditors and CMS have identified large gaps in data. Basic missing data from each state includes the amount of revenues generated from provider taxes, the number of taxes levied, the types of providers taxed, the amount each provider pays in taxes, how the tax revenues are used by the state, and the amount of payment each provider receives as a result of the tax. Data collection conducted by oversight agencies and stakeholders capture some data at a point in time, but this data quickly becomes outdated and lacks the detail needed for effective oversight.
The Government Accountability Office (GAO) has recommended that CMS establish a data collection process requiring each state to report accurate and complete data on states' use of provider taxes.15
Both the Trump and Biden administrations agree that a lack of transparency into states’ financing arrangements has worked to undermine the integrity of Medicaid, allowing states to generate revenue at the expense of the federal government.
In 2019, the Trump administration proposed the Medicaid Fiscal Accountability Rule (MFAR), which would have required states to provide more detailed information about their financing arrangements to help federal authorities determine whether the financing mechanisms are used to leverage federal funds inappropriately.16 The rule was never finalized as CMS removed it from the regulatory agenda to further study some of the unintended potential impacts that were raised by states and others.
In 2023, the Biden administration sought to address provider private redistribution arrangements as suspected violations of the provider tax limitations because they seemed to redirect Medicaid funds from facilities treating the Medicaid population to those providing fewer or no Medicaid-covered services.17 CMS’s proposed enforcement plan seeks to prevent such practices, which are often orchestrated by lobbying groups representing hospitals in various states.18
This persistent lack of data makes it challenging to enforce existing rules, including whether states may be violating the safe harbor threshold or facilitating more direct hold harmless agreements that are illegal under current law. Lack of transparency also prevents CMS, policymakers, and stakeholders from understanding the implications of the current system, making enacting new reforms and restrictions more challenging to implement. The first step toward addressing these payment agreements begins with knowing how they work and understanding their prevalence and impact on state and federal Medicaid spending.
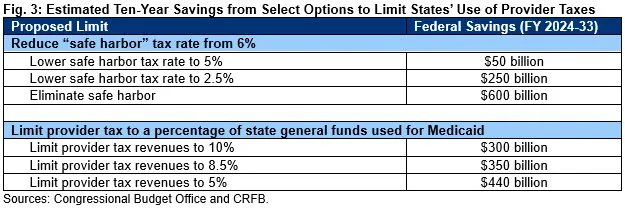
Beyond improved transparency and enforcement, policymakers could strengthen current limitations on the provider tax. One frequently discussed proposal is to reduce the current 6 percent safe harbor threshold.19 Setting the threshold to 5 percent would save almost $50 billion through 2033, while eliminating it entirely would save about $600 billion.20
Provider taxes could also be limited to a specific percentage of state general funding. For example, we estimate a 10 percent of state general funding limit would save roughly $300 billion over a decade, while a 5 percent limit would save roughly $440 billion.21 This approach could be less disruptive than reducing the safe harbor threshold because it would allow provider tax revenue to increase over time as state general funds increase, but also prevent states from disproportionately increasing provider taxes to replace state funding.
In practice, policymakers could limit disruption of these changes by phasing down the above limits gradually. They could also consider preventing all new provider tax increases from being used to inflate Medicaid matches, or by applying stricter limits to different classes of providers or different types of payments, such as supplemental payments.
Conclusion
The use of health care provider taxes has clearly allowed states to increase their federal funding and increase health care spending while reducing contributions from state general funds. Some have suggested that states turn to health care provider taxes to fill funding gaps when state economies and revenues decline. Taxes on health care providers can help states provide tax relief to other taxpayers, as the tens of billions in federal Medicaid funds can replace state general funds that would otherwise be needed. However, history shows that states’ use of provider taxes has steadily increased over time regardless of state economies and fiscal stability.
With the ineffective federal limits, limited oversight, and pervasive lack of transparency, states have wide latitude and discretion to claim billions in federal funding to support state fiscal relief efforts. New supplemental payments under managed care have also opened up tens of billions more in federal funding that states can draw down without a commensurate increase in state funding. States have no incentives to curtail the circular tax and payment schemes because the financial gains are too great. We will explore issues related to state directed payments under Medicaid managed care organizations in an upcoming analysis.
Federal action is needed to implement common sense steps to curtail the growth in provider taxes, address circular tax and pay schemes, and establish effective oversight and transparency. Further delays in federal action will only make it more difficult to enact needed changes as provider taxes and the resulting federal funds will only continue to increase.
Policy and oversight changes can be made in a thoughtful manner, but with states being flush with revenues and considering broader tax relief, now is an opportune time to begin and restore Medicaid fiscal integrity.
1 Cost projections based on Congressional Budget Office (CBO) Baseline Projections – Medicaid (May 2023), https://www.cbo.gov/data/budget-economic-data#3.
2 See Committee for a Responsible Federal Budget (CRFB), “Time to Fix Medicaid Financing Schemes” (June 2023), https://www.crfb.org/papers/time-fix-medicaid-financing-schemes.
3 Since 2021, 48 states and the District of Columbia have cut taxes – with 32 states and DC passing major tax cuts in the past two years and 16 states enacting cuts all three years. Urban Institute & Brookings Institution, Tax Policy Center, TaxVox: State and Local Issues (July 20, 2023), https://www.taxpolicycenter.org/taxvox/three-years-state-tax-cuts.
4 CRFB computed the FY 2023 FMAP average using data from Medicaid and CHIP Payment and Access Commission (MACPAC), “EXHIBIT 6: Federal Assistance Percentages (FMAPs) and Enhanced FMAPS (E-FMAPs) by State,” https://www.macpac.gov/publication/federal-medical-assistance-percentages-fmaps-and-enhanced-fmaps-e-fmaps-by-state-selected-periods.
5 For more on the other financial schemes, see CRFB, “Time to Fix Medicaid Financing Schemes,” (June 2023), https://www.crfb.org/papers/time-fix-medicaid-financing-schemes.
6 We will discuss the use of supplemental payments more in our next analysis, including financing gimmicks involving state directed payments to Medicaid managed care organizations.
7 Kaiser Family Foundation (KFF), “A View from the States: Key Medicaid Policy Changes: Results from a 50-State Medicaid Budget Survey for State Fiscal Years 2019 and 2020 – Provider Taxes” (October 2019), https://www.kff.org/report-section/a-view-from-the-states-key-medicaid-policy-changes-provider-rates-and-taxes/.
8 Medicaid and CHIP Payment Access Commission (MACPAC), “Health Care-Related Taxes in Medicaid” (May 2021), https://www.macpac.gov/publication/health-care-related-taxes-in-medicaid/.
9 U.S. Government Accountability Office (GAO), “CMS Needs More Information on States’ Financing and Payment Arrangements to Improve Oversight,” December 2020, Report no. GAO 21-98, p. 22, https://www.gao.gov/assets/gao-21-98.pdf.
10 National Association of State Budget Officers (NASBO), Archive of State Expenditure Report, https://www.nasbo.org/reports-data/state-expenditure-report/state-expenditure-archives.
11 California Healthline, “Feds Say Hospitals that Redistribute Medicaid Money Violate the Law” (August 15, 2023), https://californiahealthline.org/news/article/feds-cms-hospitals-redistribute-medicaid-money-hold-harmless/.
12 Id.
13 U.S. Department of Health and Human Services (HHS), Medicaid Fiscal Accountability Rule, 84 Federal Register 63731 (proposed November 18, 2019), https://www.govinfo.gov/content/pkg/FR-2019-11-18/pdf/2019-24763.pdf.
14 See HHS, Office of Inspector General (OIG), “Pennsylvania’s Gross Receipts Tax on Medicaid Managed Care Organizations Appears to be an Impermissible Health-Care-Related Tax” (A-03-13-00201, issued May 28, 2014), https://oig.hhs.gov/oas/reports/region3/31300201.pdf. An HHS OIG review found that Pennsylvania established an impermissible 5.9 percent tax on Medicaid managed care organizations (MCOs). The tax was inserted into an existing and longstanding Gross Receipts tax that was levied on services provided by electric companies, telecommunications companies, transportation entities, and banks. Over a three-year period, Pennsylvania produced nearly $1.8 billion in tax revenues from 11 Medicaid MCOs alone, holding them harmless for over 90 percent of the cost of the tax and excluding 19-non Medicaid MCOs. The state offset over 91 percent of the costs of the tax by making $1.6 billion in supplemental payments to Medicaid MCOs ($623 million from tax revenues and $981 million from matching federal funds). The OIG found that despite the additional $981 million in federal spending, no additional services were provided and no additional beneficiaries were served. The remaining $1.1 billion from the tax revenues was used to pay the state’s share of its Medicaid program and also generate additional federal matching funds.
15 U.S. Government Accountability Office (GAO), “Medicaid Financing: States’ Increased Reliance on Funds from Health Care Providers and Local Governments Warrants Improved CMS Data Collection,” Report no. GAO 14-627, p. 39, https://www.gao.gov/products/gao-14-627; and GAO, “CMS Needs More Information on States’ Financing and Payment Arrangements to Improve Oversight,” December 2020, Report no. GAO 21-98, p. 34, https://www.gao.gov/products/gao-21-98.
16 KFF, “What You Need to Know About the Medicaid Fiscal Accountability Rule (MFAR)” (January 2020), https://www.kff.org/medicaid/issue-brief/what-you-need-to-know-about-the-medicaid-fiscal-accountability-rule-mfar/#.
17 California Healthline, “Feds Say Hospitals that Redistribute Medicaid Money Violate the Law,” August 15, 2023, https://californiahealthline.org/news/article/feds-cms-hospitals-redistribute-medicaid-money-hold-harmless/.
19 The safe harbor has been reduced in the past: from 2008-2011 it went down to 5.5 percent. For other times it was proposed see Committee for a Responsible Federal Budget, “Provider Tax Limits Should Be On the Table for Medicaid Reform,” (March 2016). https://www.crfb.org/blogs/provider-tax-limits-should-be-table-medicaid-reform.
20 CRFB estimates based on CBO, “Limit State Taxes on Health Care Providers” (December 2022), https://www.cbo.gov/budget-options/58623. Note: the CBO estimates likely understate savings since their provider tax baseline is based on incomplete data relative to GAO and MACPAC findings on higher actual provider tax revenue across all states. See also: CRFB, “Time to Fix Medicaid Financing Schemes,” (June 2023), https://www.crfb.org/papers/time-fix-medicaid-financing-schemes.
21 Estimated savings are conservative as the CMS baseline estimate assumes the percentage of the nonfederal share from provider taxes would remain at 17 percent (what GAO reported for FY 2018) and would not increase.