CBO’s Analysis of the President’s FY 2017 Budget
The Congressional Budget Office (CBO) released its estimate of the President’s FY 2017 budget, using its own economic and technical assumptions to evaluate the President’s policy proposals. While CBO estimates lower near-term deficits and debt than the President’s own Office of Management and Budget (OMB), it projects that after 2018, deficits and debt will both rise slowly but more or less continuously as a share as Gross Domestic Product (GDP), ultimately in excess of OMB’s estimates.
Specifically, CBO estimates debt held by the public under the President’s budget would fall modestly, from 75.4 percent of GDP in 2016 to 74.1 percent in 2018, before rising to 77.4 percent of GDP by 2026. By contrast, OMB estimates that debt would remain roughly stable over the decade, reaching 75.3 percent of GDP by 2026. This higher estimated debt is in part due to higher nominal-dollar debt but also because OMB uses economic projections that include the economic effects of the President’s policies (most significantly, immigration reform), while CBO does not.
Other major findings from CBO’s estimates include:
- Deficits would total $6.9 trillion over the next decade under the President’s budget, $2.4 trillion below current law (but $776 billion above OMB estimates)
- Net savings in the President’s budget are entirely attributable to $2.7 trillion of gross tax increases, partially spent on new spending and tax breaks.
- Annual deficits under the President’s budget would fall from $529 billion (2.9 percent of GDP) in 2016 to a low of $383 billion (1.9 percent of GDP) by 2018, before rising nearly continuously to $972 billion (3.5 percent of GDP) by 2026.
- Under the President’s budget, trillion-dollar deficits would likely return by 2027, five years later than under current law.
- Both revenue and spending under the President’s budget would be above ten-year current law and historical averages. Revenue would average 19.3 percent of GDP, compared to 18.1 percent under current law, while spending would average 22.3 percent of GDP, compared to 22.1 percent under current law. Over the last half-century, revenue and spending have averaged 17.4 and 20.2 percent of GDP, respectively.
Ultimately, CBO shows that while the President’s budget responsibly offsets new spending and produces additional deficit reduction to put the debt on a better path, it does not go far enough to reduce debt from its current post-war record-high level as a share of GDP. The budget needs to go further, particularly by slowing the growth of Social Security, Medicare, and Medicaid, to ensure a sustainable fiscal future.
Spending, Revenue, Deficits, and Debt under the President’s Budget
CBO estimates that under the President’s budget, debt would fall modestly from 75.4 percent of GDP in 2016 to 74.1 percent by 2018 before rising to 77.4 percent by 2026. In dollar terms, debt would rise from $13.9 trillion today to $21.4 trillion by 2026, a $7.5 trillion increase. CBO’s estimates are somewhat worse than OMB’s, which project debt levels of 75.3 percent of GDP by 2026, but CBO’s projections represent a significant improvement over CBO’s current law baseline, which estimates debt levels of 85.6 percent of GDP by 2026.

CBO’s projection of a rising debt path occurs because deficits would widen in the later years of the ten-year window, while they estimate economic growth would fall short of OMB’s projections. After declining to a low of 1.9 percent of GDP in 2018, deficits would rise to 2.5 percent of GDP just one year later and 3.5 percent by 2026. These deficits are an improvement over CBO’s current law deficit in 2026 of 4.9 percent by 2026 but higher than OMB’s estimated deficit of 2.8 percent of GDP in 2026.
CBO projects deficits would also fall and then rise under the President’s budget when measured in dollar terms. Specifically, they would fall from $529 billion in 2016 to $383 billion by 2018 before rising gradually to $972 billion by 2026. Trillion-dollar deficits would return by 2027.
Rising deficits in the President’s budget are the result of both spending and revenue growth over time. Spending would grow from 21.1 percent of GDP in 2016 to 23.0 percent of GDP by 2026, while revenue would rise from 18.2 percent in 2016 to 19.5 percent by 2026. Spending increases are driven by built-in growth under current law (mainly due to population aging and rising interest rates), while revenue increases are the result of policies put forward in the budget.
CBO projects spending under the President’s budget to be 0.1 percent of GDP lower than current law in 2026 (though above current law in all other years), while revenue is projected to be 1.3 percent of GDP higher than current law. Both spending and revenue would also be higher than historical averages of 20.2 percent and 17.4 of GDP, respectively.

Policy Changes in the President’s Budget
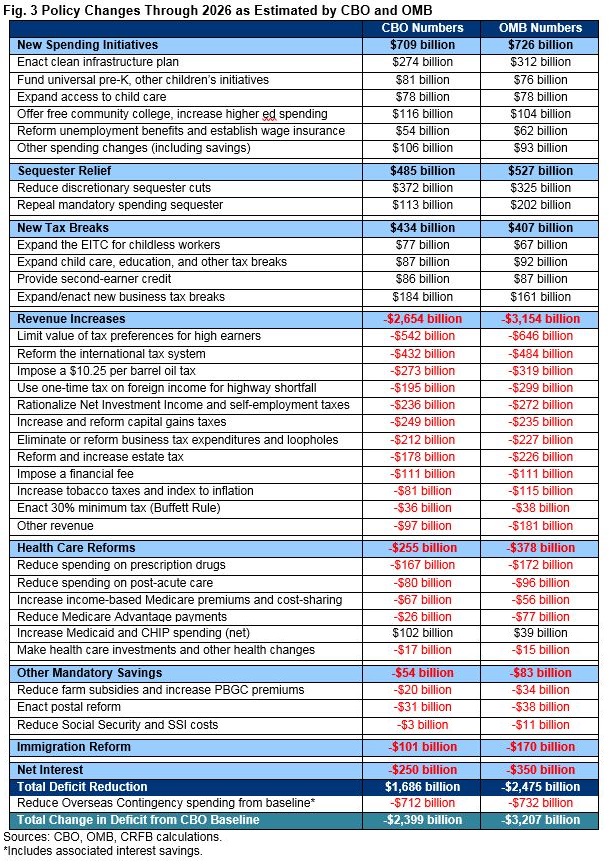
Excluding the drawdown of war spending, the President’s budget contains a total of $1.7 trillion of net deficit reduction through 2026, based on CBO’s estimates, which is about $800 billion less than the $2.5 trillion estimated by OMB. The total deficit reduction is the net result of about $2.7 trillion of new revenue, nearly $300 billion of spending reductions, $100 billion from immigration reform, and $250 billion in interest savings to pay for more than $1.2 trillion of new spending and $435 billion of new tax breaks.
We described the changes proposed in the President’s budget in our initial analysis of the budget in February (read the analysis in full here). Some of the biggest differences between CBO and OMB’s estimates come from CBO having lower revenue raised from the budget’s tax increases. These include the 28 percent limit on the value of tax preferences ($104 billion lower revenue), the one-time tax on un-repatriated foreign income ($104 billion lower), the other international tax changes ($52 billion lower), and the $10.25 oil tax ($46 billion lower)1. Some other differences include higher estimated costs for Medicaid and Children’s Health Insurance Program policies ($63 billion higher), lower estimated savings from Medicare Advantage changes ($51 billion lower), and a lower estimated cost for the clean infrastructure proposal ($38 billion lower).
Differences Between CBO and OMB Estimates
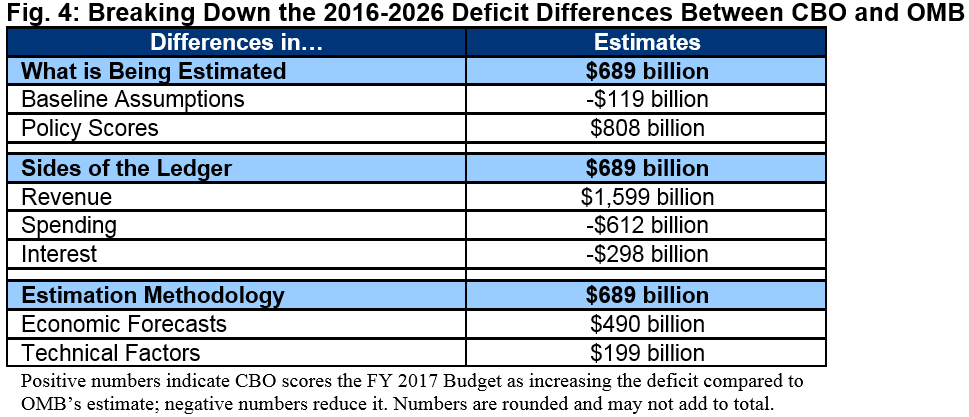
In total, CBO estimates 2016-2026 deficits under the President’s budget would be $689 billion higher than OMB’s estimate. This difference, along with 2.3 percent lower nominal GDP, is responsible for the 2.1 percent of GDP higher debt ratio projected by CBO. There are at least three ways to understand the source of the differences between OMB and CBO.
One way to understand the difference between CBO and OMB estimates is to determine how much is attributable to differing estimates in policy changes versus how much is attributable to differences in baseline projections prior to policy action. By our estimate, more than the entire difference – $808 billion – is attributable to policy change estimates. In fact, excluding policy changes, CBO’s baseline deficits would be $119 billion lower than OMB.2
Another way to understand the differences is to look at them by budget category. CBO estimates that the budget will have $1.6 trillion of lower revenue, $612 billion of lower primary spending, and $298 billion of lower interest spending than OMB estimates. In other words, CBO’s higher deficits are more than entirely driven by lower revenue estimates, with lower spending offsetting about half of that effect.
Finally, one can look at the source of the differences in assumptions. CBO’s more pessimistic economic projections – including GDP that is 2.3 percent lower in 2026 – explain $490 billion of higher deficits. Technical differences – which include things like demographics, program enrollment, and average benefits – increase CBO’s deficits above what OMB estimated by another $199 billion. Some of these differences are due to different conventions. For instance, OMB projects what the economy would look like with the President’s policies in place; CBO does not take them into account.
Conclusion
CBO’s analysis of the President’s budget generates similar findings to OMB’s, but it suggests a somewhat bleaker fiscal outlook – particularly in later years.
CBO shows that the President’s budget would commendably pay for all of the initiatives it proposes with real savings and include significant deficit reduction to prevent the sharp rise in debt that CBO projects over the next decade.
However, CBO’s analysis also shows that the budget includes too little net savings to reduce debt below today’s post-WWII record-high as a share of GDP. In fact, unlike OMB’s estimates, CBO finds the President’s budget would result in a small but continuous rise in deficit and debt levels after 2018, with trillion-dollar deficits returning by 2027.
While the President’s budget does include some important health reforms, it does not go far enough to put entitlement spending on a sustainable long-term path. It is particularly disappointing that even in his final budget, the President has no plan to shore up Social Security, a program within 15-20 years of insolvency.
On a positive note, the budget offers helpful deficit reduction policies and may set a minimum standard (roughly stable debt) for the next President to build from. We hope that many of the policies put forward by the President will be used by policymakers to address the unsustainable growth of the national debt – not simply to pay for new costly initiatives. And we would encourage policymakers to go beyond what the President’s budget proposes and pursue serious structural entitlement reforms that would help the long-term debt situation. This means not only identifying further health care reforms but also making Social Security sustainably solvent over the long term. In addition to tax reform and other spending cuts, these reforms will be necessary to put the country on a sustainable fiscal course for this and future generations.
Read the full paper as a printer-friendly PDF. (6 pp.)
1This paper originally cited CBO not counting savings from reducing the tax gap as one of the differences with OMB. However, CBO does count those savings; they are just considered non-scoreable for budget enforcement purposes. Both the text and Figure 3 have been modified to correct the original error.
2This assumes identical baseline conventions. Our “baseline assumptions” figure does not include policies which are included in the baseline (such as the Administration’s war drawdown) or the treatment of sequestration after 2021. Those differences in policy estimates are counted with the other changes in policy.
