Hindsight is 20/20: A Look Back at CBO's Economic Forecasting
Our recent blog "Putting the Debt on a Downward Path" emphasizes how changes in economic projections can affect the budget for better or for worse. Deviations from previous CBO economic projections can have a huge effect on budget estimates (a good example can be found here) - higher than expected economic growth means higher revenue and lower spending on safety net programs, which in turn leads to lower deficits and a better debt path. In that light, CBO has updated its evaluation of its own economic forecasting record, an exercise that they have done every few years.
The report identifies four key sources of forecasting error: turning points in business cycles, changes in productivity trends, fluctuations in crude oil prices, and revisions to historical data. The first and last points have been especially key in the past few years. For example, in CBO's September 9, 2008 baseline, their economic projections had real GDP growth slowing in 2008 and 2009 but remaining positive and unemployment rising but plateauing at just above six percent. Of course, one week later Lehman Brothers collapsed, which intensified the financial crisis and consequently had significant effects on the economy. Economic growth turned out to be negative on an annual basis in 2008 and 2009, and unemployment has not been below six percent since 2008. Also, historical revisions to GDP data a few years later showed that the economic downturn was more severe than previously thought, which affected projections going forward. Another source of error is changes in fiscal policy that would not have been accounted for at the time in forecasts. That error could be particularly acute with their 2012 forecasts (which assumed the fiscal cliff), but that is not reflected in this data set.
CBO evaluates its two-year forecasting record on a number of economic variables from 1982-2010. Looking at the mean error, CBO slightly underestimated real GDP growth over that period but overestimated just about every other economic variable -- such as inflation, interest rates, and wage and salary growth -- to varying degrees. Their greatest overestimates came in estimating interest rates and wage and salary growth.
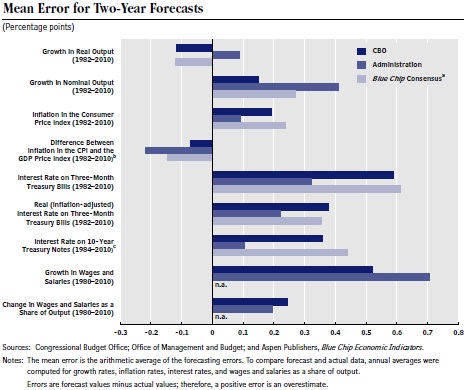
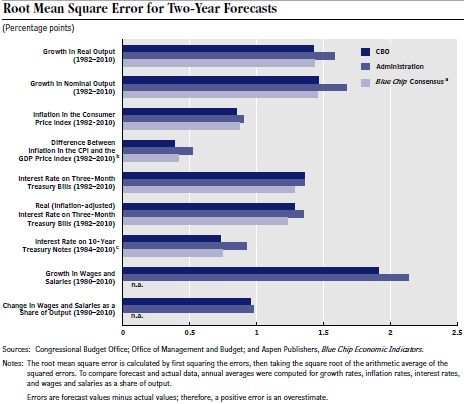
Mean error, though, is only useful for telling the direction of error, not necessarily the magnitude. As an example, projection errors of +2 percent and -2 percent would result in a mean error of zero, which would tell little about the accuracy of the projections. To better assess accuracy, CBO also calculates the root mean square error, which squares the errors, averages them, and then takes the square root of the result.
When looking at root mean square error, CBO finds that it has done relatively well in projecting inflation (likely because it was relatively stable in this period) and the change in wages and salaries' share of GDP but less well in projecting interest rates and GDP growth. Compared to OMB and the Blue Chip consensus, CBO has performed slightly better than OMB and about the same as Blue Chip.
CBO also looks at their five-year forecasting record. It notes that these forecasts are less likely to be affected by cyclical factors than two-year forecasts and more by structural aspects of the economy such as productivity, potential GDP growth, and the GDP share of wages and salaries. In terms of accuracy, their five-year forecasts are slightly more accurate than their two-year forecasts and just about in line with other forecasters' accuracy. CBO has done well in projecting rates of inflation, but they do less well in projecting statistics related to wages and salaries.
Kudos to CBO for making public their projection accuracy over the years. Not only should the report help the public and the agency understand where and how they have erred, but it also should serve as a reminder that budget projections, particularly those far out into the future, are nearly certain to change.


