CBO's New One-Stop Shop for Federal Spending on Health Insurance Coverage
CBO's March baseline is typically a brief update of budget projections for the next decade, but this year CBO has provided a new comprehensive look at insurance coverage for the non-elderly population. The report (and tables) evaluates the sources of health insurance and federal insurance subsidies for people under age 65.
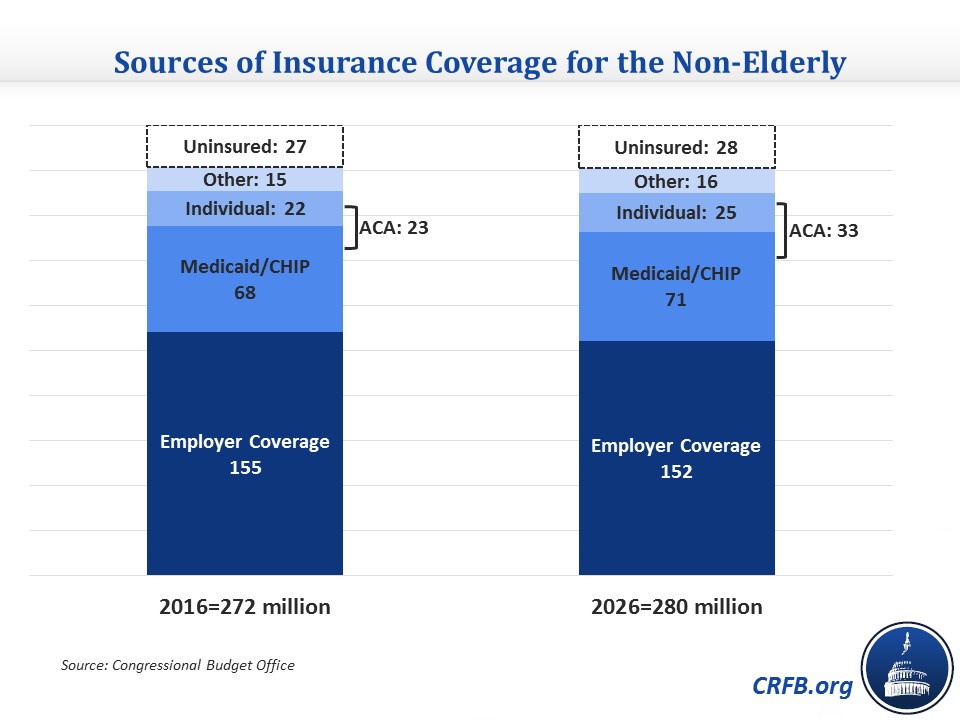
Employer-based coverage remains the largest source of insurance coverage, accounting for 155 million of the 244 million insured in 2016, or nearly two-thirds, while Medicaid and the Children's Health Insurance Program ("CHIP") cover 68 million people, or just over one-quarter of the insured population. Although the Affordable Care Act ("Obamacare") expanded coverage through Medicaid and the health insurance exchanges it only increased net insurance coverage by 23 million, accounting for 9 percent of the insured. Other sources, including Medicare, cover the remaining 15 million insured. Twenty seven million people are currently uninsured. CBO expects this distribution of coverage to remain relatively stable over the next decade albeit with a slight shift from employer coverage to individual coverage.
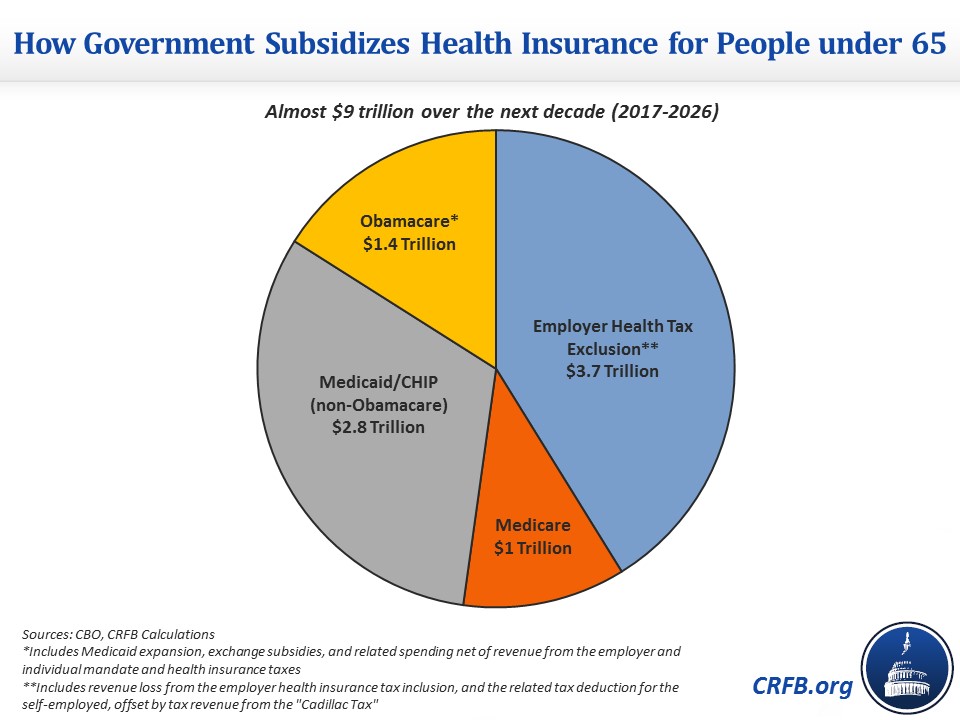
While employer-sponsored coverage is by far the biggest source of health insurance for those under 65, it is roughly tied with the Medicaid program as the most costly for the federal government. The tax preference for employer-provided health insurance is projected to cost $3.7 trillion over the next decade, whereas Medicaid and CHIP are projected to cost $3.8 trillion. Excluding Medicaid expansion under Obamacare, Medicaid and CHIP will cost $2.8 trillion. New costs from Obamacare including spending on Medicaid expansion and exchange subsidies minus employer and individual mandates and health insurer taxes will total $1.4 trillion -- about one-sixth of total health insurance spending for those under 65. Medicare spending on the disabled and those with end-stage renal disease will cost about $1 trillion.
In terms of per-person subsidy cost, employer coverage has the lowest at about $1,730 per person in 2016, likely because the subsidy is more indirect than the others. Health exchange subsidies cost about $3,330 per person, and Medicaid and CHIP spend more than the previous two at $4,100 per person because the programs cover most of beneficiaries' medical expenses (the ACA portion of Medicaid is more expensive per person). Other sources of insurance, mostly Medicare, cost about $4,580, higher than the other three sources in part because Medicare's non-elderly beneficiaries who are either disabled or have end-stage renal disease have more costly health needs. Over the next decade, each source of insurance is projected to see its per-person subsidy rise by between 50 and 80 percent.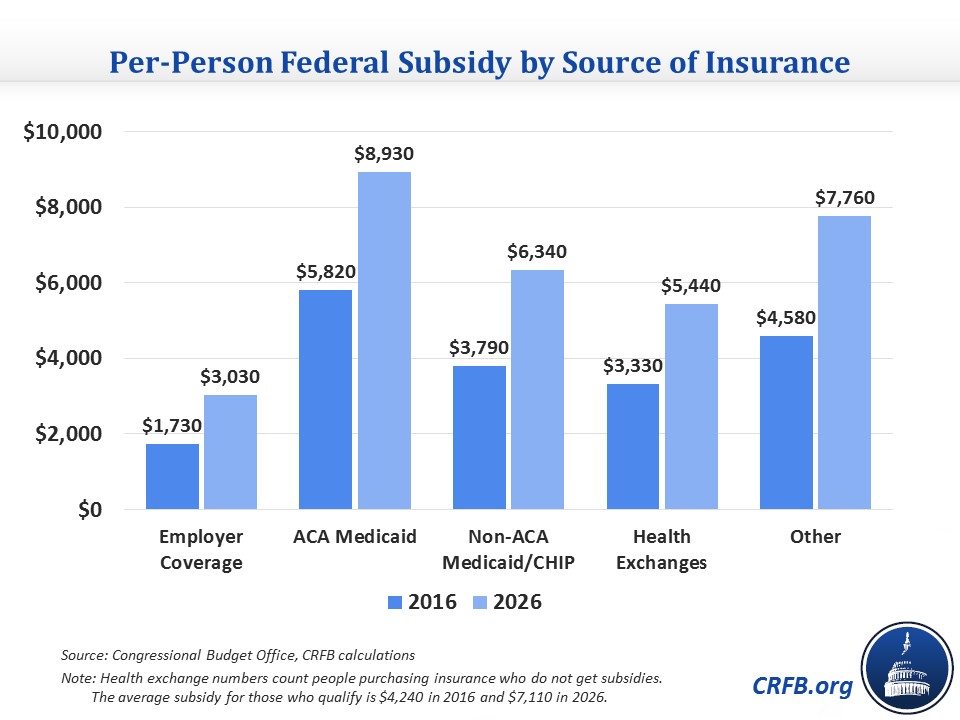
These numbers only account for spending on the under-65 population. Adding in Medicare and Medicaid spending on the elderly population would nearly double the total amount of 2017-2026 subsidies to $17.2 trillion, or 7.4 percent of GDP (there would also be a small amount of employer coverage subsidies, but data do not appear to be publicly available).
CBO's report goes beyond its typical data to show the full scope of federal health insurance subsidies on spending and revenue. This helpful resource allows us to better understand the large amount of money involved in the variety of ways that the federal government has increased insurance coverage.