CBO Shows Social Security is in Financial Trouble
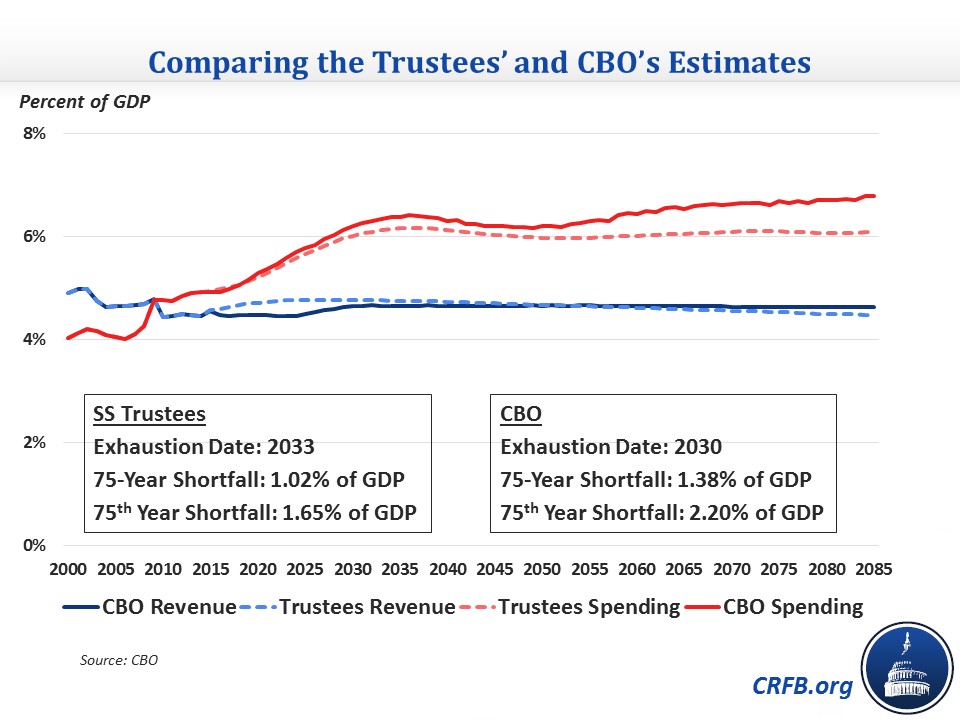
It is clear that Social Security faces financial challenges. This year, its own Trustees estimated the combined trust funds would run out of reserves in 2033 while CBO estimated a 2030 exhaustion date. But yesterday, CBO released a more detailed set of numbers, which show their projections of year-by-year revenue and spending, along with a range of other possible outcomes. The results aren’t pretty.
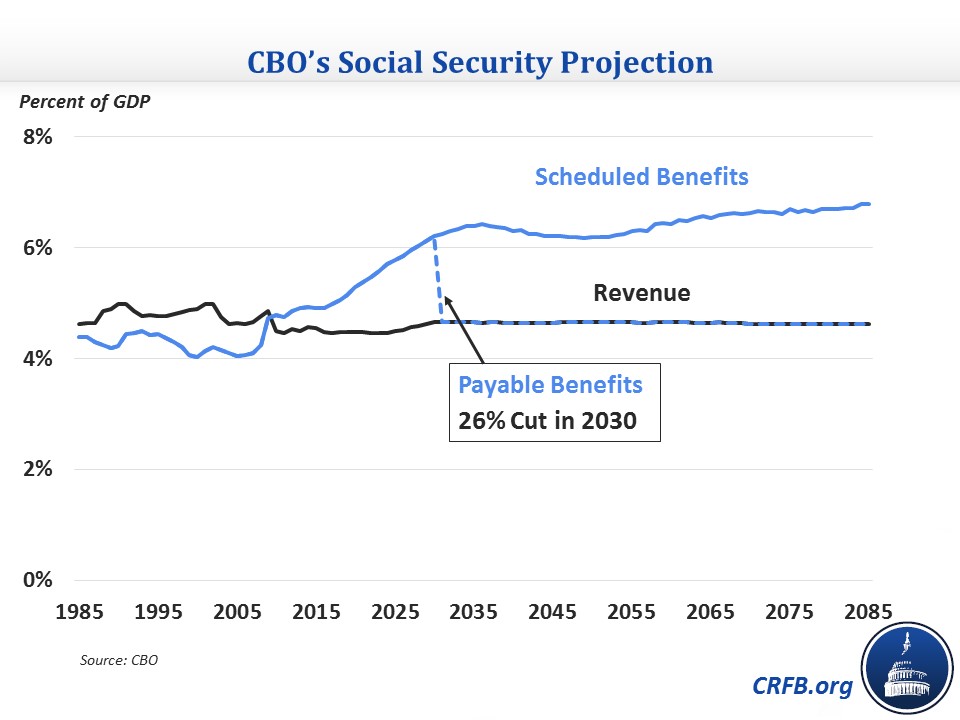
CBO estimates that the Disability Insurance trust fund will run out during FY 2017 and the Old Age and Survivors' Insurance trust fund would run out in 2032. If lawmakers patched up SSDI by reallocating revenue from OASI, the combined trust fund will run out in 2030, at which point benefits would be cut by 26 percent.
The exhaustion of the trust fund is caused by a large run-up in spending over the next few decades while revenue rises only slightly. As a percent of payroll, outlays have already risen significantly from 10.4 percent in 2000 to 13.8 percent in 2014, both a factor of higher spending and relatively slow payroll growth. Going forward, outlays will continue to rise, exceeding 18 percent in 20 years and 20 percent in 75 years, almost twice as much as was spent in 2000. Meanwhile, revenue will creep up only slightly from 12.8 percent of payroll in 2014 to 13.6 percent in 75 years.
As a percent of GDP, outlays would rise from 4.9 percent in 2014 to 5.7 percent in 2024 and 6.4 percent by the mid-2030s. After dipping slightly, spending would rise again, reaching an all-time high of 6.9 percent 75 years from now. Revenue would stay fairly flat at 4.6 percent.
Even though some variables are uncertain, the main cause of the rise in spending – the retirement of the baby boom generation – is well-known and predictable. Thus, there is not a single CBO simulation that allows Social Security to avoid exhaustion without changes by the 2060s, and there is a 90 percent chance that it would run out of funds by 2036.
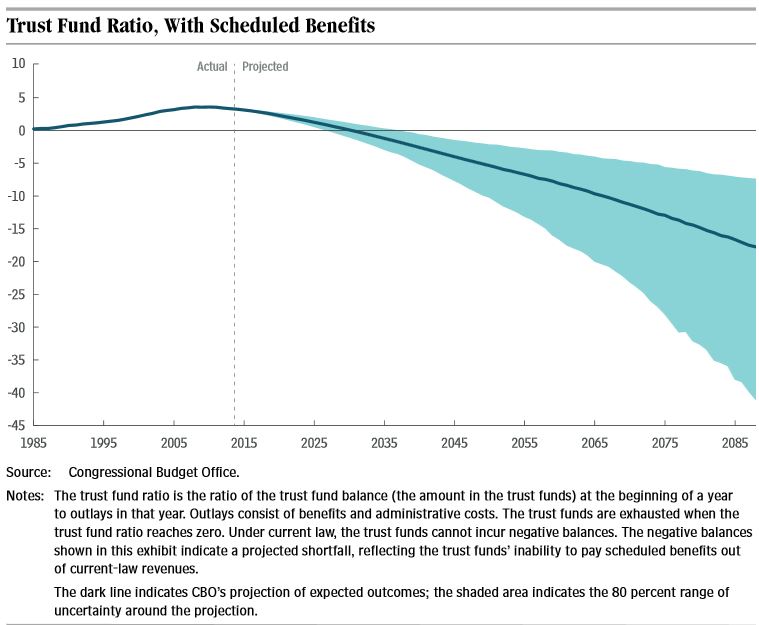
There is also significant uncertainty surrounding the size of the projected shortfall. At the 10th percentile (where 10 percent of simulations show lower shortfalls), the 75-year shortfall would be a still-sizeable 0.9 percent of GDP. But the 90th percentile shows a large gap of 2.1 percent. The 75th-year deficits range from 0.7 percent of GDP on the low end to 2.2 percent as the median scenario and 4.8 percent in the high range. Notably, even in the low-deficit scenario, cash-flow surpluses do not return at any point.
| Social Security Financial Estimates (Percent of GDP) | |||
| Low Range | Intermediate Range | High Range | |
| Exhaustion Date | 2026 | 2030 | 2035 |
| 75-Year Shortfall | -0.9% | -1.4% | -2.1% |
| 75th Year Deficit | -0.7% | -2.2% | -4.8% |
Source: CBO
Note: Low and high range represent 10th and 90th percentiles of CBO's simulations.
CBO estimates that much bigger changes would be needed to make the program sustainably solvent by closing the deficit in the 75th year. CBO estimates a 75-year shortfall equal to 4 percent of taxable payroll, or 1.4 percent of GDP, while the Trustees project of 2.9 percent of payroll or 1 percent of GDP. Most of the difference is due to CBO's higher life expectancy projections, which cause differences in spending to grow over time.
Both CBO and the Trustees show a need to address Social Security before the trust fund runs out of money in the next few decades. Plus, the Disability Insurance trust fund faces a more immediate cliff in just two years, which is why the SSDI Solutions Initiative will explore solutions for the program. Hopefully, lawmakers will use this deadline to make the entire Social Security system solvent, because waiting to make changes will only make things more difficult.


