CBO Breaks Down the Generational Distribution of the Budget
When talking about the debt, it is hard to avoid also talking about generational inequity. Many groups, especially the Can Kicks Back, have worked to highlight how our unsustainable debt path will especially hurt younger generations if lawmakers do not take action. But a new report released by CBO last week shows quantitatively how much of the federal government's resources go to the elderly.
In our first look at the report, we will take a look at the types of households that pay federal taxes and receive federal spending. Additional posts will dive deeper into the distribution of federal spending and revenues by income groups.
The CBO report analyzes the distribution of federal spending and transfers for FY 2006, the most recent year when comprehensive data is available. As a note of caution, however, data from 2006 will not perfectly show today's federal budget because lawmakers have enacted many notable changes to federal taxes and spending since that time and an economy that is still recovering continues to affect how revenues and spending are allocated. Nevertheless, the report is still very insightful.
Not surprisingly for regular readers of The Bottom Line, seniors disproportionately benefit from the federal government after taking into account taxes and transfers. Elderly households on average receive $14,000 more than they contribute in taxes, while tax payments exceeded transfers by $17,000 for nonelderly households with children and by $16,000 for nonelderly households without children. When including other goods and services with transfers, average spending minus taxes was nearly $20,000 for elderly households, while nonelderly households were closer to breaking even.
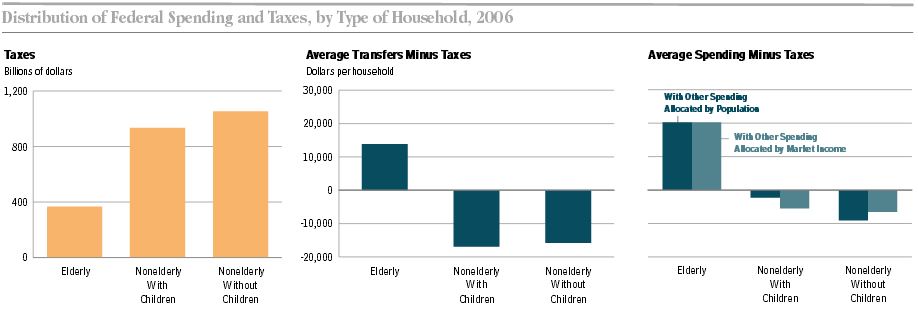
Source: CBO
Of course, much of this overall transfer to the elderly is due to Social Security and Medicare. Most spending on cash transfers and health care is directed at the elderly, even though they do not represent a majority of households. Spending on other goods and services otherwise is mostly directed at nonelderly households.
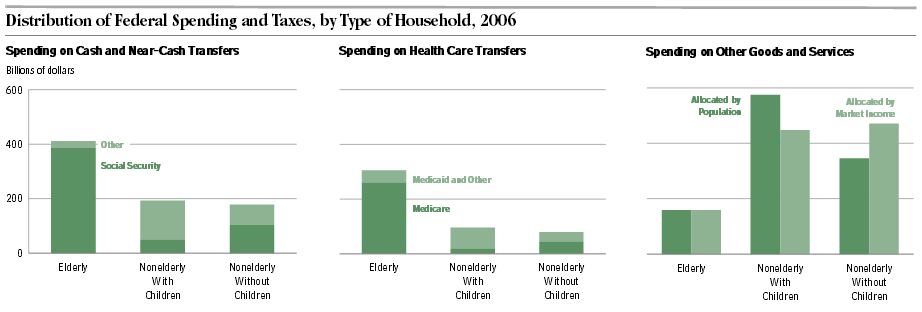
Source: CBO
After seeing the distribution of spending and taxes between elderly and non-elderly groups, some observers may ask: But haven't workers "paid for" these retirement benefits over their working lives, making this distribution of spending not surprising? It's a good question, but according to a previous analysis by Eugene Steuerle and Caleb Quakenbush of the Urban Institute, Social Security taxes largely compensate for benefits later in life for medium and higher-income households but Medicare benefits far exceed taxes paid in -- and this gap will only grow for future cohorts. For a two-earner couple both making the average wage ($44,600) that turned 65 in 2010, lifetime Social Security taxes at $612,000 exceeded lifetime benefits at $583,000, but lifetime Medicare taxes at $122,000 were far below lifetime Medicare benefits at $387,000. Other types of households differ slightly, but generally benefits are close equaling taxes for Social Security, but Medicare is significantly underfunded.
It's also worth noting that CBO's analysis only refers to federal spending, and therefore disregards most of the costs of K-12 education spending, road construction and maintenance, and other state and local spending along with state and local government financing streams. After incorporating state and local spending, the Kid's Share reports from the Urban Institute show that the overall contribution from government is much more balanced across age groups. Still, entitlement spending that mostly goes to seniors will boom in the decades ahead, when there is less indication that spending targeted to children will grow. If sequestration is continued, the proportion of spending that goes to younger generations may in fact be cut. Our post last week noted that a significant portion of the budget can be thought of going to "insurance programs," like Medicare, Medicaid, and Social Security. Over the past few decades, the "insurance conglomerate" portion of the budget has been displacing everything else, and this trend is projected to continue.
Some of the budgetary trends inevitably result from population aging and more seniors beginning to retire -- some expansion of these programs was expected. However, if entitlements continue to grow and the federal debt is not addressed -- there may be little left for key investments in the nation's future and the younger generations. How much of the federal government's resources should go to different age groups is a question for lawmakers and the public, but they should remember that tough choices will eventually need to be made and that projections show our current policies cannot continue forever. Stay tuned for a second look this week when we turn to the overall distribution of federal spending and taxes by income level.
Click here to read the full report.