Report: Analysis of CBO’s January 2016 Budget and Economic Outlook
The Congressional Budget Office (CBO) released its January Budget and Economic Outlook, today, adding more detail to a brief summary released on January 19. These budget projections show that the era of declining budget deficits is over, with deficits projected to rise by over $100 billion this year and exceed $1 trillion by 2022. CBO also projects the debt will continue to rise well above today’s record-high levels, growing unsustainably. The report shows:
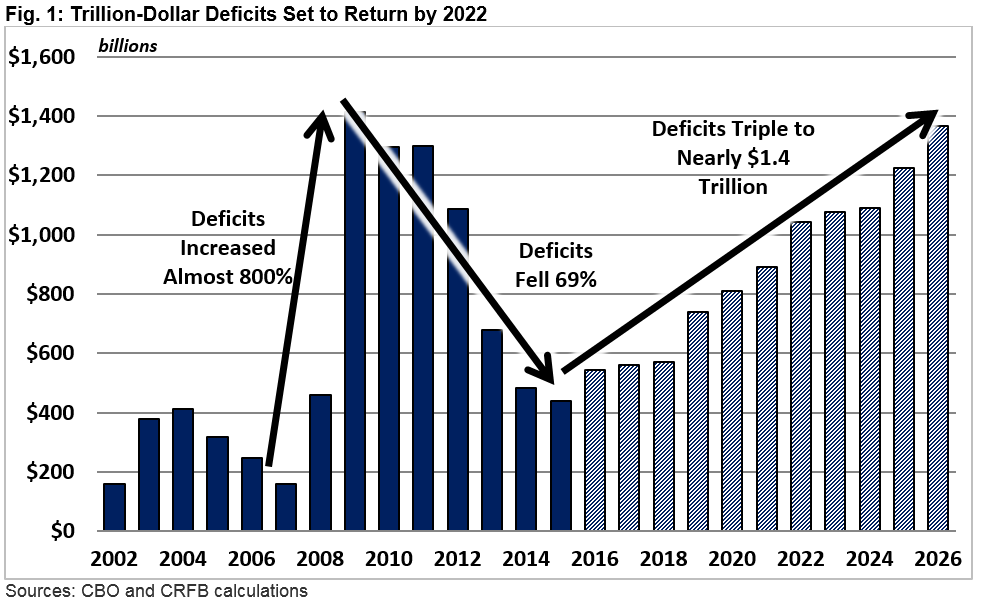
- The deficit will grow from $439 billion (2.5 percent of GDP) in 2015 – the lowest levels since 2007 – to $544 billion (2.9 percent of GDP) in 2016.
- By 2026, deficits will double as a share of GDP to 4.9 percent and more than triple in dollar terms to $1.37 trillion.
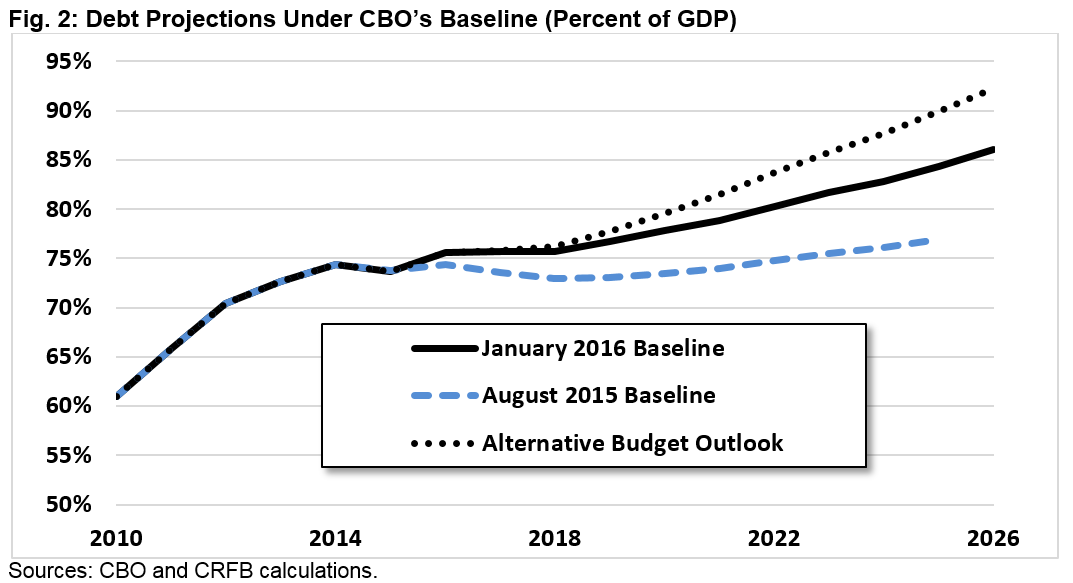
- CBO projects debt will rise by $10.7 trillion between 2015 and 2026, from $13.1 trillion (73.6 percent of GDP) to $23.8 trillion (86.1 percent of GDP). Previously, CBO projected debt rising to $21 trillion (77 percent of GDP) by 2025.
- These projections are significantly worse than previous projections, with deficits $130 billion higher in 2016 and $1.55 trillion higher through 2025.
- About half of the deterioration in the fiscal outlook is from legislative changes, mainly December’s unpaid-for tax extenders and omnibus legislation.
- Although fiscal irresponsibility has worsened the budget outlook, the long-term driver of rising debt remains the rapid growth of entitlement spending and interest on the debt. CBO projects 83 percent of the $2.7 trillion spending rise between 2015 and 2026 is from Social Security, health care, and interest.
- The budget outlook could be even worse than projected if lawmakers continue to pass legislation without truly offsetting its costs. For example, if lawmakers fully repeal (and don’t offset) future “sequester” cuts, continue various temporary tax breaks, and repeal the Affordable Care Act taxes delayed last December, debt would rise well beyond the projected $23.8 trillion (86 percent of GDP) by 2026, to $25.5 trillion (92 percent of GDP) in that year.
Last year, lawmakers took for granted temporarily declining deficits and added significant new borrowing. In part as a result, rising deficits have now returned, and the debt is on an even more unsustainable path than previously projected. Hopefully, the newest projections will serve as a wakeup call for serious action on spending and tax reform in order to put the debt to a downward, sustainable path.
Here, we have updated our January 19 analysis to also include information about the drivers of projected spending growth, CBO’s economic forecasts, and the drivers of the worsening fiscal outlook as compared to CBO’s August 2015 baseline.
Spending, Revenue, Deficits, and Debt
While deficits have declined considerably since their 2009 peak, that trend will reverse itself after 2015. The decline of deficits had been largely due to the economic recovery, continued low interest rates, and deficit reduction efforts. However, with borrowing on the rise, the era of declining deficits is now over, and trillion-dollar deficits will return by 2022.
Moreover, as a result of last year’s fiscally irresponsible legislation, a weaker economic outlook, and technical changes, deficits through 2025 are now expected to be $1.5 trillion higher than in CBO’s most recent projections from August.
According to CBO, the deficit will rise by more than $100 billion between 2015 and 2016 – nearly a quarter – and continue to rise every year thereafter. Specifically, the deficit is expected to rise from $439 billion (2.5 percent of GDP) in 2015 to $544 billion (2.9 percent of GDP) in 2016, $1.04 trillion (4.4 percent of GDP) in 2022, and $1.37 trillion (4.9 percent of GDP) in 2026. Thought of another way, deficits will double as a share of GDP and triple in nominal dollars.
Outside of the Great Recession and its immediate aftermath, the 2026 deficit will be the highest ever in nominal dollars and the third-highest deficit as a share of GDP since World War II.
CBO projects debt held by the public will also rise dramatically, from $13.1 trillion at the end of 2015 to $17.8 trillion by the end of 2021 and $23.8 trillion by the end of 2026 – a $10.7 trillion increase. As a share of the economy, debt will rise from below 74 percent of GDP in 2015 – more than twice what it was in 2007 – to almost 79 percent by 2021 and 86 percent by 2026. Debt would therefore reach more than twice its 50-year historical average of less than 40 percent and be significantly higher than at any point in history other than around World War II.
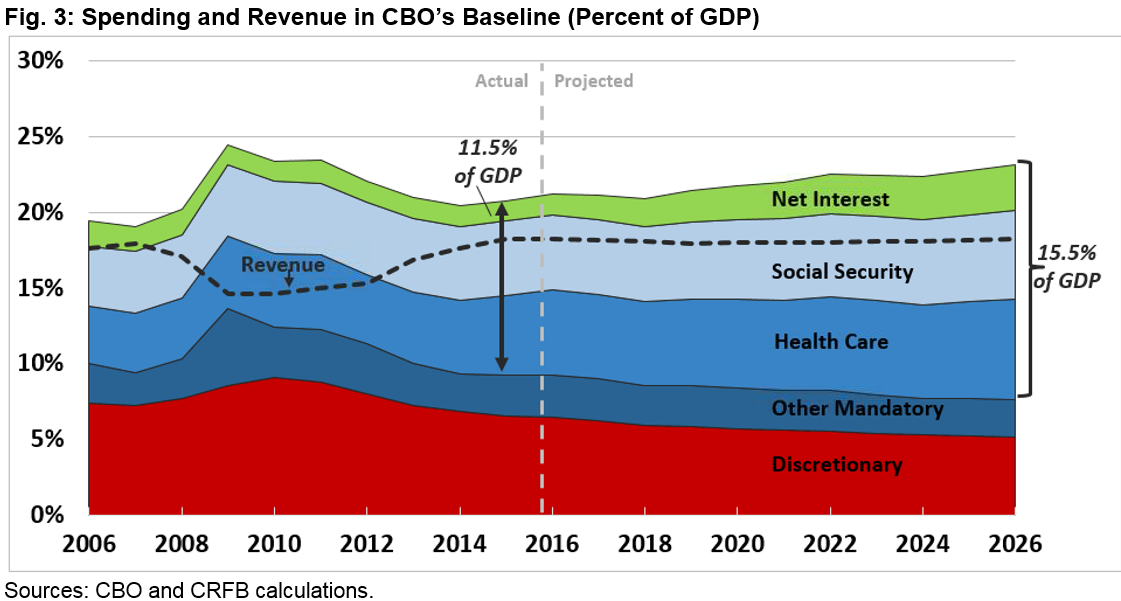
Underlying the increases in debt are higher spending and stagnant revenue projections. CBO estimates spending will grow from 20.7 percent of GDP in 2015 to 23.1 percent of GDP in 2026, much higher than the historical average of 20.2 percent. This spending growth is largely the result of an aging population, rising health care costs, and rising interest rates.
Based on CBO projections, Social Security, federal health care spending, and net interest are responsible for 83 percent of the $2.7 trillion growth in annual spending between 2015 and 2026. Social Security and health care by themselves represent about three fifths of this growth, while interest on the debt is responsible for over one fifth. This means that growth in all other areas of the government – including defense spending, welfare, food stamps, education, federal employment, farm subsidies, foreign aid, and others – are only responsible for less than a fifth of the nominal growth in spending.
As a share of GDP, this trend is even more pronounced, with Social Security, health spending, and interest responsible for far more than the entirety of the spending increase. Specifically, while total spending will grow by 2.4 percent of GDP between 2015 and 2026, Social Security will grow by 0.9 percent of GDP, health spending by 1.4 percent of GDP, and interest – the fastest growing part of the budget – will grow by 1.7 percent of GDP. All other spending will actually shrink as a share of the economy by a combined 1.6 percent of GDP.
Revenue, meanwhile, will remain virtually flat as a share of the economy over the next decade at around its current level of 18.2 percent of GDP. While individual income tax revenue will rise from 8.7 percent of GDP in 2015 to 9.6 percent by 2026, other sources of revenue will fall by an equal amount. Overall, revenue will remain modestly above the 50-year historical average of 17.4 percent of GDP.
Compared to the most recent baseline update in August 2015, the budget outlook is significantly worse in both nominal dollars and as a share of the economy. For example, debt in 2025 is projected to reach $22.4 trillion or 84.3 percent of GDP under current projections, compared to $21 trillion and 76.9 percent of GDP in CBO’s August projections.

Importantly, these projections are based on CBO’s current law baseline, which assumes Congress and the President do not continue to enact deficit-financed tax and spending packages like they have in recent years and did so especially in 2015. Were Congress to cancel future spending reductions from “sequestration,” continue those temporary tax breaks not made permanent in the recent extenders package, and permanently repeal the Affordable Care Act (“Obamacare”) taxes delayed in the recent package, an additional $1.7 trillion would be added to the debt by 2026. As a result, debt would rise from 74 percent of GDP last year to 92 percent by 2026.
Economic Projections1
In addition to updated budget projections, today’s report also includes CBO’s latest economic projections, which similarly show a gloomier picture than their previous estimates. In turn, the lower projections increase cumulative deficit projections through 2025 by $437 billion. Economic growth will be lower than previously projected, but so will unemployment and inflation.
Although these projections do not incorporate the very latest data, CBO generally projects the pace of the economic recovery to be moderately healthy this year and next but to slow over the next few years. Thereafter, the economy will grow at a relatively slow and steady pace.
CBO estimates real economic growth of 2.3 percent in 2016, 2.6 percent in 2017, and an average of 2.1 percent over ten years. By 2023, CBO projects an annual growth rate of 2.0 percent, which is about 0.1 percent lower than in prior projections. With this change in economic growth and other changes in inflation, nominal GDP is projected to be 2.7 percent smaller in 2025 than projected in August.
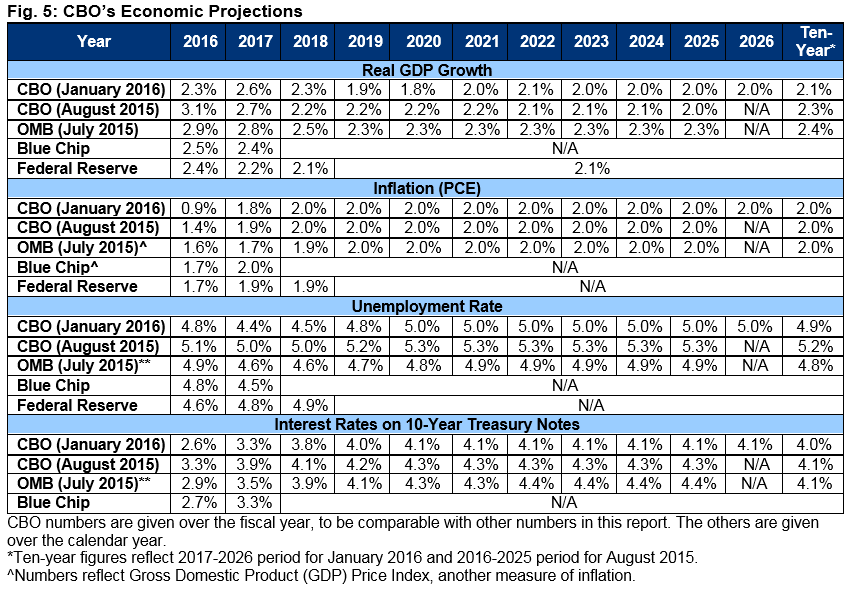
Meanwhile, CBO projects the unemployment rate to continue its rapid fall in 2016 and 2017 bottoming out at 4.4 percent, notably lower than the 5 percent bottom predicted as recently as last August, though higher than its potential. By 2020, CBO assumes unemployment will return to just above its natural rate over the business cycle – at 5.0 percent – rather than the 5.3 percent level projected in August.
For inflation, CBO estimates the price index for personal consumption expenditures – which grew only 0.5 percent in 2015 – to grow by 0.9 percent in 2016 and by 2.0 percent per year from 2018 onward.
Finally, interest rates will begin to rise once again after the Federal Reserve announced in December that they would start raising the targeted federal funds rate, but they will do so at a slower pace than previously projected. CBO projects rates on three-month and ten-year Treasuries to rise from 0.1 and 2.2 percent, respectively, in 2015, to 3.2 and 4.1 percent in 2020 and throughout the rest of the ten-year window. This is lower than in previous projections; for example, in August, CBO projected the ten-year rate to reach 4.3 percent.
The report’s economic estimates were completed late last year and exclude some positive economic reports that were published since December, as well as the enactment of a year-end bill setting discretionary spending and continuing many expired tax breaks. If these economic effects were included, GDP would likely be slightly larger in the near-term, while long-term economic growth might be very slightly slower.
Changes in the Budget Projections
CBO’s latest budget projections are significantly worse than prior estimates. Ten-year deficit projections are now $9.38 trillion, nearly $2.4 trillion higher than in CBO’s August report. Perhaps more meaningful is the change in projections over a fixed budget window. From 2016 through 2025, deficits are projected to be $1.55 trillion higher than in CBO’s August projections as a result of $1.23 trillion less in revenue and nearly $325 billion more in spending.
About half of this deterioration – roughly $750 billion – is the result of legislative changes. In particular, the tax extenders package added $680 billion to deficits – before interest – through reduced revenue and increased spending on refundable tax credits. Discretionary spending increases enacted in the Bipartisan Budget Act (BBA) and omnibus appropriations bills added more than $105 billion to spending. In addition, the defense authorization’s reforms to the military retirement system will add $30 billion to spending, though they are expected to reduce spending over the long term. Other legislative changes – including changes in spending on overseas contingency operations and offsets from the BBA and the highway bill – reduced CBO baseline deficits by about $205 billion, though most of this change is due to gimmicks and baseline quirks.2 All of these changes come on top of a permanent and largely unpaid for “Doc Fix” bill, passed in April, which added roughly $160 billion to the debt but was incorporated into the August baseline.
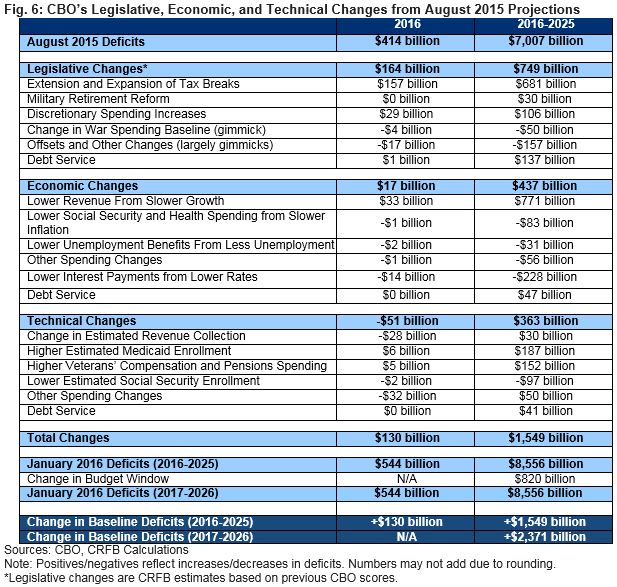
Changes in economic projections are also responsible for a large share of the deterioration in the deficits – more than $435 billion through 2025. With GDP growth about 0.1 percent slower per year and inflation slightly slower during the next two years, CBO now projects about $770 billion less in revenue. Partially offsetting this loss is about $335 billion less in spending. Nearly $230 billion of this is the result of lower projected interest rates, while the remainder largely stems from lower health care payment updates, lower unemployment benefits, and lower cost-of-living adjustments.
Finally, CBO estimates that technical changes will raise ten-year deficits by about $365 billion, primarily due to increasing outlays. Most of the increased spending – $340 billion – comes from higher-than-expected enrollment in Medicaid through the Affordable Care Act and an expanded population of veterans who are eligible for veterans’ disability benefits.
Conclusion
In many ways, CBO’s latest projections confirm what should have been expected at the end of 2015: ignoring fiscal responsibility in order to pass tax extenders and other policy preferences without paying for them will drive up the debt. But due to economic changes and other factors, debt is now projected to rise even faster than the passage of irresponsible legislation alone would suggest.
Whereas prior projections suggested the debt would rise from just below post-war record-high levels of 74 percent of GDP last year to 77 percent by 2025, CBO now projects debt will grow to 86 percent of GDP by 2026 – and deficits will reach near their all-time record levels of $1.4 trillion in that year.
Such debt growth is ultimately unsustainable, and it could have serious economic consequences in the meanwhile. Moreover, the debt situation could be even worse if lawmakers continue on the path of fiscal irresponsibility undertaken in 2015. By one measure, debt could reach 92 percent of GDP by 2026 under that scenario.
Download the full paper as a printer-friendly version
Update 1/26/16: The initial version of this paper stated the percent of nominal spending growth that is due to Social Security, health care programs, and interest as 90 percent. That was for gross health care programs. The paper has been updated to reflect offsetting receipts and now refers to net health care spending. The correct figure is 83 percent.
Update 2/1/16: While we previously corrected for net health care spending (see below) we neglected to update the rest of the statistics in the paragraph in the “Spending, Revenue, Deficits, and Debt” section that relied upon that change. That has now been corrected.
1 In updating this section, CRFB switched from presenting fourth quarter over fourth quarter data to instead presenting fiscal year averages.
2 For example, CBO’s baseline assumes unfinanced highway spending continues and war spending grows with inflation regardless of the drawdown underweight – and therefore counts what is essentially an increase in war spending as a reduction while not counting an increase in current law highway spending. As another example, CBO counts a transfer of reserve from the Federal Reserve to Treasury – which it describes as increased “remittances to the Treasury from the Federal Reserve” – as deficit reduction.


