Injecting Price Competition into Medicare Part B Drugs
Medicare Part B, which covers outpatient physician services, pays for physician-administered drugs by reimbursing physicians the average cost for each specific drug, plus a 6 percent add-on percentage of that cost. This arrangement creates misaligned incentives that blunt price competition and advantage higher-priced drugs — especially within drug classes that have clinically comparable options but a wide variation in prices.
As part of the Health Savers Initiative, this paper presents an option to implement “clinically comparable drug pricing,” where Medicare payments for physician-administered drugs would be set at a single price for groups of drugs within the same therapeutic class. That price would be set at the weighted average of prices manufacturers charge for each of the clinically comparable drugs.
This reform should encourage physicians to administer lower cost drugs and manufacturers to lower prices to maintain market share. The policy would reduce Medicare costs and would likely result in savings for Medicare Advantage plans and commercial payers.
Over the next decade (2021-2030), this policy could achieve substantial savings.
- In just three drug classes, it could reduce total (gross) Medicare spending by at least $122 billion
- That includes $56 billion of savings to fee-for-service Medicare, $37 billion in lower beneficiary premiums and cost-sharing, and $29 billion in savings for the Medicare Advantage program
The policy would also generate private sector spillover savings. For example, in the rheumatoid arthritis class of drugs, the policy could:
- Reduce commercial drug costs by at least $21 billion
Given the high and rising costs of health care, a number of bold policy changes will be needed to assure long-term affordability and sustainability. Leveraging competition among clinically equivalent drugs should prove an attractive option to policymakers.
The Health Savers Initiative is a project of the Committee for a Responsible Federal Budget, Arnold Ventures, and West Health, which works to identify bold and concrete policy options to make health care more affordable for the federal government, businesses, and households. This brief presents an option meant to be just one of many, but it incorporates specifications and savings estimates so policymakers can weigh costs and benefits, and gain a better understanding of whatever health savings policies they choose to pursue.
The Case for Clinically Comparable Drug Pricing
The Medicare Part B program covers the cost of drugs that require administration in a doctor’s office or hospital outpatient department. While many conditions for which physician-administered drugs are used have only a single therapeutic option, others are in drug classes with multiple interchangeable therapies. Yet the Medicare payment system bases payment for each of the interchangeable therapies separately without creating incentives for physicians to select the lowest-cost therapeutic alternative or for manufacturers to compete on price within these drug classes. This failure increases costs to Medicare, and because beneficiaries face coinsurance costs of 20 percent (or purchase expensive supplemental insurance to cover these payments), their costs are higher as well.
Doctors purchase these drugs for their patients and get reimbursed by Medicare based on 100 percent of the average sales price (ASP) plus an additional 6 percent. The ASP for the drug is the average price realized by the manufacturer for sales in all public-sector and private-sector markets, net of most rebates, discounts, and price concessions. The 6 percent add-on is supposed to cover storage and handling costs as well as covering drug costs for doctors unable to purchase the drugs at the ASP or lower. Doctors are also paid a separate fee for administering the drug.
Physicians do have some incentive to purchase any given drug at the lowest available price because reimbursements are fixed at 106 % of the ASP, making it profitable if they obtain the drug at a lower price. However, between drugs, physicians may have an incentive to administer more expensive drugs if they can obtain those drugs with a similar discount. The 6 percent addition to ASP they will be paid is larger for those more expensive drugs (e.g., 6 percent of a $9,000 drug is $540 compared to $12 for a $200 drug).
In 2019, Medicare paid about $37 billion for Part B drugs, with spending highly concentrated among just a few products. Just 25 Part B drugs – 4 percent of those available – consume 63 percent of Part B drug spending.1 The top 10 drugs represent 43 percent of spending. Spending in this category has been rising at an annual rate of about 12 percent per year, mostly due to price growth and substitution of new and more expensive drugs for older and cheaper ones.2
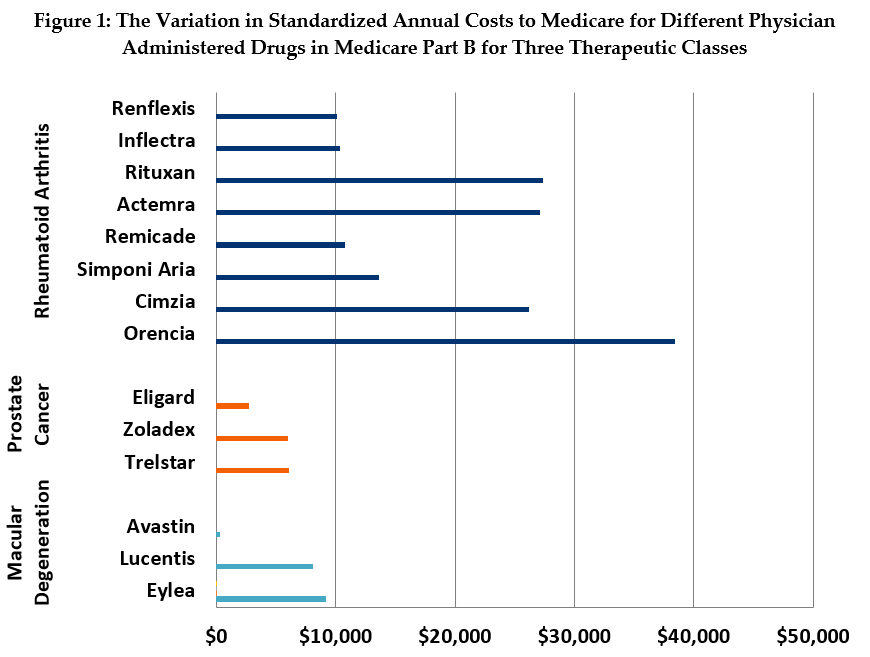
The wide discrepancies in prices among comparable therapies in several drug classes dramatically highlight the missed opportunity of not leveraging competition to obtain savings. For example, in our standardized analysis (see Figure 1), we found that the annual, per-beneficiary cost for treatment of wet age-related macular degeneration (MD) with Eylea is about $9,218 and treatment with Lucentis costs $8,071. By contrast, the annual cost for treatment with Avastin, an effective MD treatment originally developed for cancer, is as little as $301.
The price differential among treatments for rheumatoid arthritis (RA) is also substantial, if less dramatic than that of the MD drugs. Treatment with Orencia and Rituxan cost an average of $27,379 and $38,385, respectively, while treatment with the biologic drug, Remicade and its biosimilars Inflectra and Renflexis, costs between $10,100 and $10,800 a year.
Recent Efforts to Reduce Part B Drug Spending
Between 1995 and 2010, Medicare applied a “least costly alternative” (LCA) policy to certain Part B drugs. During that period, Medicare based the price for any drug in a set of clinically comparable drugs on the lowest price among those drugs. Medicare would not pay the differential amount for the more expensive alternatives. Beneficiaries retained the option of paying the additional cost themselves if they wanted to be treated with the higher-priced drug.3
The LCA policy was terminated by the Center for Medicare and Medicaid Services (CMS) after the U.S. Court of Appeals for the District of Columbia ruled that the Medicare Modernization Act of 2003 restricted Part B to paying providers based on the ASP methodology only.4
Prior to the court ruling, the policy had been used for drugs treating prostate cancer, respiratory disease, and chronic liver failure.5 The pricing and utilization record for a specific class of prostate cancer drug (LHRH agonists) provides a good snapshot of the impact of the LCA policy.
When the new prostate cancer drug Eligard entered the market, it was priced higher than other LHRH drugs subject to LCA at $2,936 for a course of treatment. The comparable drug Zoladex was priced at $1,128 per course of treatment. Once subject to LCA in 2004, the manufacturers of Eligard lowered its price to maintain market share (Figure 2). However, once the LCA policy faced legal jeopardy, the price for Eligard began to rise. After the Court of Appeals ruling and CMS’s abandonment of the policy, the price increased again.
One analysis estimated that the more expensive prostate cancer products went from having a 66 percent share of the market in 2009 to an 88 percent share in 2011 after LCA repeal.6 The HHS Inspector General also found that usage shifted from the lowest priced drug toward higher priced competitors once the policy was terminated.7

The Inspector General recommended that CMS request legislative authority to restore use of LCA reimbursement “for certain clinically comparable products under circumstances it deems appropriate.” MedPAC has also detailed a similar policy, which they call reference pricing, as a potential payment approach for some Part B drugs.8
In 2016, the Obama Administration proposed a demonstration project to test reference pricing for therapeutic classes of Part B drugs (with one option setting the average price as the benchmark price – similar to the policy in this brief). The demonstration also set out to test different options to reform the ASP plus 6 percent payment. Following recommendations from MedPAC, one pilot aimed to test the impact of reducing the add-on payment to 2.5 percent plus a flat fee. Another pilot would have investigated whether reducing cost-sharing for patients could have an impact on which drugs get prescribed. However, the entire demonstration project was nixed before it could get off the ground due to political pushback.9
The Trump Administration also attempted to reform the ASP payment system and implement a type of Part B drug reference-pricing based on international drug prices through its “Most Favored Nation” (MFN) rule. When the proposal was first released in 2018, it would have exchanged the 6 percent add-on payment for a flat fee and released physicians from buying drugs and then getting reimbursed, placing private vendors in the purchasing role instead.
Those reforms were dropped when the MFN rule was issued in November 2020, but the international refence pricing remained. The rule would limit physician reimbursement for the 50 Part B drugs with the highest annual spending to the lowest price for those drugs among certain OECD countries. However, because of the Administration’s irregular rulemaking process, the MFN was immediately put on hold in response to court challenges.
In a roundabout way, the Budget Control Act of 2011 and subsequent legislation reduced the Part B add-on payment for physicians by subjecting it to budget sequestration. When in place, (it is currently suspended during the Covid-19 health emergency) sequestration reduces the payment by 1.7 percentage points to 4.3 percent. Manufacturers have responded by lowering their prices for 34 high expenditure drugs (by 1.5% on average).10 This suggests that manufacturer prices are indeed responsive to changes in Part B payment policy.
The Policy Details
This policy option would create a single price for physician reimbursement of drugs in select clinically comparable groups. For any such group, Medicare would set the price for all drugs at a volume-weighted average price. The price would be calculated quarterly using each product’s quarterly ASP, weighted by the average annual usage of each product, and amortized based on each drug’s standard dosing.
Beneficiaries would face standard cost-sharing for the weighted ASP and could not be billed by providers for drug costs above that price. Beneficiary cost-sharing would also be based on the lower of the weighted ASP for the group or the ASP for the specific drug used. This would not only prevent beneficiaries already on the lowest cost drug from having their cost-sharing burden increase but would also strengthen the incentive to select a lower-cost option.11
Thus, the financial incentive for choosing a lower-priced drug is placed entirely upon the provider in this option; They would absorb all the extra costs involved with choosing to purchase and administer a drug priced above the weighted average and would receive all the savings for choosing a drug priced below the weighted average.
Under this option, CMS would have the authority to both define which therapeutic classes are eligible for grouping and to select the drugs with comparable clinical outcomes to include in those groups. As per existing processes, and as it has in the past for policies like LCA, CMS would utilize outside experts to guide these decisions. The process could also involve public notice and comment. Potential drug groups would likely be reviewed over time based on periodic considerations of clinical comparability. CMS would also need to create an exceptions process so that beneficiaries could have access to higher-priced drugs in a group based on medical need without penalizing providers financially.
This policy option would create competition and lower prices in ways very similar to numerous other drug policies. For example, in the way Medicare Part D plans treat brand drugs and their generic equivalents or in the insulin market where with payer management, the manufacturers of multiple interchangeable therapies compete for lower prices. The absence of price competition in Part B is a unique market failure and beckons for action to achieve savings for the government and individuals.
Estimated Fiscal and Financial Impact
In order to estimate the fiscal and financial impact of moving to clinically comparable drug pricing, we analyzed drug pricing and utilization in three therapeutic classes: drugs to treat macular degeneration (MD), rheumatoid arthritis (RA), and prostate cancer. Generally, we assume that providers will favor therapies that are more profitable and that pharmaceutical manufacturers will lower prices to retain market share, which previously happened in the Medicare LCA policy. A more detailed outline of the methodology and assumptions we used to generate these estimates can be found in the appendix section at the end of this paper.
From these three drug classes alone, we estimate this policy change would result in more than $122 billion of gross savings to the Medicare program over a decade (see Figure 3). Furthermore, because it could be applied to other classes of drugs in addition to those used in our model, savings from a broader implementation of this policy could be higher.
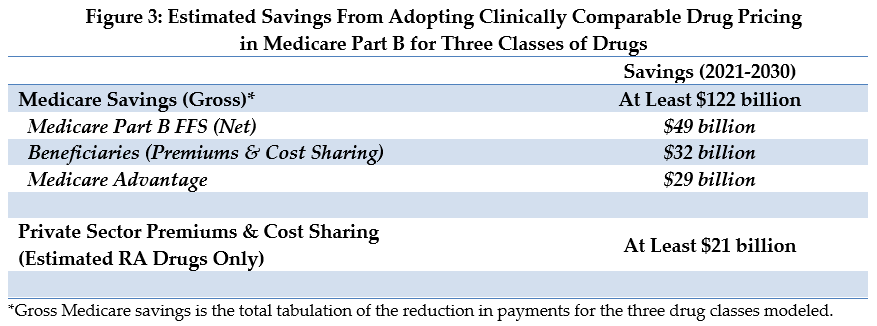
For fee-for-service (FFS) Medicare, drug payments would be $81 billion lower – including $49 billion of net savings to Medicare and $32 billion in lower beneficiary cost sharing and premiums. An additional $29 billion in savings would accrue to the Medicare Advantage program.
In the private sector commercial insurance market, the policy impact just on spending for RA drugs would be around $21 billion in savings.
The MD class of drugs is a prime example of a situation where there is both extreme variation among prices for comparable therapies and a majority preference for the higher-priced options among physicians. By contrast, the RA class has somewhat less price variation, and utilization is more widely distributed. The prostate cancer class has the least price variation, and volume is already concentrated in the lower-priced drugs. Notably, the MD and RA classes contain six of the ten Part B drugs with the highest spending.12
The Medicare Part B FFS savings represents a 69 percent reduction in the spending for the three drug classes examined in the analysis (See Figure 4).
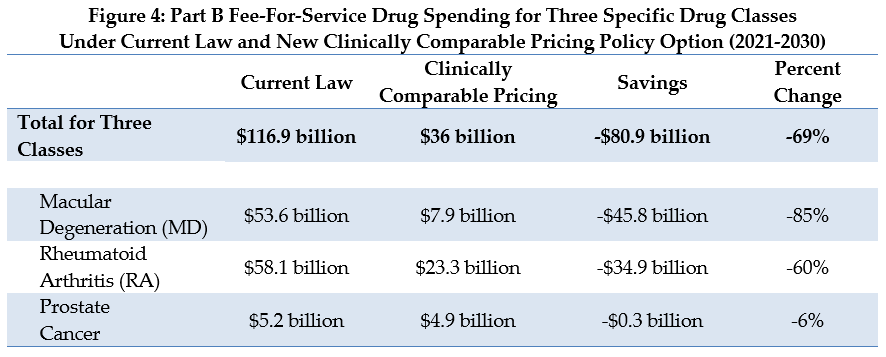
Most of these estimated savings come from the MD and RA drug classes, due to the high price differential for the drugs in these classes, and their significant utilization in Medicare. Currently, the two higher-priced MD drugs account for about three-fourths of the MD utilization. The higher-priced RA drugs represent over half of the utilization in that class. The savings estimate for these two drug classes reflects the combined effect of providers switching their patients to lower-priced alternatives and lower prices from the manufacturers. Minimal savings are realized from the prostate drug class since the lowest-price drug already represents nearly all the utilization.
In estimating the impact of this policy, we assume both a utilization response and a price response. For the utilization response, we assume a fairly rapid shift in utilization. We assume that one-fourth of the utilization shifts in the first quarter from more expensive drugs to the least expensive drug. The utilization reduction is based on the assumption that physicians will be reluctant to continue using more expensive drugs when doing so invariably involves taking a substantial financial loss. It also relies on the idea that competing drugs are viewed as having clinically similar results and relatively low risk of adverse effects from the change in treatment.
We also assume substantial manufacturer price response based on two pieces of compelling historical evidence: the significant fluctuation in prices seen in prostate cancer drugs following the introduction and subsequent repeal of Medicare’s LCA policy for that drug class, and the decrease in prices for many Part B drugs that occurred in response to lower Medicare payments resulting from the sequester.
According to our assumed utilization and price responses, we estimate that Medicare payments for these three drug classes would shift rapidly under this policy to a level close to that of today’s lowest-price drug. For example, physician reimbursement for a year of treatment with the two higher-priced MD drugs will drop from the range of $7,700 to $9,200 down to $910 after one year and to $340 in the second year.
We estimate that the manufacturer price response will lag slightly but will ultimately follow a similar pattern. Even with this price response, the market share for the cheapest MD drug will grow from about one-fourth to about two-thirds of the market.
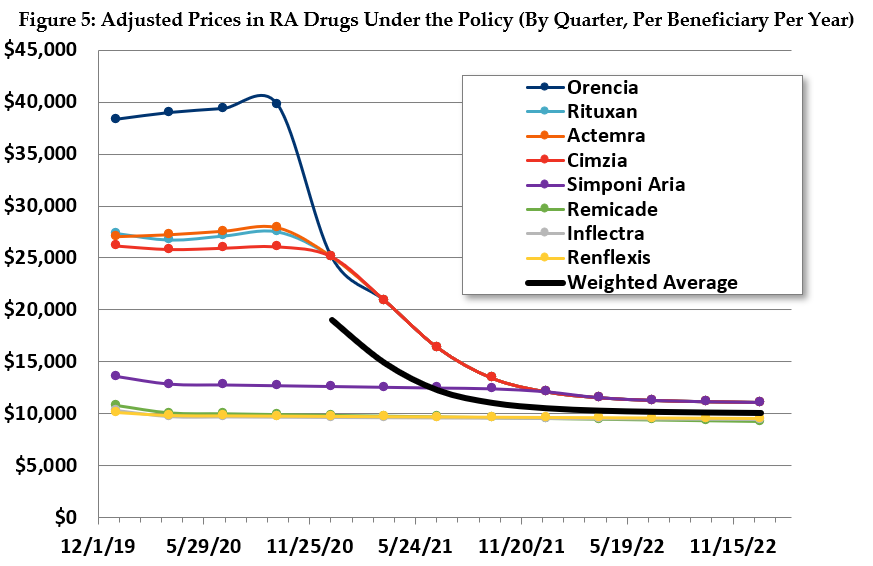
Similarly, in the RA drug class, we estimate that Medicare payments will settle after a couple years close to the price of the least expensive drug. Prices will generally converge close to the payment amount, and much of the utilization will shift accordingly (see Figure 5).
The estimated effects in the prostate cancer class are more limited. Payments for the two higher-priced drugs will be lowered to almost that of the lowest price drug, which has the bulk of the utilization. The other two drugs will only maintain their limited market share by lowering their prices.
Because Medicare’s ASP is derived from prices for all purchasers, the new policy will influence the market as a whole. Manufacturers of drugs for which Medicare represents a significant market share may find maintaining higher prices in the face of this new, lower payment amount challenging. Refusing to reduce prices would inherently mean risking a large share — potentially close to 100 percent — of all demand for that drug from Medicare beneficiaries. It might be possible for a manufacturer to maintain a higher price and seek to sell to the commercial market directly. However, under this scenario, commercial payers would likewise have a strong incentive to buy drugs that have become cheaper or were already cheaper than comparable alternatives.
We provide an example of such savings using the RA drugs since commercially insured patients use a substantial share of all RA drugs. A rough estimate of the savings, assuming half the rate of savings as for FFS Medicare, is $21 billion dollars over 10 years. The federal government might see some savings from lower prices in the commercial market through lower exchange subsidies and through taxation of higher wages due to less employer spending on tax-free health insurance, however we were unable to estimate such savings.
There will be even stronger commercial market incentives for savings in Medicare Advantage plans. Although not constrained by law to follow the payment policies used in traditional Medicare, Medicare Advantage plans need to make premium bids that are competitive with traditional Medicare. The strong incentive plans have to pay for services at levels generally no greater than Medicare also applies to plans’ purchases of Part B drugs. For our Medicare Advantage savings estimate of $29 billion over 10 years, we assume the program will capture two-thirds of the per-beneficiary drug savings that accrue to FFS Medicare.
Other Considerations
Additional Medicare Part B savings beyond these three drug classes would be available under this policy, to the extent that Medicare can identify other therapeutic classes with clinically comparable drugs, such as those identified by MedPAC.13 This policy would not apply to Part B drugs which are the sole treatment for a specific health condition.
There are other ways this policy might create savings not captured in these estimates. For instance, this policy will influence prices for new drugs that are clinically comparable to others already on the market. A new drug assigned to a group with this policy in place will only be able to gain market share by matching or beating the existing price — not pricing the drug higher, as is often the case today. In these cases, it will be important for CMS to make timely decisions on placing drugs into groups.
The biggest limitation in the ability to achieve savings is likely to be physicians’ willingness to switch their patients onto other drugs within the class. We assume the exceptions process for patients in need of a higher-priced drug will not lead to a noticeable drop in savings. However, physician shifts to lower-priced drugs will certainly be more likely for patients newly receiving treatment. Furthermore, the significant financial penalty for using a higher-priced drug will provide considerable impetus to switch. It’s important to remember, however, that this proposal will still result in savings for Medicare even if no physicians ultimately chose to switch their patients to cheaper drugs, because it is only paying the weighted average price. Switching brings additional savings by lowering the weighted average itself.
Other limitations may come from manufacturers not lowering their prices, especially for drugs that derive a large market share from populations not in Medicare or that treat health conditions other than the specific condition targeted in the therapeutic grouping. However, such decisions may simply push Medicare patients to other, lower priced treatments within the group. Plus, even in such a scenario, the weighted average price will fall as the Medicare utilization (on which the “weight” is based) moves away from the higher-priced drugs, ultimately resulting in savings.
A related policy issue is how to pay for the biosimilar versions of biologic Part B drugs. Biologics are complex drugs that account for over three-quarters of FFS Part B drug spending (as of 2017) as well as represent 92 percent of the growth in Part B spending from 2006-2017.14 Biosimilars are drugs in this category designed to act as a rough parallel to generics for those originator biologic drugs.
Current Medicare payment policy for biosimilars does not incentivize direct competition between biosimilars and their originator biologic because each drug is priced separately. However, the 6-percent add-on payment is based on 6 percent of the originator product’s ASP – which partially weakens the incentive for the provider to select the most expensive drug.
In June 2017, MedPAC issued a recommendation to establish consolidated billing codes that would group an originator biologic and all its biosimilars into the same billing code to maximize price competition.15 Savings from a similar policy were recently estimated to be in the range of anywhere from $2 billion to $7.5 billion per year.16
A fully implemented version of clinically comparable pricing would likely create similar competitive forces withing therapeutic classes. However, action in the biologic space has the potential to achieve savings in therapies that would be impractical to include in groups.
Appendix: Estimating Methodology
The estimates in this document were produced through the joint effort of the partner organizations: The Committee for a Responsible Federal Budget, Arnold Ventures, and West Health.
The starting points for savings estimates were the March 2020 Congressional Budget Office baseline and the March 2020 National Health Expenditure projections from the actuaries at the Centers for Medicare and Medicaid Services. The Heath Savers Initiative will use this pre-Covid-19 baseline for all options to allow for the best comparisons since the full impact of Covid-19 on the baselines is unknown at this time.
This analysis used the 2019 Medicare 5% sample data. All claims from the carrier, DME, and outpatient datasets were extracted if the Healthcare Common Procedure Coding System (HCPCS) code was associated with one of the drugs selected for inclusion in this proposal.
The selected claims were narrowed to beneficiaries with relevant conditions. In other words, the macular degeneration, prostate cancer, and rheumatoid arthritis drug claims were limited to remove beneficiaries without these conditions. Next, all 340B claims were identified based on the HCPCS modifier code JG and were excluded.
Finally, the data were tabulated to facilitate conversion to total annual costs of treatment for a typical regimen. To do so, the median number of claims per beneficiary was calculated for each drug, followed by the conditional median HCPCS units per claim, assuming beneficiaries utilize the median number of claims.
As a source for prices to associate with these claims, we looked to the 2019 ASP pricing files, which are available to the public on the CMS website.
In order to develop a baseline projection of spending over the 10-year budget window, we projected both quarterly utilization and quarterly ASP separately, but tied the combination to the projected per-capita change published in the 2020 Medicare Trustees Report. More specifically, aggregate total spending growth for a selected group of drugs was pegged to aggregate spending on “Physician-Administered Drugs” from Table IV.B2. – Incurred Reimbursement Amounts per Fee-for-Service Enrollee, using projected FFS enrollment.
After setting the aggregate spending trend, we derived annual trends in ASP based on a review of various data sources, including Chart 10-4 from Chapter 10 of MedPAC’s June 2019 publication, “A Data Book: Health Care Spending and the Medicare Program,” which showed average annual growth in ASP for the 20 Part B drugs with the highest expenditure rates from 2005 to 2019. The Part B spending dashboards were reviewed in addition to the published ASPs. Final trends were selected based on a combination of logical judgement and a focus on maintaining consistency with prior trends. Annual trends were converted to quarterly trends for use in the model.
After trending prices, a utilization trend was derived by targeting the aggregate spending baseline described above. The same utilization trend was applied to all drugs, which assumes a static marketplace for all drugs into the future. The primary motivation for this approach was to allow the modeling of price changes under the proposal to account for all market movement.
Finally, Q4 2019 utilization from the 5% sample and ASP for each drug were trended quarterly to the end of 2030.
Modeling the proposal consisted of four distinct steps:
- Calculating the weighted average payment rate as defined in the proposal
- Adjusting projected ASP in response to new payment rates
- Shifting utilization to the lowest priced drug in a therapeutic group
- Calculating the adjusted Medicare spending
After adjusting utilization and calculating new payment rates, total aggregate spending was determined by multiplying the new payment rate by quantity of adjusted utilization. This calculation is consistent with the baseline calculation.
In estimating the impact of this policy, we assume both a utilization response and a price response. For the utilization response, we assume that one-fourth of the utilization shifts in the first quarter from more expensive drugs to the least expensive drug. The quarterly reductions in utilization are smaller over the next four quarters: 20%, 15%, 10%, and 5%. This creates a maximum utilization loss of 56% occurring in quarter 5.
For the price response, we assume that manufacturers of drugs with prices above the weighted average will adjust prices each quarter to 110 percent of the weighted ASP for that quarter. Once the adjusted prices are within 5% of target prices, no further price adjustments or utilization reductions occur under our model.
To estimate savings in the commercial market, we obtained total U.S. sales for the rheumatoid arthritis products from manufacturers’ financial reports for 2019. From these sales, we estimated commercial sales by subtracting total Medicare and Medicaid sales from the CMS dashboards; We estimated total commercial sales over the period by adjusting 2019 sales by the ratio of 2019 Part B fee-for-service sales to total estimated Part B fee-for-service sales from 2021-2030. We assumed that commercial markets would see half the savings realized by Medicare Part B fee-for-service and estimated those savings at the drug level for each sector.
1 Juliette Cubanski and Tricia Neuman, “Relatively Few Drugs Account for a Large Share of Medicare Prescription Drug Spending,” KFF, Medicare, April 2021, https://www.kff.org/medicare/issue-brief/relatively-few-drugs-account-for-a-large-share-of-medicare-prescription-drug-spending/.
2 MedPAC, “Part B Drugs Payment Systems,” Payment Basics, October 2020, https://www.medpac.gov/docs/default-source/payment-basics/medpac_payment_basics_20_partb_final_sec.pdf?sfvrsn=0.
3 Pew Trusts, “The ‘Least Costly Alternative’ Approach for Payment of Medicare Part B Drugs: How different reimbursement models could affect drug prices,” March 2016, https://www.pewtrusts.org/en/research-and-analysis/fact-sheets/2016/03/the-least-costly-alternative-approach-for-payment-of-medicare-part-b-drugs.
4 Ilene Hays, Appellee vs. Kathleen Sebelius, Secretary of the United States Department of Health and Human Services, (D.C. Cir. 2009), https://www.cadc.uscourts.gov/internet/opinions.nsf/7ED0A2CCC27AD83085257807005999C4/$file/08-5508-1221815.pdf.
5 Pew Trusts, “The ‘Least Costly Alternative’ Approach for Payment of Medicare Part B Drugs: How different reimbursement models could affect drug prices,” March 2016, https://www.pewtrusts.org/en/research-and-analysis/fact-sheets/2016/03/the-least-costly-alternative-approach-for-payment-of-medicare-part-b-drugs.
6 Alex Brill, "Economic Analysis Quantifies Potential LHRH Agonist Savings in Part B," Matrix Global Advisors. February 2014.
7 Department of Health and Human Services’ Office of Inspector General, “Least Costly Alternative Policies: Impact on Prostate Cancer Drugs Covered Under Medicare Part B,” 2012, https://oig.hhs.gov/oei/reports/oei-12-12-00210.pdf.
8 MedPAC, “Report to the Congress: Medicare and the Health Care Delivery System,” June 2019, https://www.medpac.gov/docs/default-source/reports/jun19_medpac_reporttocongress_sec.pdf.
9 Joshua Gordon, “Lawmakers Forget Incentives Matter on Prescription Drugs,” May 2016, https://www.concordcoalition.org/tabulation/lawmakers-forget-incentives-matter-prescription-drugs.; Rachel Dolan, “The Demise of the Part B Demo: Doom For Value-Based Payment?” Health Affairs, December 2016, 10.1377/hblog20161227.058082.
10 MedPAC, “Report to the Congress: Medicare and the Health Care Delivery System,” June 2016, https://www.medpac.gov/docs/default-source/reports/june-2016-report-to-the-congress-medicare-and-the-health-care-delivery-system.pdf.
11 This might raise administrative issues because today CMS does not routinely collect acquisition costs for Part B drugs.
12 Juliette Cubanski and Tricia Neuman, “Relatively Few Drugs Account for a Large Share of Medicare Prescription Drug Spending,” KFF, Medicare, April 2021, https://www.kff.org/medicare/issue-brief/relatively-few-drugs-account-for-a-large-share-of-medicare-prescription-drug-spending/.
13 MedPAC, “Report to the Congress: Medicare and the Health Care Delivery System,” June 2019, https://www.medpac.gov/docs/default-source/reports/jun19_medpac_reporttocongress_sec.pdf.
14 ASPE, “Medicare Part B Drugs: Trends in Spending and Utilization, 2006-2017,” November 20, 2020. https://aspe.hhs.gov/system/files/pdf/264416/Part-B-Drugs-Trends-Issue-Brief.pdf
15 MedPAC, “Report to the Congress: Medicare and the Health Care Delivery System,” June 2017, https://www.medpac.gov/docs/default-source/reports/jun17_reporttocongress_sec.pdf.
16 Fiona Scott Morton, “Paying for Biologic PADs in Medicare Part B,” 1% Steps for Health Care Reform, Accessed May 2021, https://onepercentsteps.com/policy-briefs/paying-for-biologic-pads-in-medicare-part-b/.