What Is a Reasonable Amount of Dynamic Revenue For Tax Reform?
Thoughtful tax reform has the potential to increase the size of the economy, lifting wages and incomes while also generating more tax revenue for the federal government. This additional dynamic feedback revenue (the result of “dynamic scoring”) has been hotly debated recently. Unfortunately, many policymakers and tax reform advocates dramatically overstate the potential dynamic gains from tax reform to promote a large and economically damaging tax cut.
There is no question that tax cuts do not pay for themselves. But in recent weeks, some have claimed dynamic gains could total $1 trillion, $2 trillion, or even $3 trillion over a decade, which in turn could be used to finance tax cuts. But theory, empirical evidence, and most existing tax models tell a different story. In reality, dynamic feedback for a well-designed income tax reform plan is likely to produce closer to $300 or $400 billion of dynamic feedback over a decade, and debt-financed tax reform may have little or no net positive feedback at all.
How Much Dynamic Feedback Will Official Scorekeepers Estimate?
While both tax cuts and reform can improve economic growth – tax cuts by fueling more consumption in the near term and tax reform by improving incentives to work and invest in the medium and long terms – basic theory indicates that tax cuts won’t pay for themselves. Because the government only taxes a fraction of economic output, each dollar of tax cuts would need to produce five or six dollars of new economic activity to be self-financing – a return astronomically higher than what is realistic.
Tax reform with significant revenue loss is also unlikely to pay for itself, given the negative economic consequences of both increased debt and some types of tax base broadening.
How much revenue can tax reform produce? It depends on the details of the reform, especially the changes it makes to the effective marginal rates on capital investment and labor as well as what it does to national savings and the national debt.
While it is impossible to dynamically score tax reform legislation that hasn’t been fully written, past estimates from the Congressional Budget Office (CBO) and Joint Committee on Taxation (JCT) can give us clues.
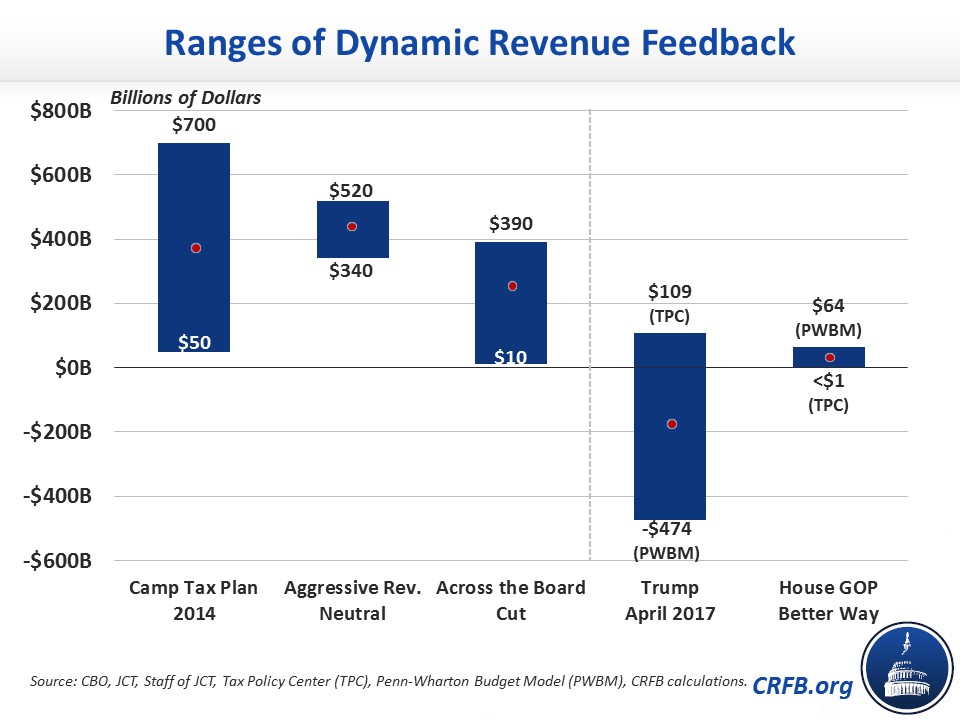
Back in 2014, JCT produced a dynamic analysis of the Tax Reform Act of 2014, which significantly lowered individual and business tax rates and fully offset the revenue loss over ten years by cutting tax breaks. Using a number of different models and assumptions, JCT concluded that the legislation would produce between $50 billion and $700 billion of dynamic feedback over a decade. This suggests revenue-neutral tax reform could produce $300 billion to $400 billion of dynamic feedback if a single point estimate were to be provided.
Prior JCT and CBO dynamic analyses come to a similar conclusion.
Two JCT staff reports in 2011 – for individual and corporate reforms – allows us to roughly estimate the effects of revenue-neutral tax reform that aggressively eliminates tax preferences while reducing tax rates by about one quarter. These JCT reports suggest that such tax reform could produce revenue feedback of roughly $430 billion over a decade, give or take $100 billion.*
CBO and JCT reports from 2004 and 2005 also give us a sense of the possible revenue feedback from tax cuts. Combining a 10 percent cut to individual tax rates (including capital gains and dividends) and a 20 percent cut in corporate tax rates would result in about $260 billion of dynamic revenue feedback, assuming the average of all models. Importantly, this excludes the higher interest costs associated with higher growth and debt, and it includes a number of models that assume the tax cuts will be offset eventually.
| Average of Estimates | High Estimate | Low Estimate | |
|---|---|---|---|
| Past Estimates By and Based on CBO and JCT | |||
| Tax Reform Act of 2014 | $375 billion | $700 billion | $50 billion |
| Aggressive Revenue-Neutral Tax Reform (2011) | $430 billion | $520 billion | $340 billion |
| Across-The-Board Tax Cuts (2004/2005) | $260 billion | $390 billion | $10 billion |
| Estimates of Recent Plans | |||
| Tax Policy Center (Better Way, 2016) | <$1 billion | - | - |
| Tax Policy Center (Trump, April 2017) | $109 billion | - | - |
| Penn-Wharton Budget Model (Better Way, 2016) | $64 billion | - | - |
| Penn-Wharton Budget Model (Trump, April 2017) | -$474 billion | - | - |
Note: All estimates are for the first 10 years.
Indeed, most models that find tax cuts produce long-term growth assume that such tax cuts are fully paid for in the future with new spending cuts or tax increases. Without such offsets, the borrowing from debt-financed tax reform is likely to ultimately counteract any positive effects of tax cuts as higher debt crowds out private investment. As CBO said in a 2016 report: “The increase in federal borrowing would reduce the amount of money available for private investment, damping GDP in later years.“
How Much Dynamic Feedback Will Outside Groups Estimate?
For the most part, fully-refined dynamic models from outside groups have produced similar findings as official scorekeepers.
The Tax Policy Center (TPC) recently developed a dynamic model, which incorporates Keynesian and neoclassical effects, and used it to estimate both the 2016 House GOP “Better Way” blueprint and the proposal put forward by President Trump in April. TPC estimated the Trump Administration’s April plan would produce $109 billion of dynamic feedback revenue and found the 2016 House GOP blueprint (inclusive of Obamacare tax repeals and excluding unspecified pay-fors) would generate $0.5 billion of net dynamic revenue in the first decade. The positive effects of lower individual and corporate rates, they conclude, are mostly offset by the negative effects of higher debt. In both cases, the the economy would be smaller in 2027 due to dynamic effects. Losses continue beyond 2027, with additional dynamic revenue losses in the second decade of $197 billion and $470 billion for the Trump and House GOP proposals, respectively.
The Penn Wharton Budget Model at the University of Pennsylvania (PWBM), an overlapping-generations (OLG) model, came to a similar but more extreme conclusion. For the 2016 House GOP blueprint, the PWBM model found dynamic revenue of $64 billion in the first decade and a revenue loss of more than $1.1 trillion in the second decade. For the Trump Administration’s April proposals, the PWBM model showed a $474 billion dynamic revenue loss in the first decade and a $1.3 trillion loss in the second decade.
On the other hand, several outside models show unrealistically high dynamic estimates – generally because they ignore the negative impact of higher debt, show larger benefits of rate cuts than the evidence suggests, do not model spending impacts, and do not model other factors that would moderate feedback effects such as Federal Reserve response to changes in tax policy. For example, the Tax Foundation’s Taxes and Growth Model does not account for the negative economic impact of higher debt, though they do acknowledge “the need to finance [a large tax cut] is likely to have macroeconomic impacts of its own.” Their model also effectively assumes an unlimited stock of available savings for new investment, which leads the model to project tax reform having a larger effect on investment than would likely be the case.
The Tax Foundation, along with other outside groups, also focuses solely on revenue feedback, ignoring the spending side of the ledger. In reality, the combination of faster growth and higher debt are likely to increase interest rates and payments along with other spending. A full dynamic score must include both tax and spending effects.
*****
With policymakers contemplating whether they should rely on $1 trillion or more of dynamic revenues to justify tax cuts, it is important to note that such dramatic gains are not realistic or appropriate to assume.
While one cannot predict the dynamic feedback of tax reform that is not yet written, $300 to $400 billion of feedback is a reasonable guess for the possible feedback from thoughtful and responsible reform. Irresponsible revenue-reducing reform is likely to produce significantly less revenue and would likely even lose revenue from dynamic effects over the long term.
Policymakers should use reasonable assumptions to pass tax reform that does not add to the debt. They shouldn’t try to hide a debt-increasing tax cut behind shaky and unrealistic estimates of economic growth.
*Estimates are based on the 2012-2021 budget window and include revenue effects only. The individual analysis was produced by JCT and the corporate analysis was in a paper published by JCT staff but not affiliated with JCT. On the individual side, JCT assumed all elimination of all itemized deductions, personal/dependent exemptions, and personal credits (except the Earned Income Tax Credit) as well as most above-the-line deductions; it used that revenue to repeal the Alternative Minimum Tax and reduce all tax rates by 24 percent. On the corporate side, we used JCT staff's analysis to effectively assume the elimination of all business tax preferences, which would reduce the tax rate by 10 percentage points; we assumed half of business tax preferences were inframarginal and that the effect on feedback revenue would have the same relationship to economic effect as in JCT’s individual analysis. Non-revenue effects would likely decrease the deficit reduction on net as a result of higher interest rates on existing debt.