How Much Difference Does Health Care Cost Growth Make to the Budget?
The recent slowdown in federal health care spending has certainly been good news for the budget, knocking hundreds of billions of dollars off projections over the next decade. A main debate in the health policy world lately has been to what extent this slowdown can continue both for public health spending and overall national spending. Recent developments show that the slowdown may be at least partially reversing, but most experts expect at least some portion of the slowdown to continue. In the budget world, the question is how different scenarios for health care spending could affect the budget and if sufficient slowing of health care spending growth could even eliminate the need for further deficit reduction.
According to a recent paper by Alan Auerbach and Bill Gale, highlighted in a blog post by Gale, the answer to the latter question is no.
From 2005-2011, excess cost growth (the extent to which health care cost growth exceeds GDP growth) was 1.3 percent, generally lower than it has been in the past. It has been even lower since the onset of the Great Recession with GDP growth staying about even or sometimes even exceeding health care cost growth.
Auerbach and Gale use four different scenarios for health care spending:
- CBO's current law baseline with a permanent doc fix
- Zero excess cost growth after 2013
- Gradually declining excess cost growth from 1.5 percent to 0 over 75 years (similar to CBO's long-term assumptions)
- 2.5 percent excess cost growth after 2013
Under all four scenarios, debt as a percent of GDP would remain on an upward path through 2040, reaching about 110 percent even under the no excess cost growth scenario. The paper does not extend the debt calculation beyond that, but it finds that the fiscal gap – the amount of deficit reduction necessary to keep debt at its current level – would grow when the window is extended out beyond 2040. Under the no excess cost growth scenario, the fiscal gap would be 1.3 percent of GDP through 2040 but 2.6 percent through 2090.
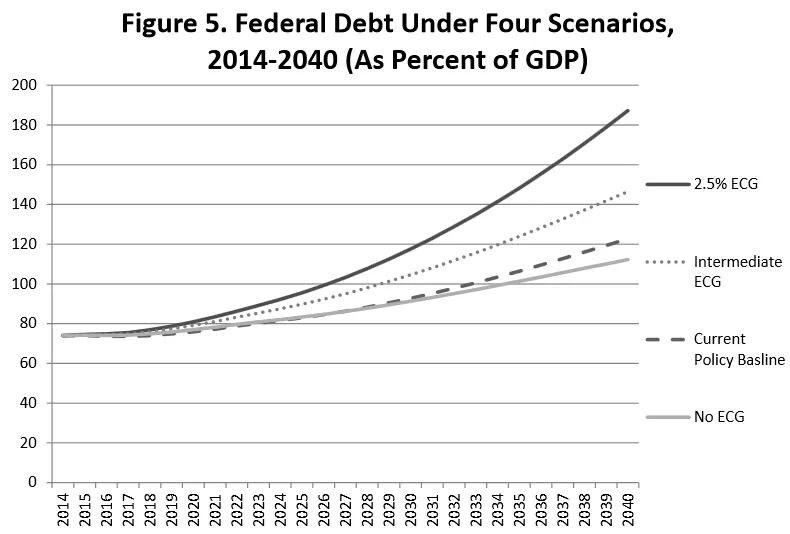
Source: Auerbach/Gale
One thing to note is that these projections assumes that revenue is frozen as a share of GDP after 2024. This is a reasonable assumption based on historical experience, but it is more pessimistic than CBO's assumption that lawmakers would allow the tax code to naturally raise a greater share of revenue over time.
Having no excess cost growth for the next 75 years is a highly optimistic scenario, yet that would still leave debt growing further above already historically high levels into the future. Auerbach and Gale show conclusively that under any likely scenario for health spending, lawmakers will still need to make changes to the budget in order to prevent a rise in debt as a share of the economy.