How the House and Senate Budgets Stack Up
With the release of the Senate budget resolution, we now have the two Congressional budgets that will set up the budget process for the rest of the fiscal year. There are many similarities between the two budgets but also key differences that will need to be reconciled in conference – differences that could have a significant effect on later fiscal decisions. Here's a rundown of how each budget stacks up.
Debt and Deficits
Both budget resolutions would improve the debt outlook, but to different degrees. The House budget assumes savings and increases in economic growth that would reduce debt from its current level of 77 percent of GDP to 63 percent by 2027; ignoring economic effects, debt would fall more gradually to 73 percent in 2027*. Meanwhile, the Senate budget would result in debt increasing to a peak of 79 percent of GDP by 2020 before declining to 75 percent by 2027. This estimate ignores the budget's claimed economic growth effects; it is difficult to determine what debt would be when counting economic effects based on the information given.

Instead of deficits rising significantly over the next decade as expected in current law, both budgets would reduce deficits as a share of GDP. Under the House budget, the deficit would fall from 3.6 percent of GDP in 2017 to 0.2 percent, or about $40 billion, by 2027. Ignoring economic growth, the deficit would be higher but still relatively modest at 1.4 percent, or about $400 billion. Meanwhile, the Senate would not balance in 2027 since it only aims for on-budget balance, instead leaving a deficit of 1.7 percent of GDP ($485 billion) ignoring economic effects. Again, it is difficult to determine what the deficit would be if economic effects were included.

Sources of Deficit Reduction
There are many similarities in the deficit reduction each budget claims. Both budgets get all of their net savings from spending cuts while allowing some revenue loss for each chamber's respective Affordable Care Act replacement legislation. At the same time, the budgets differ somewhat on how much savings there are and where they come from.
The House budget includes $4.3 trillion of policy savings, with most of the savings come from health care programs ($2 trillion) and other mandatory programs ($2.5 trillion) but also net spending cuts in domestic discretionary spending. At the same time, the budget loses $1.125 trillion in revenue from its ACA replacement. On top of the policy savings, the budget assumes $1.5 trillion of savings from increased economic growth, an amount that is very optimistic and unlikely to be achieved.
The Senate budget includes $3.3 trillion of net policy savings and is less specific about where the savings come from. It simply states that it would achieve $4.1 trillion in mandatory savings (compared to $4.4 trillion in the House budget) and $534 billion of discretionary savings (slightly higher than the House). It loses more in revenue than the House since it calls for a $1.5 trillion tax cut on top of revenue losses from its ACA replacement for a total loss of more than $1.6 trillion. Similar to the House, the budget assumes $1.4 trillion of savings from economic growth, $178 billion of which they attribute to CBO's estimate of the economic benefit of deficit reduction.
One thing to note is that many of these cuts are unspecified, and they are not necessarily going to be acted on. The House budget has reconciliation instructions to achieve just $203 billion of its spending cuts while the Senate budget has instructions for just $1 billion of cuts. In addition, the Senate budget doesn't even allocate its spending cuts to authorizing committees, which is highly unusual for a budget resolution, and leaves $2.2 trillion of spending cuts unallocated to specific budget functions.
Comparing the House and Senate Budget Ten-Year Savings by Category
| Budget Category | House | Senate |
|---|---|---|
| Medicaid and Other Health | $1,504 billion | $4,100 billion |
| Medicare (net) | $487 billion | |
| Social Security | $4 billion | |
| Other Mandatory | $2,446 billion | |
| Discretionary and Highway | $458 billion | $534 billion |
| Revenue | -$1,125 billion | -$1,635 billion |
| Interest | $541 billion | $259 billion |
| Subtotal, Policy Savings | $4,315 billion | $3,258 billion |
| Economic Effect of Budget | $1,500 billion | $1,418 billion |
| Subtotal, Claimed Savings with Economic Effects | $5,815 billion | $4,676 billion |
| Baseline Adjustments* | $731 billion | $1,308 billion |
| Total, Claimed Savings Compared to CBO Baseline | $6,546 billion | $5,984 billion |
Source: House and Senate Budget Committees, Congressional Budget Office
*Includes drawdowns of war spending and short-term emergencies that were not included in CBO's baseline.
Reconciliation Instructions
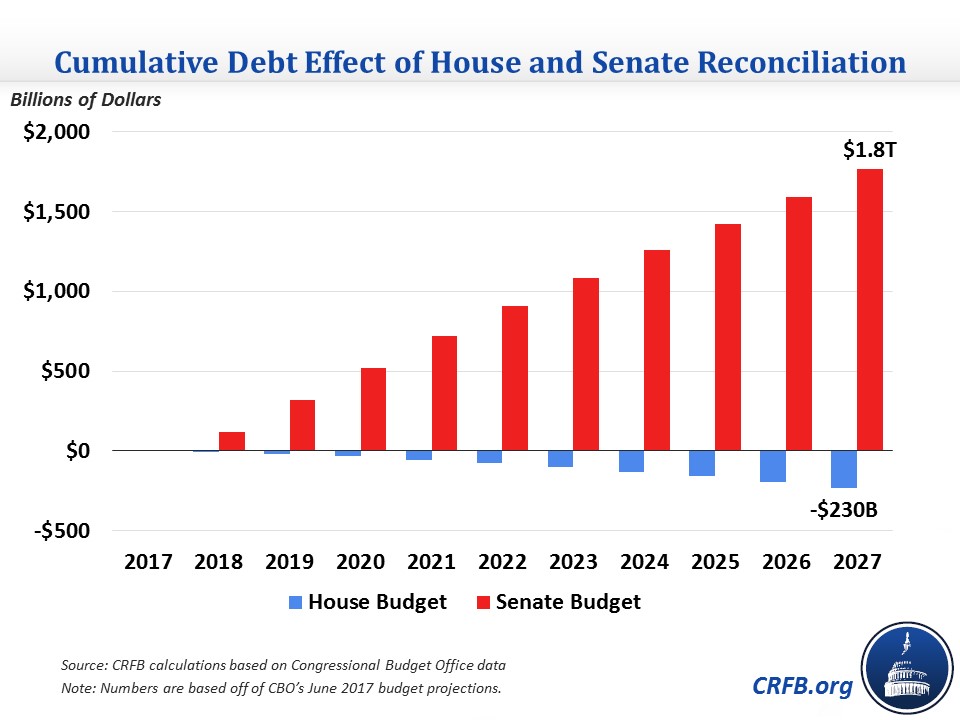
The reconciliation instructions are the most meaningful and actionable part of the budget because the legislation reported by committees to meet the instructions are considered under an expedited procedure with special rules, including the inability to filibuster reconciliation bills. As we have detailed before, there is a wide gap in the reconciliation instructions in the two budgets that could result in a $2 trillion difference in debt over ten years.
The House includes instructions to 11 committees to save $203 billion over ten years. It will also be the vehicle for deficit-neutral tax reform, with the tax-writing Ways and Means Committee given an overall savings target of $52 billion.
Meanwhile, the Senate includes instructions to two committees: the Finance Committee for a $1.5 trillion tax cut, and the Energy and Natural Resources Committee for at least $1 billion of savings. Since the Energy Committee's savings are not likely to exceed its target by very much, the net result will be a sizeable deficit increase.
Needless to say, the House budget is much more fiscally responsible on reconciliation than the Senate because it actually requires action on legislation reducing the deficit, whereas the Senate budget facilitates legislation increasing the deficit.
Changes in Discretionary Spending
Perhaps the most immediate way the budget resolution comes into play is with the FY 2018 discretionary spending caps. With the continuing resolution (CR) that will fund the government when the fiscal year starts on October 1 set to expire on December 8, the final budget resolution's FY 2018 cap will affect the spending limits appropriators have to work with. On this issue, though, the budgets are relatively far apart.
The House budget increases the current law spending limit for defense by $72 billion and reduces the non-defense limit by $5 billion, increasing the overall limit by $67 billion to $1.132 trillion. The Senate sticks to the current law total of $1.065 trillion, which is $5 billion below the CR amount. However, the Senate budget allows the discretionary spending level to be increased if Congress enacts legislation increasing the limit on defense spending without requiring that increase be offset by savings elsewhere in the budget. The budget conference agreement will have to reconcile these numbers and ideally set in motion a process for offsetting an increase in the caps if agreed upon.
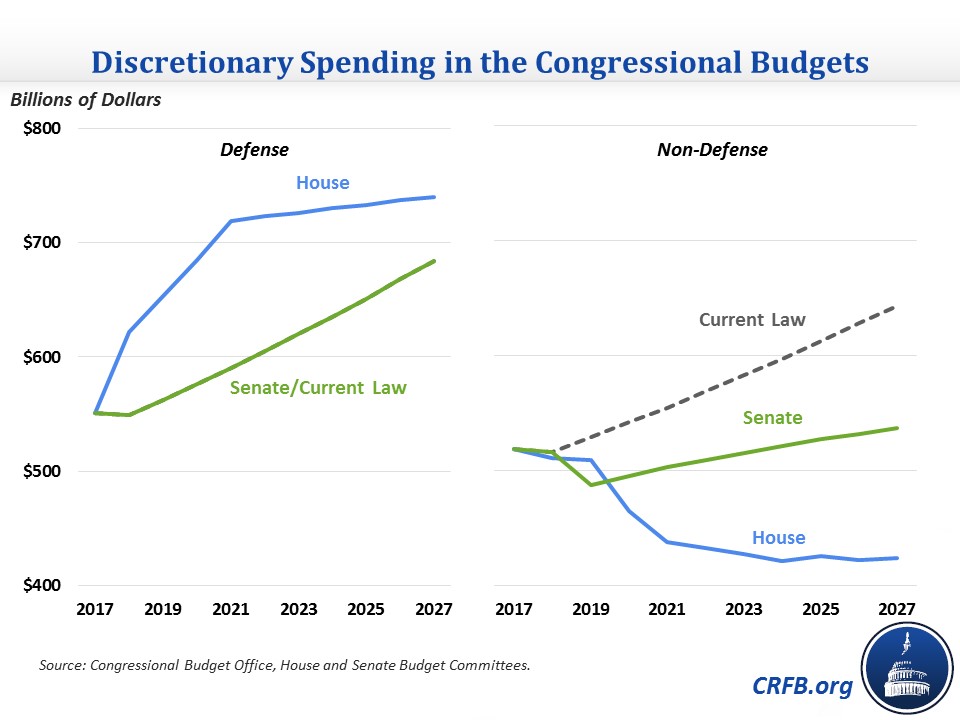
After that, the budgets make similar changes to discretionary spending (higher defense and lower non-defense), though with different numbers. The House's defense increase grows to a peak of $129 billion in 2021, after which defense spending grows very slowly, resulting in a smaller increase of $56 billion by 2027. Overall, regular defense budget authority (BA) would increase from $551 billion in 2017 to $740 billion in 2027. The non-defense cuts, meanwhile, grow rapidly to $77 billion in 2020 and $219 billion in 2027. As a result, non-defense discretionary BA would decline over most of the ten-year window from $519 billion in 2017 to $424 billion by 2027. Overall, the budget increases defense budget authority (BA) by $929 billion over ten years and reduces non-defense BA by $1.3 trillion.
In contrast, the Senate adheres to the current law spending cap for both defense and non-defense for FY 2018, allowing spending levels to be increased to reflect increase in cap for defense spending. It sticks to current law levels for defense in the following years as well. For non-defense, it includes a deeper non-defense budget authority than the House in FY 2019 ($42 billion), but since it allows the category to grow every year after that, its ten-year non-defense cuts are only about half as large as the House's at $632 billion. Still, these are steep cuts that lawmakers may ultimately find difficult to adhere to.
*****
Overall, the Congressional budgets are a mixed bag. They call for enough savings to put debt on a downward path as a share of the economy, but they include reconciliation instructions that would either achieve only a small fraction of the claimed savings or that would actually worsen the deficit. The House budget is far more responsible than the Senate budget because its reconciliation instructions would at least move our fiscal situation in the right direction, while the Senate's would take a big step back. Any forthcoming budget agreement should include more meaningful deficit reduction in reconciliation instructions than the House budget, and certainly avoid the deficit-increasing tax cuts the Senate budget has.
*For comparison purposes, all House debt and deficit numbers presented in this blog are compared to the Congressional Budget Office's June 2017 baseline. The House Budget Committee originally used the January baseline, which has slightly lower debt and deficits.
Tags
What's Next
-

-
Image

-