CBO Report Parses the Reasons for Part D's Slow Growth
The last few months have seen a number of new ideas to save money in Part D of Medicare by encouraging more efficient use of drugs by prescription drug plans and beneficiaries. But Part D has also grown significantly slower than expected since its inception.
On this blog and in Health Affairs, we've highlighted the disproportionate role that Part D has played in the federal health care spending slowdown. One quarter of the $900 billion downward revision in the Congressional Budget Office's (CBO's) health care spending projections through 2021 came from Part D. And Part D's downward revision was by far the largest as a percent of program spending (nearly one quarter) among the major health care programs. Looking back further, actual 2013 Part D spending ended up almost 50 percent lower than CBO's original projection when the law passed ($50 billion vs. $99 billion), and total spending over the 2004-2013 period ended up being 36 percent lower ($353 billion vs. $550 billion).
In their Health Affairs post analyzing the Medicare slowdown, CRFB analysts Loren Adler and Adam Rosenberg cited a CBO report breaking down the sources of the slowdown in Part D. In this post, we examine more closely that report, which not only goes into the reason for slower growth in Part D but also how Part D's design compares to Medicaid in controlling costs.
In analyzing the source of the slowdown, CBO's conclusion is clear:
Taken together, the faster-than-expected slowdown in national drug spending per person and the smaller-than-expected enrollment in Part D account for nearly all of the difference between CBO’s initial projection and actual Part D spending. CBO’s original projection reflected the agency’s judgment that elements of the program’s design that were intended to foster price competition between private plans would help to limit the costs of Part D, yielding lower costs per enrollee than would be expected for a similar population under a typical employment-based drug plan offered at that time.
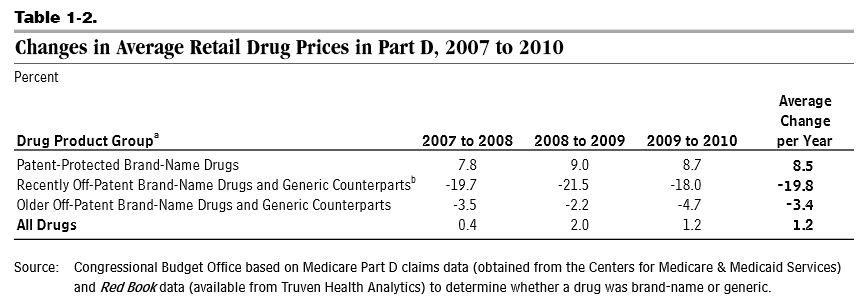
The first source -- lower nationwide spending growth -- is in part related to the "patent cliff" when many brand-name drugs lost their patents, opening the door for cheaper generic counterparts, and the slower than expected introduction of new brand-name drugs. In theory, the structure of Part D and spillover effects to the under-65 prescription drug market could have contributed to the slower adoption of new drugs, but CBO's report does not address this issue. As a result of these trends, Part D retail drug prices rose by only 1.2 percent per year from 2007 to 2010. Over that time, the share of generic drug use as a percent of total use in Part D rose from 63 to 73 percent.
The second source, lower enrollment, is attributed to the design of Part D. 2012 enrollment ended up being 12 percent lower than CBO originally thought. CBO based their projections on Part B, which has a lot of similarities to its structure; however, while 94 percent of Medicare beneficiaries were enrolled in Part B in the early 2000s, Part D ended up with only 73 percent of beneficiaries enrolled. CBO did anticipate Part D enrollment being slightly lower than Part B since some retirees would have drug coverage through other sources, but the difference turned out to be much wider than it projected. CBO surmises that Part D's lack of auto-enrollment (unlike Part B) and its requirement that people make a choice among many prescription drug plans explain the lower enrollment.
It should be noted, importantly, that CBO expected some cost containment from competition in its original estimate, so the findings do not mean that competition had no effect on spending. Rather, the report is agnostic on whether the effect of competition was greater, less, or the same as originally thought. CBO notes that between 2006 and 2010, prescription drug plan bids and premiums have tended to be lower in regions where there are more plan options, highlighting the positive effects of competition. A subsequent CBO working paper backed this finding and suggested ways to strengthen competition for the Low-Income Subsidy portion of the program.
An interesting comparison the report makes is between drug spending for Part D and Medicaid fee-for-service. Part D plans contain costs by steering beneficiaries to cheaper/generic drugs and by negotiating rebates from manufacturers. Medicaid relies more heavily on rebates, with a mandated 23.1 percent of the average manufacturing price (AMP) of brand-name drugs plus a rebate for drugs whose cost grows faster than inflation. The AMP rebate and the inflation rebate contribute equal amounts to the total manufacturers refund to Medicaid. In addition, states have enacted a number of policies to encourage beneficiaries and/or providers to use generic drugs when possible, and some states have negotiated additional rebates with manufacturers.
Because of these policies, CBO estimates that Medicaid's average drug price was between 27 percent and 38 percent lower in 2010 than for Part D after adjusting for differences in health status. CBO expects that difference to narrow over the long term as manufacturers raise prices of new drugs to compensate for increased Medicaid rebates in the Affordable Care Act, but a 20 to 30 percent difference is expected to remain. Although Part D has a slightly higher usage rate of generic drugs (75 percent versus 70 percent) and a less expensive mix of drugs within each therapeutic class, the difference in the size of rebates is wide: 15 percent on average for Part D and 54 percent for Medicaid.

Within each therapeutic class, the mix of drugs used by Part D enrollees versus Medicaid beneficiaries is 15 percent less expensive, which could either reflect the design of the Part D steering beneficiaries toward less expensive drugs or differing health status among the two groups. The 27-38 percent range encompasses the extent to which each of these factors plays a part, and CBO does not take a stance on where the difference would likely fall.
The comparison between Part D and Medicaid is interesting for policymakers since a commonly discussed health care policy (which is also in our budget simulator) would apply the Medicaid drug rebates to beneficiaries who receive the Low-Income Subsidy in Part D (many of whom used to be eligible for these rebates before the enactment of Part D). The President's budget includes such a policy, which is projected to save $116 billion over ten years. CBO notes that the LIS takes up a greater share of the drug market than Medicaid, so applying rebates there as well would increase the share of drugs covered by rebates from 8 percent to 23 percent. This expansion would either discourage the creation of new drugs or cause manufacturers to raise their prices somewhat for new drugs (the inflation rebate prevents any gain from raising prices for existing drugs). The report stated that the size of these offsetting effects are uncertain, meaning the policy could keep most of the savings but more heavily stem drug creation or lose a significant portion of the savings but have a minimal impact on drug innovation.
The CBO report is an interesting look at the causes of the recent slow growth in spending on prescription drugs and the trade-offs involved in different approaches to constraining Rx costs. Particularly given the recent rise of expensive specialty drugs, reforms might be in order to keep spending growth subdued.


