Alternatives for Measuring the Federal Deficit
One of the wonkier fiscal debates that arises from time to time concerns the accounting method used to measure the size of the budget deficit. This week, the U.S. Government Accountability Office (GAO) published an online primer that explains the different ways to measure the deficit and what these measures say about the government’s fiscal health. Specifically, the GAO tries to show the difference between "cash deficits" and "accrual deficits," featuring an overview, an FAQ on the issue, and a numerical breakdown of the differences between the estimates.
GAO finds that while official government measurements show a deficit of $680 billion in 2013, measuring the deficit on an accrual basis would lead to a deficit of more than $805 billion.
This difference can be explained by the different methods of accounting. Under cash accounting, spending and revenue are recorded when cash is paid or received. In contrast, accrual accounting records costs in the year they are incurred – such as when a contract is entered into, when a commitment is made or when a good or service is used – regardless of when cash actually changes hands.
CBO and OMB measure the federal deficit using "modified cash accounting," generally measuring the deficit as the difference between cash taken in and cash paid out (some spending such as student loans, however, is not measured on a cash basis). Although this measure is a better indicator of the government's short-term borrowing needs, it fails to give policymakers information about the new obligations the government is entering into each year.
Conversely, accrual accounting factors in obligations made, but not yet paid. For example, all the future benefits from a military pension appear on the government's books in the year a servicemember earns the benefit under accrual accounting. Under cash accounting, benefits don't appear on the books until the year they are paid. Importantly, neither measure accounts for the future unfunded commitments of programs like Social Security and Medicare.
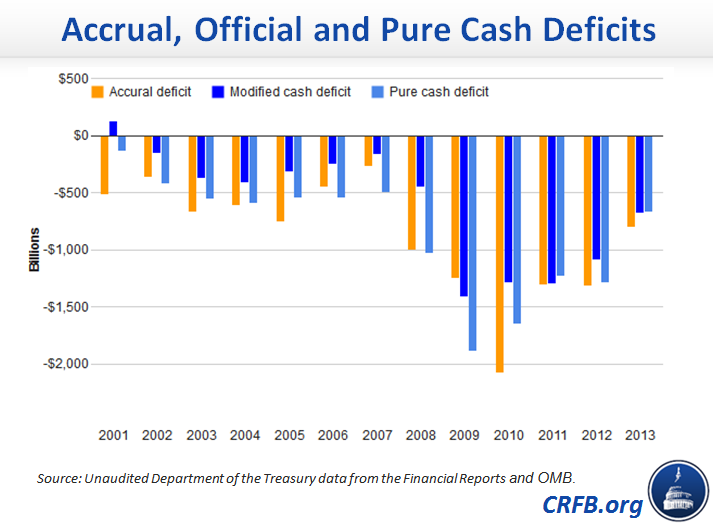
Despite that, there can be significant annual differences between the measures. For example, in 2001, the country was running a small surplus on official measures and on a pure cash basis. But on an accrual basis, the country ran a deficit of over $500 billion.

Source: GAO and OMB
Indeed, the accrual deficit has exceeded the official deficit and the pure cash deficit every year but one since 2001. In FY 2013, the accrual deficit totaled $805 billion, which was around a fifth more than the $680 billion official deficit and a seventh more than the $701 billion pure cash deficit.
The table below highlights the programs that account for some the largest differences between these two measures. It also shows the reconciliation between the accrual deficit and what the GAO calls the "cash" deficit (though it actually refers to the modified cash deficit). The positive numbers in the table reduce the size of the "cash" deficit relative to the accrual deficit, while negative numbers increase the relative size of this cash deficit. While the reasons for these differences vary by program, the positive numbers mostly reflect increases in expected future payments.
| Accrual Deficit (revenue minus expenses) | -$805.1 billion |
| Changes in liability for military employee benefits | -$43.9 billion |
| Changes in liability for veterans' compensation | +$213.2 billion |
| Changes in liability for civilian employees benefits | +$95.0 billion |
| Changes in environmental liabilities | +$10.1 billion |
| Depreciation expense (Related to: capital assets) | +$62.1 billion |
| Property, plant and equipment disposals and property reevaluations (Related to: capital assets) | -$36.2 billion |
| Changes in insurance & guarantee programs | -$26.4 billion |
| GSE financial assets & liabilities(e.g., liquidity guarantee, valuation loss on investments, stock received) | -$39.9 billion |
| TARP year-end upward/(downward) re-estimate (Related to: financial assets & liabilities) | -$8.1 billion |
| Other | -$3.8 billion |
| Total (accrued expenses in excess of cash outlays) | $222.1 billion |
| Capital assets (Capitalized fixed assets) | -$67.6 billion |
| Effect of prior year TARP downward re-estimate (Related to: financial assets & liabilities) | +$9.0 billion |
| Changes in other assets | -$40.3 billion |
| Total (cash outlays that do not involve current year expenses) | -$98.9 billion |
| Net amount of all other differences | $1.6 billion |
| Cash Deficit (receipts minus outlays) | -$680.3 billion |
Source: Closely modeled on chart produced by the GAO
In FY 2013, veterans' compensation caused the largest discrepancy between the two deficit measures, with the cost of expected future benefits increasing by $213 billion. As we have recently argued, this accrued expense would grow substantially under the House and Senate VA reform bills – although the outcome will depend on how the two chambers reconcile their differences via conference committee.
While all three deficit measures have shown an improvement in recent years, it remains clear that the debt is on an unsustainable path by any measure. Whether we measure the effects of the obligations we are making now, or we measure them when they are spent, the bills will eventually come due. And the additional costs incorporated in accrual measurements pale in comparison to the costs of Social Security and health care promises that cannot be kept with current revenue levels.
With appropriations season in full swing, lawmakers are busy focusing on the current deficit and next year’s spending levels. But with record and rising debt threatening the living standards of current and future generations, we would all benefit from a longer-term view.


