Reducing Medicare Advantage Overpayments
The Medicare Advantage (MA) program, which allows Medicare beneficiaries to enroll in federally-funded private health insurance plans, is an increasingly popular alternative to traditional fee-for-service (FFS) Medicare. However, the evidence indicates that MA plans are currently overpaid. This reduces market incentives for innovation by allowing plans to profit from the overpayments rather than through improvements in quality and efficiency.
The overpayments stem from incentives that lead MA plans to report enrollee diagnoses more completely than physicians billing FFS Medicare. MA plan beneficiaries thus appear sicker than they are relative to FFS beneficiaries, which leads to higher payments. The Centers for Medicare and Medicaid Services (CMS) is supposed to adjust payments to account for differences in diagnostic reporting (called “coding intensity”) but its adjustments have fallen well short of correcting the problem.
Over the next decade (2021-2030), policies to adjust MA payments more accurately for coding intensity could:
- Reduce net Medicare spending by a range of $198 to $355 billion, with just over half the savings accruing to the Medicare Part A Trust Fund
- Reduce premiums for Medicare beneficiaries by a range of $32 to $57 billion
- Reduce the federal budget deficit by a range of $207 to $372 billion
As part of the Health Savers Initiative, this paper presents a simple method to adjust for coding intensity that was discussed by CMS in 2015 and further developed and analyzed by Professor Richard Kronick of the University of California at San Diego.1 We also discuss the Medicare Payment Advisory Commission’s (MedPAC) method for estimating coding intensity and develop a range of possible Medicare savings.
Addressing this problem would improve the solvency of the Medicare trust fund and reduce the federal budget deficit. Given the high and rising costs of health care, a number of bold policy changes will be needed to assure long-term affordability and sustainability. In this context, fully adjusting for MA coding practices that result in overpayment could be considered an obvious option, particularly because this problem is well known and adjustments are already made; they are just inadequate.
The Health Savers Initiative is a project of the Committee for a Responsible Federal Budget, Arnold Ventures, and West Health, which works to identify bold and concrete policy options to make health care more affordable for the federal government, businesses, and households. This brief presents an option meant to be just one of many, but it incorporates specifications and savings estimates so policymakers can weigh costs and benefits, and gain a better understanding of whatever health savings policies they choose to pursue.
The Medicare Advantage Program
Medicare beneficiaries enrolled in Part A and B are given the option of enrolling in private Medicare Advantage (MA) plans rather than the traditional fee-for-service Medicare (FFS) program. Those plans operate much like health plans in the private insurance markets and negotiate networks and contracts with providers, use care management techniques to fill gaps in care delivery, and use prior utilization and medical necessity reviews in an attempt to reduce utilization of services that will not provide benefit to patients.
To attract beneficiaries, plans typically offer lower cost sharing than FFS for some services, as well as coverage for some services that traditional FFS does not cover. Many MA members have access to dental, vision, hearing, and wellness benefits, with 83 percent of individuals in MA paying $0 in monthly premiums.2 Further, CMS requires all MA plans to have the same cap on out-of-pocket spending.3 Likely because of the extra benefits and lower cost sharing, MA receives high satisfaction ratings from enrollees and bipartisan support from members of Congress.4
Enrollment in Medicare Advantage more than doubled over the last decade from 11.1 million enrollees in 2010 to 24.1 million in 2020, and the percentage of Medicare enrollees who chose an MA plan over traditional FFS has risen from 24 percent to 39 percent over the same time span. The Congressional Budget Office (CBO) projects that share will rise to 49 percent by 2029.5
This growing popularity makes ensuring proper payment levels of great importance for the federal budget and for fulfilling the promise of MA itself. If MA plans can make profits simply by taking advantage of overpayments, their incentive to innovate and improve quality and efficiency is diminished.
As has been demonstrated by MedPAC, the GAO, and others, MA plans are being overpaid, and are using the overpayments in part to offer lower cost sharing and greater benefits, and in part to increase their profits.6 It is possible that even without overpayments MA plans would still see growing enrollment and popularity due to their efficiencies and innovation, but it’s clear that under the current system of risk adjustment, there is a thumb on the scale.
How Medicare Advantage Plans Are Paid
Each year, MA plans submit a “bid” to CMS, where the bid is equal to the amount that the plan needs to cover expected costs for an average Medicare beneficiary. If the bid is below the CMS-determined county-level benchmark, plans receive a portion of the difference between the bid and the benchmark as a ‘rebate’.7 MA plans are required to use the rebate to lower beneficiary cost sharing, enhance benefits, or lower premiums.
Payments to MA plans are adjusted to ensure plans are paid more for older and sicker enrollees, and less for enrollees who are younger and healthier. This risk adjustment is intended to ensure payments adequately cover the costs of providing care to beneficiaries most in need, including those with complex conditions, and to prevent insurance companies from profiting simply by enrolling the healthiest beneficiaries.
CMS uses a risk adjustment model that converts an enrollee’s demographic and diagnostic information into a risk score for each beneficiary. Risk scores reflect the projected health expenditures for an individual, relative to an individual of average health risk, and higher risk scores result in higher payments to MA plans to cover the enrollee’s expected cost of care.
Because diagnoses are key to determining the level of MA payments, MA plans are incentivized to discover and code complete diagnostic information on enrollees. Those reporting incentives don’t exist in traditional FFS — providers often code only enough diagnoses to justify the use of the specific procedure or service for which the provider is seeking payment, often resulting in incomplete recording of diagnoses.
As well documented by MedPAC, MA plans use a variety of strategies to fully report enrollee diagnoses.8 For example, they hire nurses to conduct home-based health risk assessments. They contract with third party vendors to engage in chart review programs; these vendors tout the large return on investment they deliver by reviewing patient medical charts to find diagnoses and conditions that physicians had not coded. These vendors defend their practices by stating their products increase accuracy of their clients’ diagnostic data.9 Some MA plans pay medical groups a percentage of premium revenue; these groups have a strong incentive to report diagnoses that would increase premiums but that may not be reported in FFS.
The result of these behaviors and incentives is that Medicare pays more, on average, for a beneficiary enrolled in Medicare Advantage plans than it would if that same beneficiary were enrolled in FFS. CBO has recognized this difference, increasing its Medicare spending projections to reflect increases in MA enrollment and stating the expectation that MA beneficiaries “will be coded as being in poorer health.”10
As shown below, Congress and CMS recognize the problem and have made some adjustments for coding intensity differences between MA and FFS. However, those adjustments fall short of fully accounting for the degree to which MA plans are overpaid for the risks they assume. A coding intensity adjustment, if properly configured and constructed, assures that MA plans are paid appropriately.
The Case for Further Coding Intensity Adjustments
Figure 1 provides evidence that over the past decade, MA risk scores have grown considerably, relative to FFS risk scores. Specifically, the average MA risk score in 2006 was 98 percent of the FFS average, and in 2017, the latest year with publicly available data, average MA risk was an estimated 112 percent of FFS.11 While it is theoretically possible that the increase in MA risk was due to an increase in the acuity of MA enrollees, three other measures of risk show much smaller increases in MA acuity over similar time periods:
- Standardized mortality rates for MA enrollees changed little over the 2009 to 2019 period and were about 90 percent of the mortality rate of FFS beneficiaries.
- The relative risk of MA measured with a risk score based on prescription drug utilization changed very little from 2008 to 2014.12 While the prescription drug-based risk score increased slightly, the increase was much smaller than the increase in the CMS risk score.
- Relative MA risk measured using demographic characteristics changed very little from 2009 to 2019.13 This demographic method of measuring risk (using age, gender, Medicaid status, and institutional status) was used prior to the introduction of diagnostically based risk adjustment in 2000.
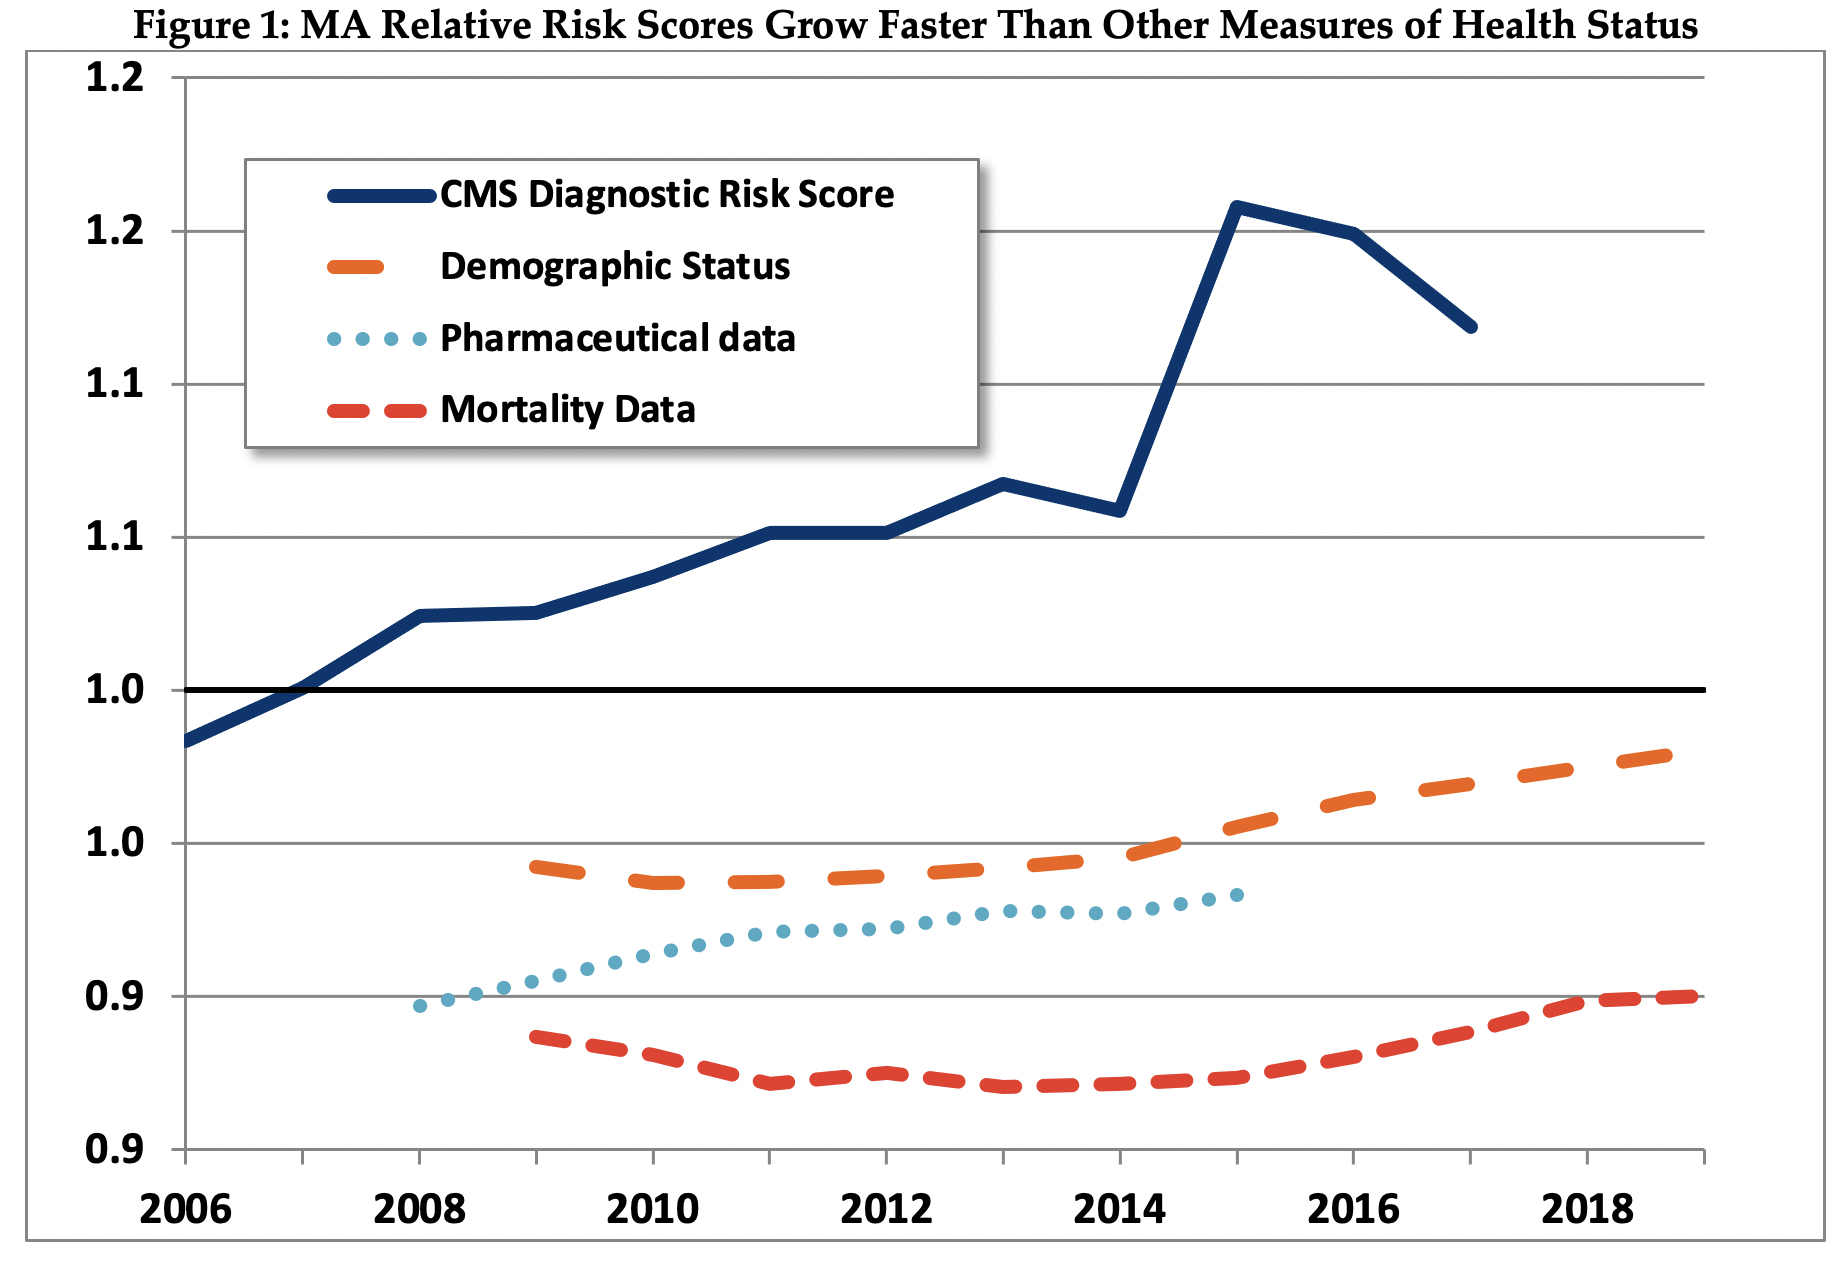
Source: Pharmaceutical data from Jacobs and Kronick, 2018. Other estimates as described briefly in th Appendix, and in more detail in Kronick and Chua, 2021.14
The finding that three separate measures of MA relative risk each show relatively small increases in MA risk supports the conclusion that most of the increase in MA measured risk using CMS’ current adjustment system is due to differential coding between MA and FFS, not to real change in the relative acuity of MA members.
Further, using each of these three measures, MA enrollees are estimated to be less risky than FFS beneficiaries – the relative risk scores for MA using all three of these measures are consistently below 1.0. That is, MA members have demographic characteristics that lead us to expect lower expenditures on MA members than on FFS beneficiaries, take fewer drugs that are associated with high-cost conditions, and have lower mortality rates. The only measure on which MA members appear to be sicker than FFS beneficiaries is the measure that MA plans strongly influence – their diagnosis-based risk score. This finding, similar to findings from other researchers, provides support for the proposition that MA members appear to be sicker not because they are actually sicker, but rather because diagnostic information is reported differently by MA plans.15
Recent Efforts and Proposals to Address Medicare Advantage Coding Intensity
Recognizing that MA plans have strong incentives to report more diagnoses than in FFS, Congress authorized CMS to measure and adjust for differential patterns of coding between MA and FFS in the Deficit Reduction Act of 2005. In 2010, CMS implemented its first coding intensity adjustment and reduced across-the-board MA plan payments by 3.41 percent. CMS could have made a larger adjustment, which would have been quite reasonable and resulted in an adjustment of approximately 6.5 percent.16 It seems possible that CMS decided to implement a smaller rather than a larger adjustment out of concern for disruption to the MA industry and adverse political reaction.
In the Affordable Care Act, and subsequently, in the American Taxpayer Relief Act of 2012, Congress specified a minimum schedule of adjustments, starting at 4.9 percent in 2014, increasing to 5.9 percent in 2018. CMS retains the authority to implement adjustments larger than that statutory minimum, but has not yet done so.
CMS has made changes to its risk adjustment model to address differential coding, most notably in 2014. Further, in 2017, CMS changed how the model accounts for beneficiaries eligible for both Medicaid and Medicare. These changes collectively reduced MA payments by approximately 3.5 percent. However, in the 21st Century Cures Act (2016), Congress directed CMS to consider undoing some of the 2014 changes — which in 2019 began to phase in and will lead to increased MA relative risk and payment.
MedPAC has recommended that diagnoses reported in home-based health risk assessments not be used in constructing risk scores, and that two years of diagnostic information should be used to construct risk scores (as opposed to one, as is currently used).17 These two recommendations would help make the diagnostic information on FFS and MA beneficiaries more comparable. To further adjust for the effects of differential coding, MedPAC has also recommended that CMS “apply a coding adjustment that fully and equitably accounts for the remaining differences in coding between FFS Medicare and MA plans.”18 MedPAC has not made a recommendation regarding how CMS should measure the effects of differential coding when making this adjustment.
In the material below, we provide suggestions for how the effects of differential MA coding could be measured, including through a method developed by MedPAC, and we estimate the potential savings effects were these methods implemented by CMS.
A Simple Method to Adjust for Differential Coding Between MA and FFS
Part of the reason that CMS has not yet adequately adjusted for differential MA coding is that there is not yet consensus in the policy community about how best to measure differential coding, and how large an appropriate adjustment would be (although there is nearly universal consensus among analysts that the current 5.9 percent adjustment is insufficient.)
In 2015, CMS asked for comment on a simple method to measure and adjust for coding intensity. This method, which in this brief we title the “Demographic Estimate of Coding Intensity”, or DECI, has been further described and analyzed by Professor Richard Kronick of the University of California at San Diego.19
The basic assumption underlying the DECI method is that, controlling for demographics, MA members are no healthier and no sicker than similar FFS beneficiaries. The DECI method assumes that any difference between the diagnostic and the demographic-only risk scores shown in Figure 1 is a result of differential coding between MA and FFS, and estimates the coding intensity adjustment by comparing the relative risk of MA to FFS using the diagnostic model with the relative risk of MA using the demographic model (see the Appendix for details on the calculation).20
As shown in Figure 2, the DECI method estimates a coding intensity adjustment of 4.5 percent in 2006, increasing to 15.4 percent in 2017.21 For each year, the coding intensity adjustment estimated by the DECI method is substantially larger than the adjustment CMS made.
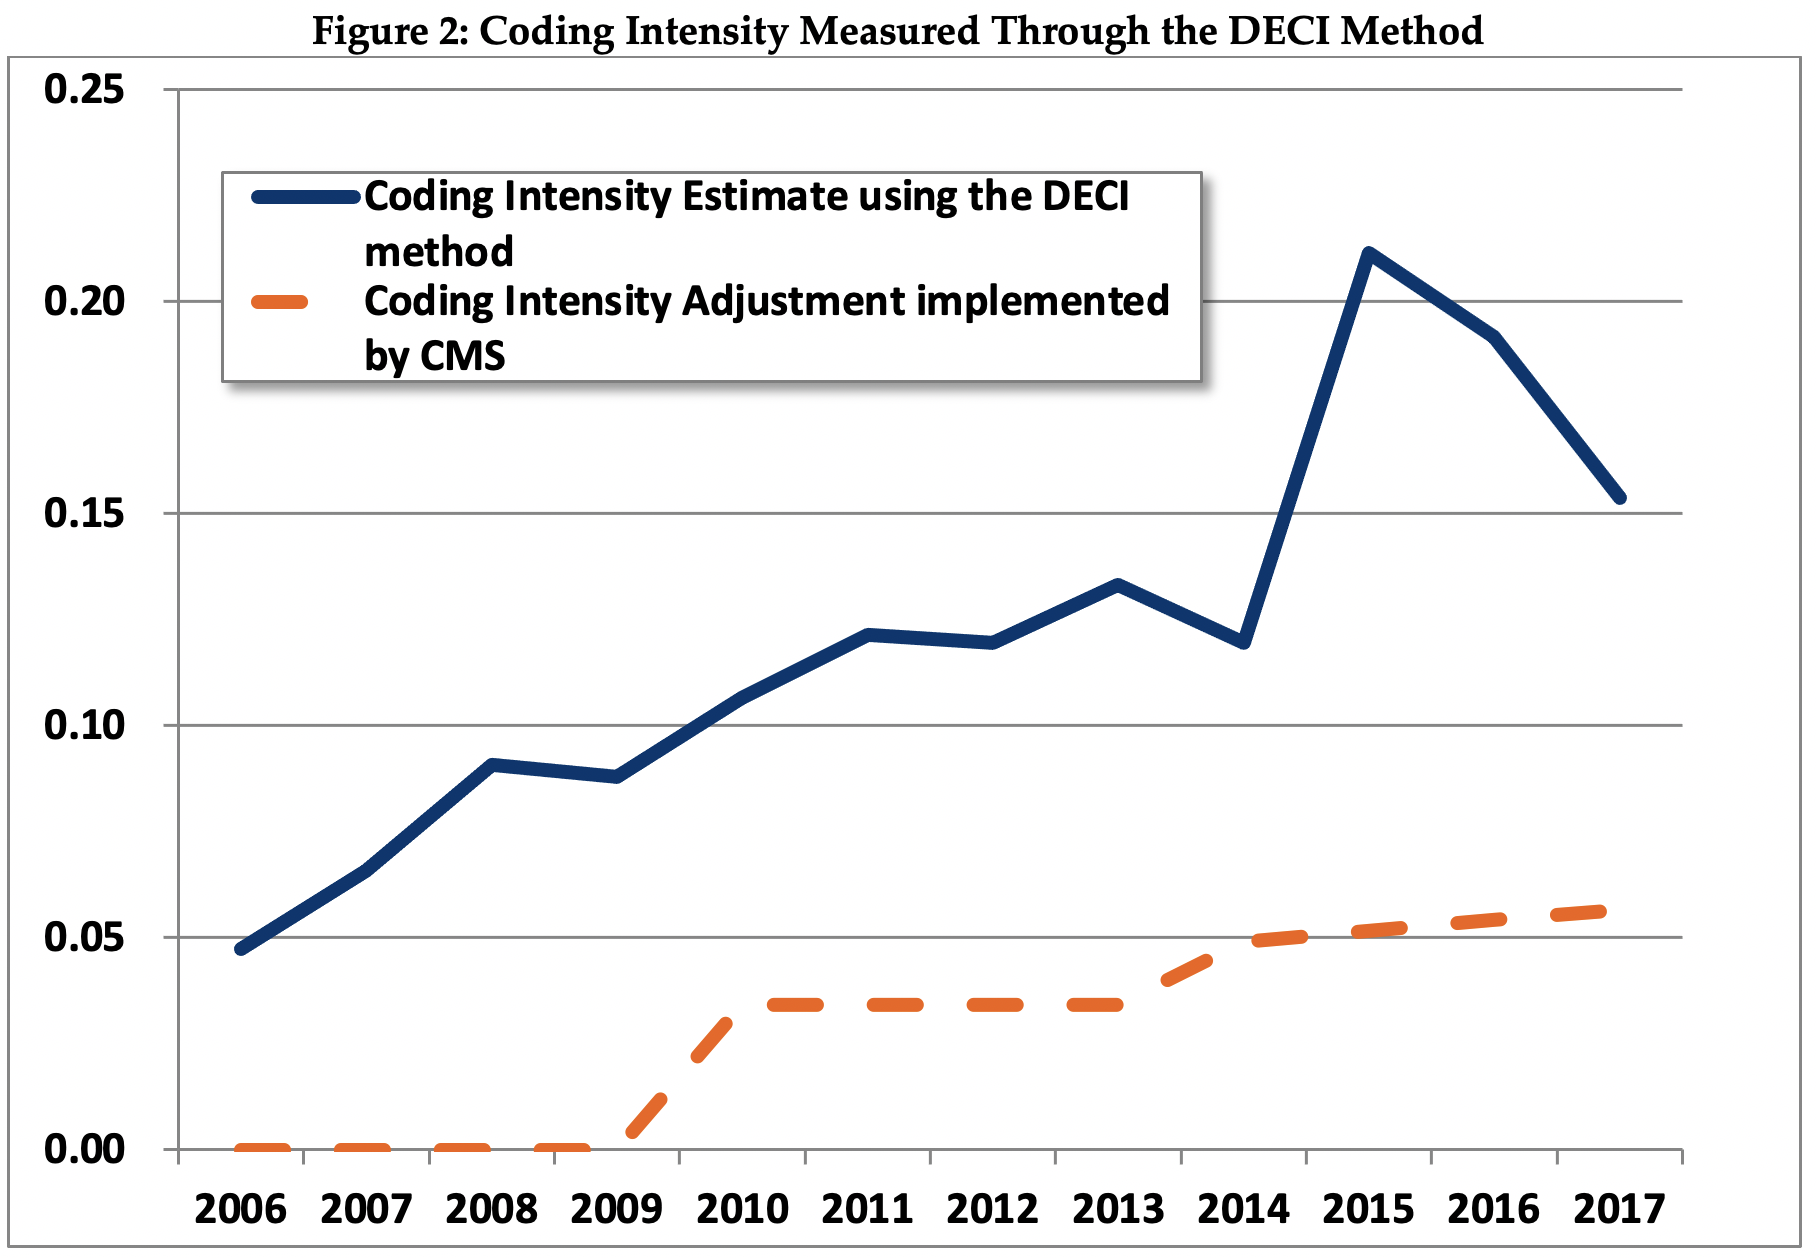
Over the 2006 to 2017 time period, the average rate of increase in estimated coding intensity using the DECI method was 1.0 percent per year.22 The estimated rate of increase in coding intensity as measured by the DECI method is similar to the rate of increase as measured by MedPAC.23
MedPAC’s Method for Estimating Coding Intensity
MedPAC has also developed a method for estimating coding intensity, although they have not explicitly recommended that CMS use the method it developed or that CMS apply an across-the-board adjustment. MedPAC estimates that differential coding resulted in MA risk scores that were on average 7 percent higher in 2017 than they would have been if coding were the same in MA and FFS, a smaller estimate than DECI’s 15.4 percent. MedPAC’s coding intensity estimate for 2018 is 8 percent, and 9 percent for 2019.24
MedPAC’s method creates age-gender specific cohorts of MA beneficiaries based on length of enrollment in MA, creates comparable matched cohorts of FFS beneficiaries with similar lengths of enrollment in FFS, and compares the rate of growth of risk scores in each MA cohort to the rate of growth in the matched FFS cohort.
The basic assumption underlying the MedPAC method is that the rate of increase in the average risk score for a cohort of beneficiaries enrolled in MA for a specified period of time (e.g. two years, three years, etc.) should be the same as the rate of increase in the average risk score for a cohort of similar age and gender continuously enrolled in FFS for the same period of time. Further work is needed to understand why the estimates produced by the MedPAC and DECI methods diverge.
Estimated Fiscal and Financial Impact
This brief uses the coding differentials estimated with the DECI and MedPAC methods to illustrate the savings that policymakers could obtain by tackling MA overpayments. As shown in Figure 3, we estimate a range of savings over the 2021-2030 budget window that could be achieved if CMS were to adjust payments beyond the 5.9 percent statutory minimum (with 2023 being the first year we assume a plan payment adjustment would be possible).
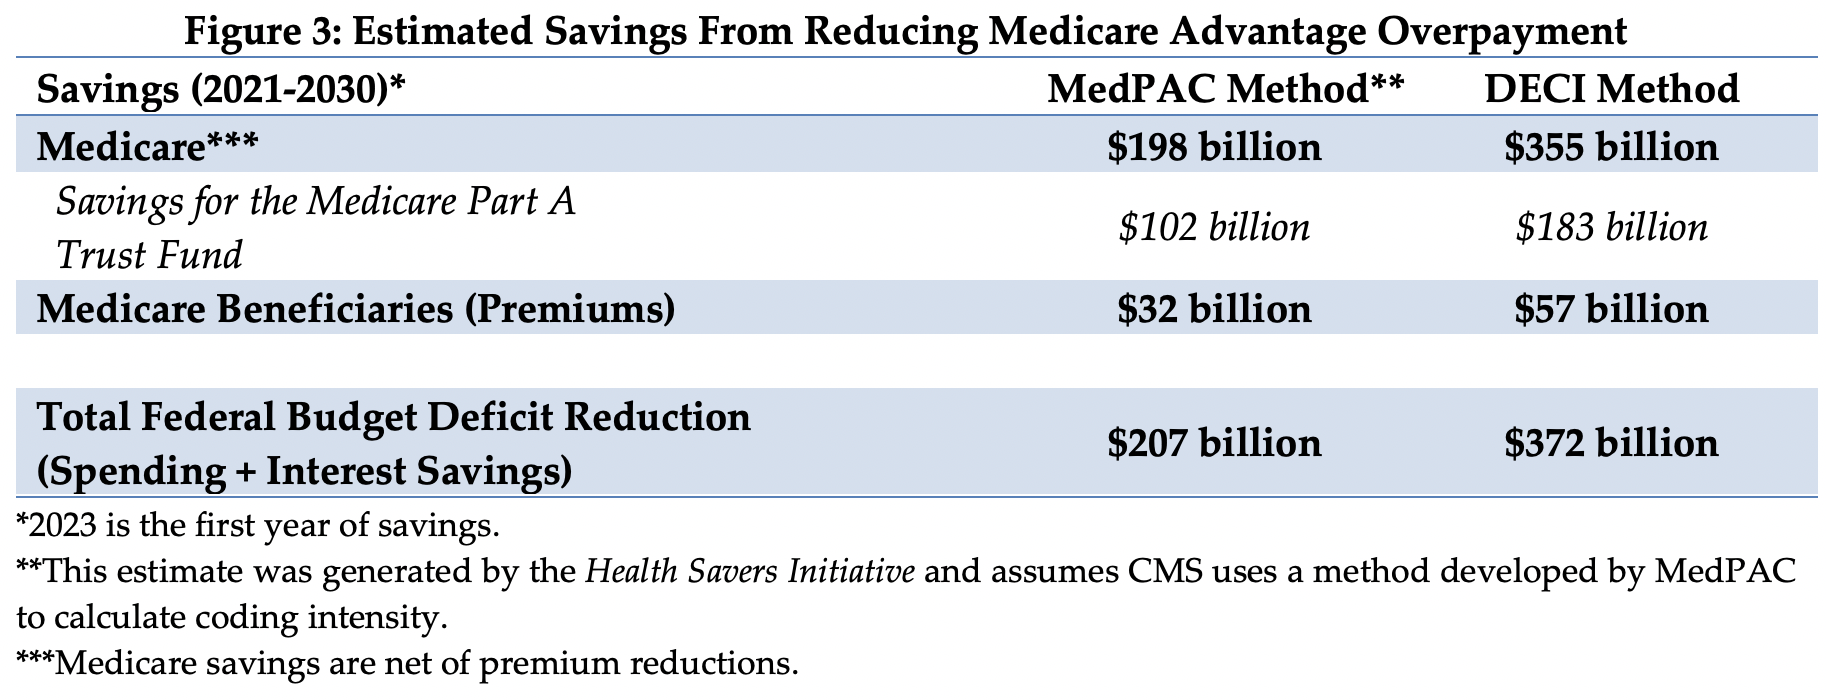
If the DECI method of estimating and adjusting were implemented, we estimate net Medicare spending could decline by $355 billion. Of the savings, $183 billion would accrue to the Medicare Part A trust fund. In addition, Part B beneficiary premiums would be $57 billion lower. The total savings from the policy would be 7.9 percent of the expected $5.2 trillion in spending on MA plans during this time period.
If the MedPAC method were used, we estimate savings would be lower compared to the DECI method. Net Medicare spending would decline by $198 billion, with $102 billion in savings accruing to Part A and $32 billion in reduced Medicare premiums.25
The 10-year savings estimates for both the DECI and MedPAC methods are sensitive to the estimated rate of annual coding intensity increase through the end of the budget window. To be conservative, our estimate assumes that annual increases in coding intensity will decrease linearly from 1.0 percent in 2017 to 0.5 percent in 2030.26
Using either the DECI or MedPAC method, it is clear that the current coding intensity adjustment is too small and that a larger adjustment should be made to avoid continued overpayments to MA plans. The estimates above assume a full adjustment is implemented at the earliest date possible (in 2023). Policymakers could decide to ramp up adjustments more gradually in order to limit disruption to MA plans and beneficiaries.
There is substantial heterogeneity across MA plans in the extent to which they code differently than FFS – some plans code much more than FFS, while others code similarly to FFS.27Any across–the-board coding intensity adjustment will inevitably be an adjustment that is too large for some plans and too small for others. MedPAC’s position is that an adjustment should account for heterogeneity and be applied as equitably as possible and MedPAC has not recommended that its method be applied to plans across-the-board. There has been some MedPAC discussion of tiered adjustments, in which a larger adjustment is implemented for contracts that code more intensely, with a smaller adjustment for others.28
However, devising and implementing adjustments that differentiate among contracts will inevitably be complicated and contentious. We suggest starting by implementing an adjustment that is, on average, fair and equitable, and then consider moving to an adjustment framework that recognizes heterogeneity across plans.
Appendix: Estimation Methodology
The estimates in this document were produced through the joint effort of the partner organizations: The Committee for a Responsible Federal Budget, Arnold Ventures, and West Health.
The starting points for savings estimates were the March 2020 Congressional Budget Office baseline. The Health Savers Initiative will use this pre-Covid-19 baseline for all options to allow for the best comparisons because the full impact of Covid-19 on the baseline is unknown at this time.
Implementing the Demographic Estimate of Coding Intensity (DECI) method entails three simple steps:
- Calculate the average MA risk score divided by the average FFS risk score using the CMS-HCC (diagnostic) system that CMS uses for plan payment. As shown in Exhibit 1, estimated relative MA risk in 2017 was 1.119 – that is, measured MA risk was an estimated 12 percent above the FFS level in 2017
- Calculate the average MA risk score divided by the average FFS risk score using demographic data and the Adjusted Average Per Capita Cost (AAPCC) system. The AAPCC system, which was used prior to the introduction of diagnosis-based risk adjustment, uses age, gender, Medicaid status and institutional status to measure risk. As shown in Figure 1, estimated AAPCC-based MA relative risk in 2017 was 0.97. MA relative risk using the AAPCC system is less than 1.0 primarily because MA enrollees are less likely that FFS beneficiaries to be institutionalized, and institutionalized enrollees have higher than average risk scores.
- Divide MA relative risk using the CMS-HCC system by MA relative risk using the AAPCC system, and subtract 1.0 from the quotient to calculate the coding intensity adjustment. In 2017, dividing 1.119 by 0.97 and subtracting 1.0 from the quotient yields 0.154, or a 15.4 percent coding intensity adjustment.
To implement the DECI method, estimates are needed of two quantities: first, MA relative risk using the CMS-HCC method, and second, the MA relative risk using the AAPCC method. A brief overview of data sources and analytic methods is provided here. Details can be found in Kronick and Chua’s 2021 paper.29
To estimate average MA risk scores, we use plan payment data, published by CMS for each year from 2006 to 2017. These data provide the risk score for each MA contract-plan combination. We obtain enrollment statistics for each contract-plan combination from CMS and use July 1 enrollment to estimate the weighted average risk score for each contract in each year, and similarly calculate the average MA plan payment risk score for each year from 2006 through 2017.30
Methods to Estimate the Effects of Coding Intensity on Medicare Spending, 2021-2030
We use the CBO March 2020 baseline to estimate Part A, Part B spending ratios, and MA plan spending. MA plan spending is estimated by multiplying the sum of Part A and B spending by the proportion of all beneficiaries enrolled in MA.
As discussed in footnote 25, we assume that for each 1 percent increase in the coding intensity adjustment, MA bids will not change, the risk adjusted benchmark will decrease by 1 percent, and Medicare spending will decrease by 0.65 percent as a result of decreased rebate payments.
The coding intensity adjustment is applied by multiplying each CMS-HCC risk score by (1/1+ coding intensity adjustment). For example, the 5.9 percent coding intensity adjustment is applied by multiplying the CMS-HCC risk score by 0.944 (that is, 1/1.059). To estimate the difference in spending given the coding intensity adjustment estimated by DECI with the statutory minimum 5.9 percent, we multiply estimated MA spending in 2023 and each subsequent year by 0.65*(1/(1+DECI_CI))/(1/1.059), where DECI_CI is the DECI estimate of coding intensity for the year.
To estimate the effect of implementing the DECI method on Medicare spending, we start with the 15.4 percent estimate of coding intensity in 2017. Although differential coding has caused MA risk scores to increase by 1 percent more per year than FFS risk scores from 2006 to 2017, to be conservative, we assume that the rate of increase will slow down, trending downward linearly to 0.5 percent by 2030.
We use identical methods to estimate the effect of implementing the MedPAC method of measuring coding intensity, with the exception that we start with the MedPAC coding intensity estimate of 9 percent for 2019.
To estimate the effect on total Medicare Part A savings, we take total Medicare savings and multiply it by Part A’s share of Part A and Part B expenditures. Part B savings are calculated in a similar fashion, where total Medicare savings are multiplied by Part B’s share of Part A and B expenditures. We assume that beneficiaries will receive 25% of the Part B savings.
For both the DECI and MedPAC methods, we assume that MA enrollment will follow the path projected by CBO in the March baseline. It seems likely that larger coding intensity adjustments would have some effect on the rate of growth of MA enrollment, but we do not attempt to model that effect.
The impact on the federal budget deficit was calculated by adding net Medicare savings to interest cost savings estimated using CBO’s October 2020 interactive debt matrix.
1 This option was initially described by CMS in the 2016 Advance Notice, although CMS did not implement the option in final rate announcement. Kronick worked alongside the Health Savers Initiative in specifying, estimating and writing this option and brief. CMS, “2016 Advance Notice,” February 2015, https://www.cms.gov/Medicare/Health-Plans/MedicareAdvtgSpecRateStats/Announcements-and-Documents-Items/2016Advance.
2 Jeff Lagasse, “Open Enrollment: 83% selecting Medicare Advantage chooses plans with $0 premiums,” Healthcare Finance, November 2019, https://www.healthcarefinancenews.com/news/open-enrollment-83-selecting-medicare-advantage-choose-plans-0-premiums.
3 The regulated cap on out-of-pocket spending was $7,550 in 2021.
4Better Medicare Alliance, “New Poll: Medicare Advantage Satisfaction Soars to Record 94%,” November 2019, https://www.bettermedicarealliance.org/news/new-poll-medicare-advantage-satisfaction-soars-to-record-94/; Better Medicare Alliance, “Medicare Advantage Bipartisan Support in Congress Grows,” February 2019, https://www.bettermedicarealliance.org/news/medicare-advantage-bipartisan-support-in-congress-grows/.
5 CBO, “Details About Baseline Projections for Selected Programs—Medicare,” March 2020 and August 2010, https://www.cbo.gov/data/baseline-projections-selected-programs#10.
6 MedPAC, “The Medicare Advantage program: Status Report,” March 2019 and March 2020, https://medpac.gov/docs/default-source/reports/mar19_medpac_ch13_sec.pdf. https://www.medpac.gov/docs/default-source/reports/mar20_medpac_ch13_sec.pdf; GAO, “MEDICARE ADVANTAGE: Fundamental Improvements Needed in CMS’s Effort to Recover Substantial Amounts of Improper Payments,” U.S. Government Accountability Office, April 2016, https://www.gao.gov/products/GAO-16-76; Michael Geruso and Timothy J. Layton, "Selection in Health Insurance Markets and Its Policy Remedies," Journal of Economic Perspectives, 2016, 31 (4): 23-50, DOI: 10.1257/jep.31.4.23.; Paul D Jacobs and Richard Kronick, “Getting What We Pay For: How Do Risk-Based Payments to Medicare Advantage Plans Compare with Alternative Measures of Beneficiary Health Risk?,” Health Serv Res, December 2018, 53(6):4997-5015; Paul D Jacobs and Richard Kronick, “The effects of coding intensity in Medicare Advantage on plan benefits and finances,” Health Services Research, November 2020, DOI: 10.1111/1475-6773.13591; Richard Kronick and W Pete Welch, “Measuring coding intensity in the Medicare Advantage program,” Medicare & Medicaid Research Review vol. 4,2 mmrr2014.004.02.a06. July 17, 2014, https://doi.org/10.5600/mmrr2014-004-02-a06.
7 The portion of the rebate varies depending on the plan’s star (quality) rating, and averages approximately 65%.
8 MedPAC, “The Medicare Advantage program: Status Report,” March 2019 and March 2020, https://medpac.gov/docs/default-source/reports/mar19_medpac_ch13_sec.pdf, https://www.medpac.gov/docs/default-source/reports/mar20_medpac_ch13_sec.pdf.
9 Shelby Livingston, “Insurers profit from Medicare Advantage’s incentive to add coding that boosts reimbursement,” Modern Healthcare, September 2018, https://www.modernhealthcare.com/article/20180901/NEWS/180839977/insurers-profit-from-medicare-advantage-s-incentive-to-add-coding-that-boosts-reimbursement.
10 CBO, “The Budget and Economic Outlook: 2020-2030,” January 2020, https://www.cbo.gov/publication/56073. See also CBO, “Modify Payments to Medicare Advantage Plans for Health Risk,” Options for Reducing the Deficit: 2019-2028, December 2018, https://www.cbo.gov/budget-options/2018/54736.
11 Methods for the results shown in Exhibit 1 are described briefly in the Appendix, and in more detail in Kronick R and Chua FM, Estimating the Magnitude of Medicare Advantage Coding Intensity, February 2021, accessible at: https://papers.ssrn.com/sol3/papers.cfm?abstract_id=3792038.
12 Pharmaceutical results are from Paul D Jacobs and Richard Kronick, “Getting What We Pay For: How Do Risk-Based Payments to Medicare Advantage Plans Compare with Alternative Measures of Beneficiary Health Risk?,” Health Serv Res, December 2018, 53(6):4997-5015. If MA enrollees were actually getting sicker, we would expect increases in utilization of pharmaceuticals associated with high-cost diagnoses.
13 These four demographic characteristics were the basis for measuring risk using the Adjusted Average Per Capita Cost, (or AAPCC) system used prior to the new CMS-HCC model. The increase in relative risk from 2015 to 2019 using the AAPCC method was primarily a result of increasing numbers of relatively high risk dual eligible Medicaid beneficiaries enrolling in MA.
14 See Kronick R., and Chua FM., Methods for Estimating Coding Intensity using the Demographic Estimate of Coding Intensity (DECI) Method, February 2021, available at: https://papers.ssrn.com/sol3/papers.cfm?abstract_id=3792038.
15 See Michael Geruso and Timothy J. Layton, "Selection in Health Insurance Markets and Its Policy Remedies," Journal of Economic Perspectives, 2016, 31 (4): 23-50, DOI: 10.1257/jep.31.4.23; Newhouse JP, Price M, McWilliams JM, Hsu J , McGuire TG. “How much favorable selection is left in Medicare Advantage?” [Internet]. Cambridge (MA): National Bureau of Economic Research; 2014 Mar [cited 2016 Dec 22 ]. (NBER Working Paper No. 20021). Available from: www.nber.org/papers/w20021.pdf;Newhouse JP, Price M, McWilliams JM, et. Al. “Adjusted Mortality Rates Are Lower For Medicare Advantage Than Traditional Medicare, But The Rates Converge Over Time,” Health Affairs, April, 2019, https://doi.org/10.1377/hlthaff.2018.05390; Paul D Jacobs and Richard Kronick, “Getting What We Pay For: How Do Risk-Based Payments to Medicare Advantage Plans Compare with Alternative Measures of Beneficiary Health Risk?,” Health Serv Res, December 2018, 53(6):4997-5015; Richard Kronick and W Pete Welch, “Measuring coding intensity in the Medicare Advantage program,” Medicare & Medicaid Research Review vol. 4,2 mmrr2014.004.02.a06. July 17, 2014, https://doi.org/10.5600/mmrr2014-004-02-a06.
16 In estimating the 3.41% adjustment, CMS assumed that differential coding between 2004 and 2007 represented MA “catching up” to FFS coding patterns. If CMS had not made this assumption, the 3.41% adjustment would have been substantially larger. Further, although in the Advance Notice for 2010, CMS announced its intention to use 2008 data in estimating the final coding intensity adjustment, in the final Rate Announcement for 2010, CMS stated that it was not using the 2008 data. Use of the 2008 data would have increased the coding intensity adjustment above 3.41%. Notably, CMS has not published an estimate of coding intensity in any year since 2010.
17 MedPAC, “The Medicare Advantage program: Status Report,” March 2019 and March 2020, https://medpac.gov/docs/default-source/reports/mar19_medpac_ch13_sec.pdf, https://www.medpac.gov/docs/default-source/reports/mar20_medpac_ch13_sec.pdf.
18 MedPAC, “The Medicare Advantage program: Status Report,” March 2019 and March 2020, https://medpac.gov/docs/default-source/reports/mar19_medpac_ch13_sec.pdf, https://www.medpac.gov/docs/default-source/reports/mar20_medpac_ch13_sec.pdf.
19 See Kronick and Chua, 2021 and Richard Kronick, “Projected Coding Intensity In Medicare Advantage Could Increase Medicare Spending By $200 Billion Over Ten Years,” Health Affairs, February 2017, 1;36(2):320-327.
20 A potential concern about the DECI method is that at some point in the future MA members may be sicker than demographically similar FFS beneficiaries. CMS should be required to monitor measures of risk such as mortality rates, prescription-drug based risk scores, and information on switchers into and out of MA. If strong evidence emerges that MA members are sicker than demographically similar FFS beneficiaries, then the coding intensity estimate should be adjusted accordingly.
21 Given the limited information that is publicly available, it is difficult for a researcher not affiliated with CMS to precisely implement the DECI method, although it would be easy for CMS to do so. It seems unlikely that relative MA risk actually did increase sharply between 2014 and 2015, and then decline sharply between 2015 and 2017, and the result makes us somewhat suspicious of the data. However, we are at least partially reassured that estimated relative risk in 2017 is close to the 2013 value trended forward. One difficulty in implementing DECI with publicly available data is that there is little information on the average FFS risk score in each year – as described in Kronick and Chua, 2021, with the exception of 2017, we have been forced to rely on the estimates of the FFS normalization factor published by CMS to estimate the FFS average risk score. These estimates, which are projections based on historical data, inevitably contain error. Further, as discussed in Kronick and Chua, 2021, a small part of the odd-looking results between 2014 and 2017 can be accounted for by changes made to the version of the CMS-HCC model being used in those years, although the version changes appear to only account for a small part of the effect.
22 Changes made in the CMS-HCC model in 2014 and 2017 resulted in relative MA risk being approximately 3.5% lower in 2017 than it would have been using older versions of the model. In the absence of those changes in the CMS-HCC model, the estimated increase in coding intensity over the 2006-2017 period would have been 1.3% per year.
23 Luis Serna and Andy Johnson, “The Medicare Advantage Program: Status Report and a Benchmark Policy Option,” December 3, 2020, https://medpac.gov/docs/default-source/meeting-materials/ma-status-medpac-dec-2020.pdf?sfvrsn=0, slide 10.
24 Ibid.
25 MedPAC estimates that differential coding caused MA risk scores to be 9% higher than they would have been in 2019 if MA and FFS coding patterns had been identical. To estimate the 10-year savings, we assume that differential coding will cause that 9% estimate to increase at the same rate assumed for the DECI estimate, which started at a 1% increase in 2017, decreasing to 0.5% by 2030.
26 We make two other key assumptions that affect the 10-year budget estimates. First, we assume that the MA market is perfectly competitive, and that MA bids will not be affected by differential MA coding. Under this assumption, the budgetary effect of increased coding manifests through an increase in rebates, because higher risk scores result in a higher risk-adjusted benchmark. On average, MA plans receive rebates of approximately 65% of the difference between the bid and the benchmark. Hence, a 1% increase in risk scores is estimated to result in a 0.65% increase in spending for plans that bid below the risk-adjusted benchmark. For plans that bid above the risk-adjusted benchmark, a 1% increase in risk scores will result in a 1% increase in spending. To the extent that the MA market is not perfectly competitive, plans might increase their bids somewhat in response to an increase in risk scores, in order to keep their risk-adjusted bids constant. If, at the extreme, the risk-adjusted bids do not decline at all in response to increased coding, then the estimated budgetary effects would be 50% larger than estimated in the text. Second, we assume that MA enrollment will follow the path projected by the CBO in the March baseline, although larger coding intensity adjustments than assumed in the baseline might well lead to slower enrollment growth.
27 MedPAC, “The Medicare Advantage program: Status Report,” March 2019 and March 2020, https://medpac.gov/docs/default-source/reports/mar19_medpac_ch13_sec.pdf, https://www.medpac.gov/docs/default-source/reports/mar20_medpac_ch13_sec.pdf. Kronick and W Pete Welch, “Measuring coding intensity in the Medicare Advantage program,” Medicare & Medicaid Research Review vol. 4,2 mmrr2014.004.02.a06. July 17, 2014, https://doi.org/10.5600/mmrr2014-004-02-a06.
28 Andrew Johnson and Scott Harrison, Medicare Advantage: Calculating Benchmarks and Coding Intensity, November 4, 2016. https://www.medpac.gov/docs/default-source/meeting-materials/ma-ab-coding-nov16-for-laptop.pdf?sfvrsn=0. CMS similarly proposed a tiered adjustment in the Advance Notice for 2009, although they subsequently announced they would not be implementing any coding intensity adjustment in 2009. CMS Advance Notice and Rate Announcement, 2009. https://www.cms.gov/Medicare/Health-Plans/MedicareAdvtgSpecRateStats/Announcements-and-Documents.
29 Kronick R., and Chua M., Methods for Estimating Coding Intensity using the Demographic Estimate of Coding Intensity (DECI) Method, February 2021, https://papers.ssrn.com/sol3/papers.cfm?abstract_id=3792038.
30 As described in Kronick and Chua, 2021, we adjust the plan payment risk scores for the coding intensity adjustment and the FFS normalization adjustment to estimate average MA risk prior to those adjustments. We use data on the FFS normalization adjustment to estimate average FFS risk for each year.