A Lame Duck President in 2017?
by C. Eugene Steuerle, Maya MacGuineas, Tyler Evilsizer, and Caleb Quakenbush
This report represents a joint project of the Urban-Brookings Tax Policy Center and Committee for a Responsible Federal Budget (CRFB), with estimates derived from CRFB’s report Promises and Price Tags and the Urban-Brookings Tax Policy Center’s estimates of Clinton’s and Trump’s tax plans. The findings and conclusions contained within are those of the authors and do not necessarily reflect positions or policies of the Committee for a Responsible Federal Budget, the Tax Policy Center, or their funders.
Introduction
We usually think of lame ducks as politicians who have lost influence to their successors, but the next president could enter office with his or her influence already lost to his or her predecessors. The growing revenues that accompany economic growth traditionally provide a way for government to address new needs and priorities. But because of the increasing dominance of autopilot programs with built-in growth, all those revenues plus additional borrowing are required to pay for health and retirement expenses and interest on the debt.
Hillary Clinton’s and Donald Trump’s campaign promises differ significantly, but, with the exception of Trump’s tax cut and the associated rise in interest costs, neither would do much to change the overall composition of the budget or create the flexibility to address future needs related to young people, workers, defense, infrastructure, and basic government functions. Without changes to restore flexibility, the next president will find himself or herself presiding over budgets dictated almost entirely by previous presidents and Congresses.
Thus, rather than painting their own ambitious agenda for the future, both candidates have implicitly endorsed and prioritized a preordained path. The new spending initiatives the candidates are calling for are relatively small.
By allowing autopilot programs to continue to grow rapidly, the candidates support a growing long-term national debt (a much more rapidly growing one in Trump’s case because he also proposes large tax cuts) and federal spending that largely represents the status quo.
How Spending Increases Outpace Revenue
Under current law, revenues are expected to rise almost $850 billion annually by 2026 compared with 2016 (adjusted for inflation) because of a growing economy and population. As a share of the economy, revenue collection will grow from 17.8 percent of GDP today to 18.5 percent by 2026.
However, inflation-adjusted spending is projected to grow $1.28 trillion in 2026 relative to 2016 because of increasing health, retirement, and interest expenses. In other words, 150 percent of new revenue a decade from now is precommitted to spending growth scheduled under current law.
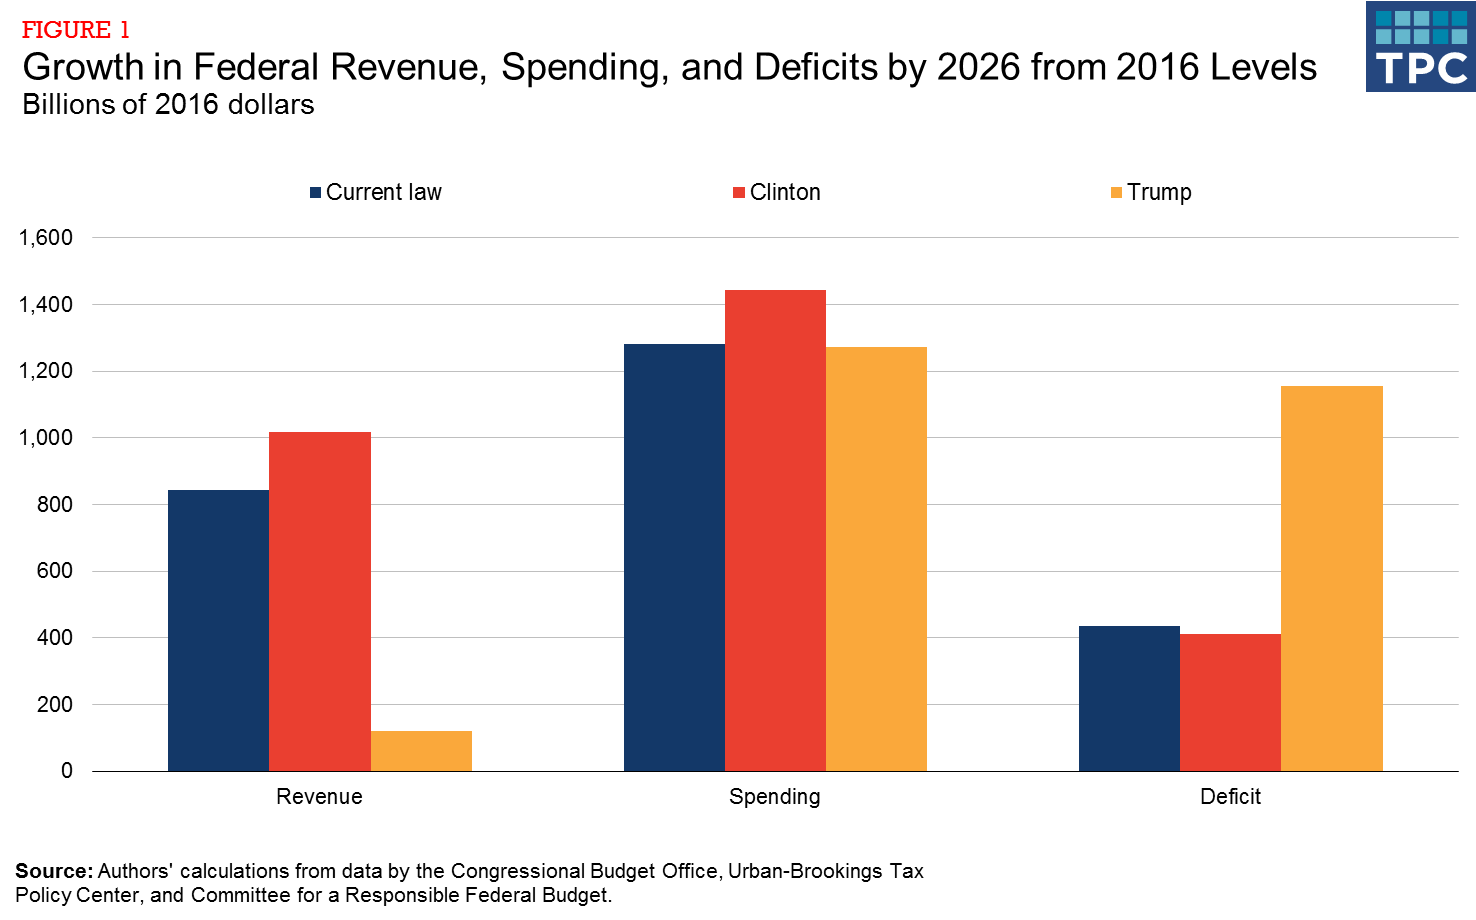
The candidates differ greatly on taxes and what spending categories deserve priority. But neither candidate would drastically alter the future level of spending relative to current law, and the deficit and debt would continue to increase.
If Trump’s proposals were enacted, annual revenues would climb only $120 billion between now and 2026, roughly one-seventh as much as under current-law projections. Spending would rise at about the same pace as current law, but because of Trump’s considerable tax cuts, this new spending would be more than 10 times larger than new revenue.
If Clinton’s proposals were enacted, annual revenue and spending would rise somewhat faster than under current law. Largely because of tax increases on high earners, revenue under Clinton’s plan would rise $175 billion over the $850 billion growth scheduled under current law. Meanwhile, spending—because of her plans to spend more on education, paid family leave, and other priorities—would rise an additional $160 billion over the $1.28 trillion under current law. The real gap between spending and revenue would improve only slightly at over $400 billion. None of this accounts for Clinton’s promise to increase Social Security benefits for widows and caregivers or how she would pay for them.
Spending Growth Would Largely Come From Autopilot Programs
Under current law, Social Security, health care, and interest will account for 97 percent of spending growth, while the remaining areas of the budget hardly garner any resources provided by a growing economy and growing revenues. As a share of GDP, those three categories continue to grow dramatically, the opposite direction from the rest of spending.
Regardless of who is the next president, much of this story is the same.
Under Trump, spending on Social Security, health care, and interest make up 100 percent of spending growth, as rising interest costs from bigger deficits dwarf savings attained by block-granting Medicaid or shrinking the nondefense budget. Under Clinton, Social Security (even before any additional reform she has promised), health, and interest make up about 87 percent of total spending growth partly because of introducing new spending initiatives and roughly the same interest costs, especially if she balances her new revenue and spending initiatives.
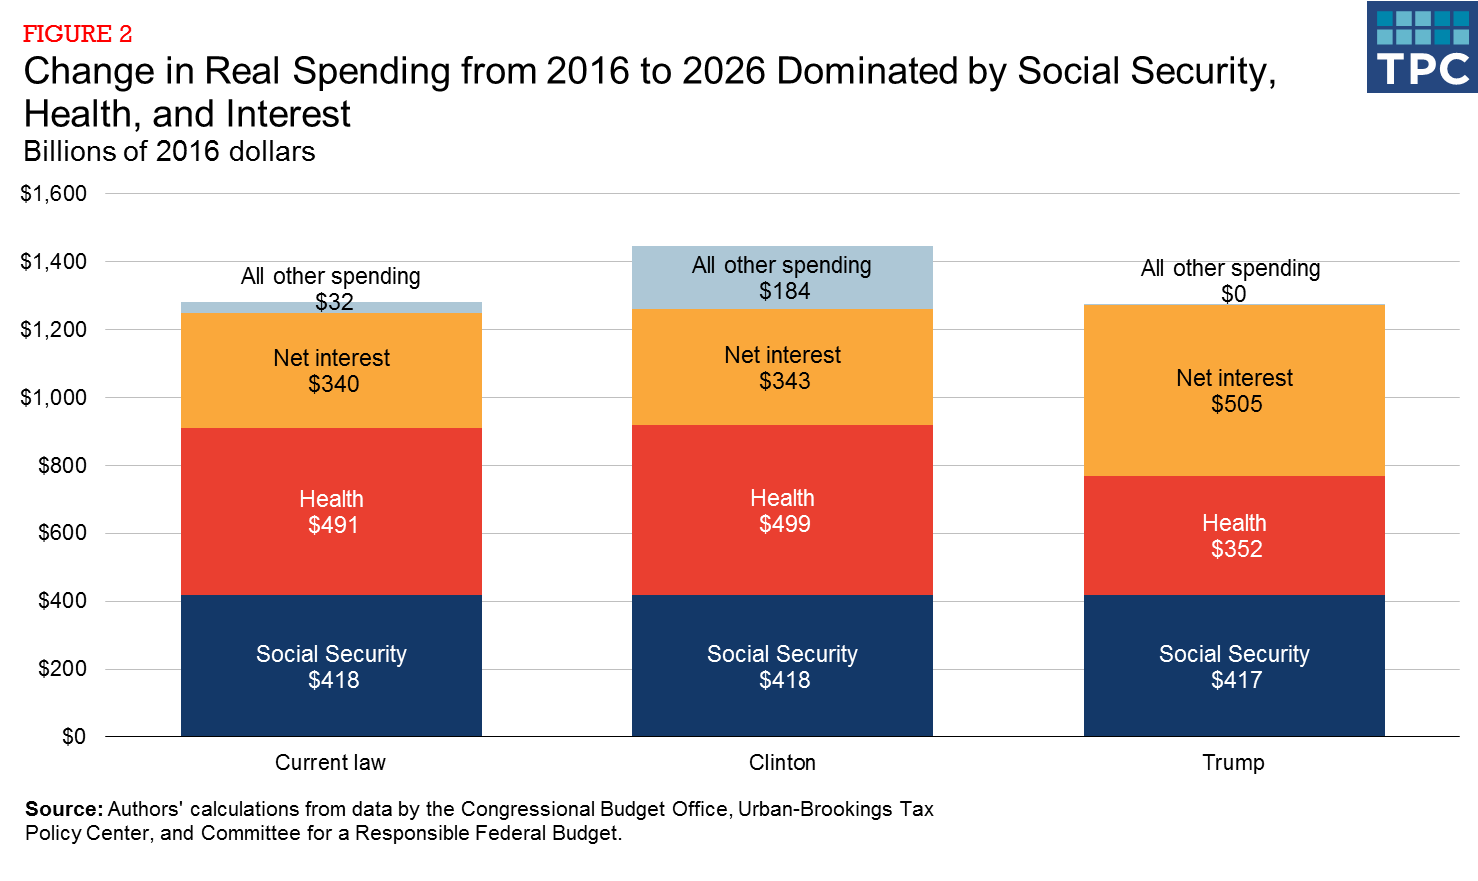
As Social Security, health, and interest spending rise over the next decade, combined investments in infrastructure, energy, and education will fall under current law. Under Trump, they would fall even faster. Under Clinton, they would grow only modestly.
Similarly, under current law, defense spending would grow only slightly in real dollars over the next decade. Even under Trump’s plan to repeal the defense sequester and increase the size of the armed forces, defense spending would grow far more slowly than the autopilot programs, and its share of GDP would fall. With little real-dollar budget increases while average wages rise, this means ever fewer military personnel.

Conclusion
No government, business, or household can operate well or set a comprehensive agenda when it precommits more than all expected revenue growth and borrows more than its ability to pay. Dealing with this problem will require reducing future spending commitments, further increasing revenue, or some combination of the two.
If the next president tolerates the long-term consequences of significantly rising debt and accepts all commitments ordained from the past, he or she will be left with almost no ability to do anything new, much less respond to an unexpected economic, environmental, or defense challenge. Other policy goals (e.g., universal prekindergarten, leaner government, or lower taxes) will be much harder to realize if there is no room in the budget left for them.
The excesses of the past have put the next president in danger of being a lame duck almost from the start of the next administration. Without significant reforms to the nation’s spending and tax policies, the next president’s agenda will depart little from the path we have increasingly followed over recent decades. This path is dominated by growing health and retirement spending, increasing interest costs, an unsustainably rising national debt, and little room to invest in basic government services or tomorrow’s priorities. Such a path threatens the nation’s future prosperity.
Appendix: Data Sources for this Brief
Revenue estimates in this brief come from Urban-Brookings Tax Policy Center (TPC) estimates published on October 18, 2016, on Clinton’s and Trump’s tax plans. Spending estimates are derived from the Committee for a Responsible Federal Budget’s (CRFB) Promises and Price Tags: An Update, published on September 22, 2016. Estimates of current law are based on the Congressional Budget Office’s August 2016 Update to the Budget and Economic Outlook: 2016 to 2026.
Some CRFB estimates were also used for revenue numbers where TPC did not provide an estimate or where a candidate’s nontax plans had a revenue effect, such as Donald Trump’s plan to repeal the Affordable Care Act or Hillary Clinton’s plan to enact immigration reform. CRFB estimates are drawn from many sources, including the Joint Committee on Taxation, Congressional Budget Office, and Office of Management and Budget estimates of similar proposals.
The policies in these estimates rely on what was known of the candidates’ policies as of the publication date of each product. These estimates do not, for instance, include Donald Trump’s $1 trillion of public-private infrastructure spending, proposed last week but not yet detailed on his website.
These estimates indicate what the candidate has proposed, even if the details have yet to be worked out.
Further, our estimates are based on conventional scoring, which does not account for the economic impact of various tax and spending changes. Some have suggested the economic effects could be large; for example, the Tax Foundation estimates Trump’s tax plan would increase GDP growth over the next decade about 0.7 or 0.8 percent per year. However, these findings are far more generous than what official scorekeepers tend to estimate, and the findings do not account for the negative economic impact of higher debt, fewer immigrants, or less international trade. In our assessment, the macroeconomic impact of either candidate’s plan is likely to be small or negative over 10 years. Though the effects are not included here, the dynamic effects discovered by TPC in collaboration with the Wharton School of the University of Pennsylvania are small in 2026 and would not substantially change the above analysis.


