Analysis of the President’s FY 2017 Budget

The President has released his final budget today, laying out his priorities and proposals for fiscal year 2017 and years to come. The budget includes proposals to reform immigration, taxes, and Medicare, expand education and infrastructure, reduce middle- and working-class taxes, repealing a portion of future sequester cuts, raise new revenue and make other tax and spending changes.
Our main findings from the budget are:
- The President’s budget includes sufficient revenue and spending cuts to pay for his new initiatives and reduce projected deficits. The administration estimates net deficit reduction of $2.9 trillion through 2026, which would be about $2.5 trillion relative to Congressional Budget Office (CBO) scoring conventions.
- The President’s estimates show debt remains relatively stable as a share of gross domestic product (GDP), settling between 75 and 76 percent of GDP after 2021. In dollar terms, debt would rise from $13.7 trillion today to $21.3 trillion by 2026.
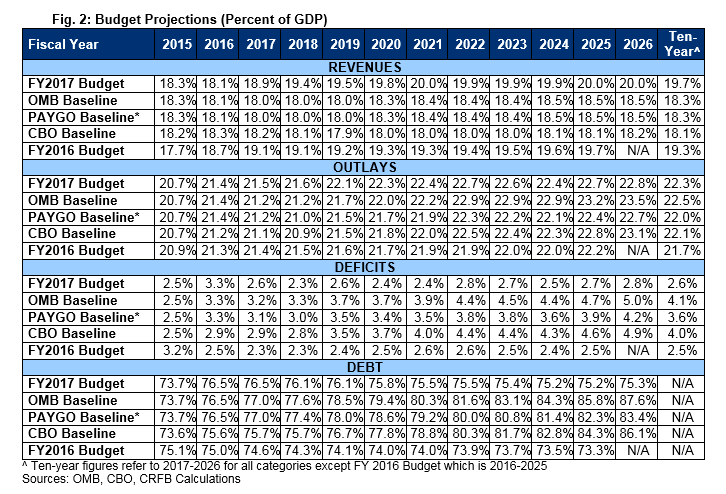
- Deficits under the President’s budget would grow in dollar terms from $438 billion in 2015 to $793 billion in 2026. As a share of GDP, deficits will grow modestly – from 2.5 percent of GDP in 2015 to 2.8 percent by 2026.
- Between 2015 and 2026, spending will grow from 20.7 percent of GDP to 22.8 percent and revenue from 18.3 percent of GDP to 20.0 percent. Historically, they have averaged 20.2 and 17.4 percent, respectively.
- Interest costs alone will triple in dollar terms, doubling relative to GDP from $223 billion (1.3 percent of GDP) in 2016 to $787 billion (2.8 percent of GDP) in 2026. As a share of the budget, interest would double from 6 percent to 13 percent.
The President’s budget should be commended for not only responsibly paying for new initiatives, but identifying significant deficit reduction to stabilize the debt. Preventing the debt from growing faster than the economy is an important first step to achieving sustainable fiscal policy.
Unfortunately, the President’s budget does not go far enough in terms of actually reducing the debt from its current record-high levels, nor does if sufficiently address the long-term growth of entitlement spending, particularly Social Security.
As the economy continues to normalize, high debt levels are likely to slow the growth of wages, increase cost-of-living, and leave the government less prepared to react to future needs or crises. Failure to address Social Security, in particular, will leave the program unable to pay full benefits as soon as 2029, when today’s newest retirees are reaching age 75 and today’s 54 year-olds are retiring at 67.
Spending, Revenue, Deficits, and Debt in the President’s Budget
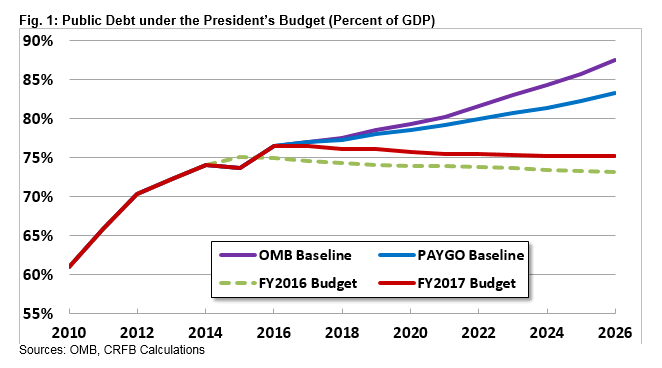
Based on its own estimates, the President’s budget would roughly stabilize the debt as a share of GDP while allowing it to grow in nominal dollars. Specifically, debt would grow from less than $13.7 trillion today to $21.3 trillion by 2026 under the President’s budget. As a share of GDP, debt would grow from 73.7 percent of GDP last year to 76.5 percent of GDP this year, and stabilize between 75 and 76 percent of GDP between 2021 and 2026.
At 75.3 percent of GDP in 2026, debt is significantly below Office of Management and Budget’s (OMB) baseline of 87.6 percent of GDP and our “PAYGO baseline” of 83.4 percent.1 Still, debt remains near post-World War II record highs, nearly twice the historical average.
Under the President’s budget, annual deficits decline for the next couple of years before growing modestly in the future. Deficits fall from $616 billion in 2016 to $454 billion in 2018, before rising to $793 billion in 2026. As a share of GDP, deficits fall from 3.3 percent in 2016 to 2.4 percent by 2021, but then rise to 2.8 percent by 2026. By comparison, OMB’s baseline projects deficits of 5.0 percent of GDP by 2026, and our PAYGO baseline projections deficits of 4.2 percent.
Both spending and revenue rise under the President’s budget in order to maintain deficits below 3 percent of GDP. Spending would grow from 21.4 percent of GDP in 2016 to 22.8 percent by 2026 while revenue would grow from 18.1 percent of GDP in 2016 to 20.0 percent by 2026.
Spending growth is due in part to new spending initiatives, but more significantly to rising interest rates and growing entitlement costs baked into current law. As the population ages and health costs grow, Social Security, Medicare, and Medicaid together under the President’s budget grows by 1.3 percent of GDP over the next decade, while interest spending grows by 1.5 percent of GDP. The remainder of the budget shrinks by a combined 1.4 percent of GDP.
On the other hand, while built in “real bracket creep” explains part of the rise in revenue, growing revenue is largely the result of the significant tax increases proposed in the President’s budget.
At 20.0 and 22.8 percent of GDP in 2026, respectively, revenue and spending would both grow to well above their 50-year historical averages of 17.4 and 20.2 percent of GDP. Revenue would be higher than if the administration’s proposals were not enacted and spending about the same; under current law with the President’s war drawdown, revenue and spending would be 18.5 and 22.8 percent of GDP, respectively. A portion of this difference – 0.3 and 0.2 percentage points of GDP, respectively – is due to the higher revenue and spending from immigration reform.
Proposals in the President’s Budget
The President’s budget includes a large number of tax and spending proposals reflecting the Administration’s many priorities. Among these changes include over $3.1 trillion of tax increases, $170 billion from immigration reform, and more than $460 billion of health and other mandatory savings in order to pay for nearly $1.6 trillion of new initiatives.
Relative to our “PAYGO baseline,”^ which reflects current law with a war drawdown, net deficit reduction totals $2.5 trillion with interest. As the Administration estimates it, that number climbs to $2.9 trillion, or $3.6 trillion including the war drawdown. Below we describe some of the major policies proposed in the budget.
New Spending Initiatives – The President’s budget includes several major new initiatives that increase spending by about $1.2 trillion over the next decade. Most significantly, the budget reverses a large portion of the “sequestration” cuts which are in effect on the mandatory side and scheduled to return in FY 2018 on the discretionary side. Through 2026, this would cost $201 billion on the mandatory side and relative to CBO’s budget conventions would cost $325 billion on the discretionary side (which is $440 billion less than a full repeal of the sequester caps).2
The budget further proposes a major $312 billion increase in infrastructure spending, focusing on transportation and clean energy infrastructure. In addition, the budget proposes more than $150 billion to fund universal pre-K and expand access to child care, over $60 billion to expand access to community colleges and fund minority-serving institutions, another $60 billion to reform unemployment insurance, and nearly $30 billion to help meet climate change goals agreed to in the Paris Climate Change Conference. Many of these initiatives are paid for with specific offsets – for example the infrastructure spending with an oil tax and a deemed repatriation tax and the universal pre-K with a cigarette tax increase.
New Tax Breaks – The President’s budget proposes to expand several existing tax breaks while creating a few new ones as well. Perhaps most significantly, the budget expands the Earned Income Tax Credit (EITC) for childless workers and create a $500 “second earner” tax credit, costing $150 billion combined. The budget would consolidate and expand tax breaks for college students and double the maximum child care tax credit. On the business side, the President’s budget would increase the amount of investments that small businesses can immediately expense, simplify and increase the research credit, and expand clean energy tax breaks.

Revenue Increases – To pay for new initiatives and reduce the deficit, the President’s budget includes nearly $3.2 trillion in tax increases. New to this budget is a $10.25 per barrel oil tax that raises almost $320 billion for infrastructure projects and a proposal to apply the 3.8 percent Medicare investment surtax to pass-through businesses, which when combined with other closing related loopholes would raise more than $270 billion. The budget also raises over $900 billion from higher earners by limiting tax expenditures to the 28 percent bracket, enacting a 30 percent minimum tax(“Buffett rule”), increasing the top capital gains and dividends rates by 4.2 percent, and taxing capital gains at death. The budget would generate more than $225 billion by increasing the estate tax in a variety of ways, $110 billion from a fee on financial institutions, $115 billion from higher tobacco taxes, and a number of other tax increases and loophole closers.
On the business side, the budget raises $300 billion from a one-time 14 percent “deemed repatriation” tax and proposes to raise $550 billion more to retroactively pay for the business portion of last year’s tax extender bill. This includes more than $480 billion from international tax reform – largely generated from a 19 percent minimum tax – and over $225 billion from closing domestic corporate tax breaks. Of that revenue, about $160 billion would be used for new (or expanded) tax breaks. The Administration continues to support using additional business revenue to finance reducing the corporate tax rate.
Health Care Reforms – Overall, the budget would reduce projected health spending by about $375 billion, with even larger savings in Medicare and a modest expansion of Medicaid. Nearly $175 billion of this savings comes from reducing prescription drug costs, mainly by requiring drug companies to effectively offer Medicare Part D’s discounted prices through “drug rebates.” The budget saves nearly $100 billion from reducing payments to post-acute care facilities, building on small reductions enacting in last year’s “doc fix” legislation. The budget also builds on that legislation by further expanding Medicare’s income-related premiums and reforming its cost-sharing (saving over $50 billion on a combined basis). And finally, the budget saves over $75 billion from Medicare Advantage by setting rates through competitive bidding. These and other savings are primarily used to reduce health care cost growth, but also to increase Medicaid spending – most significantly by removing the cap on Medicaid funding to expand eligibility and increase federal support to Puerto Rico and other territories. Additional savings are used to allow states that have not yet expanded Medicaid under the Affordable Care Act to take advantage of the 3-year 100-percent matching rate that was available to states that expanded earlier.
Other Mandatory Savings – Outside of the above proposals, the budget finds savings in other mandatory programs by reducing subsidies in the crop insurance program, allowing the Pension Benefit Guaranty Corporation to raise multiemployer premiums, and improving program integrity. The President’s budget would also enact various reforms to the Postal Service that would improve operations and increase revenue, such as increasing the authority for the Post Office to increase the price of stamps and reducing delivery from 6 to 5 days per week, to save the Postal Service from financial default. Finally, the budget includes a small amount of Social Security savings – largely from reducing fraud and overpayments. Sadly, these changes will do little to improve the solvency of Social Security, which is currently projected to exhaust its trust funds as soon as 2029, according to CBO.
Immigration Reform – The President’s budget calls for comprehensive immigration reform, supporting the approach in the 2013 Senate-passed bill. That reform would increase the size of the population and labor force, both increasing spending on those individuals as well as revenue collected from them. As a result, OMB assumes revenue would rise by $420 billion over the next decade and spending by $250 billion, resulting in $170 billion of total savings.
War Spending –The President’s budget requests $73.7 billion for overseas contingency operations (OCO) for FY 2017, the same amount as for last year and the amount specified in the Bipartisan Budget Act of 2015. Beyond 2017, the budget assumes a placeholder of $11 billion of war spending per year through 2021, acknowledging that the placeholder does not reflect decisions about future year’s funding. Although this placeholder is consistent with the Administration’s long-standing policy to limit total OCO spending between 2013 and 2021 to $450 billion, it is likely unrealistically low and therefore unlikely to materialize. Technically, these numbers would generate about $640 billion of savings over ten years relative to OMB’s baseline. However, this number is a combination of policy changes that are already in effect (the war drawdown) and policy changes that are unlikely to occur (the steep drop in spending starting in FY 2018) – and as a result should not be considered deficit reduction when generating savings estimates.
Economic Assumptions
Ultimately, fiscal and economic choices are intertwined. Manageable debt levels and smart tax and spending policies can promote economic growth, while strong economic growth can improve the budget picture. In the President’s budget, unlike estimates made by CBO, the presumed economic impact of the President’s policies are baked into OMB’s economic assumptions.
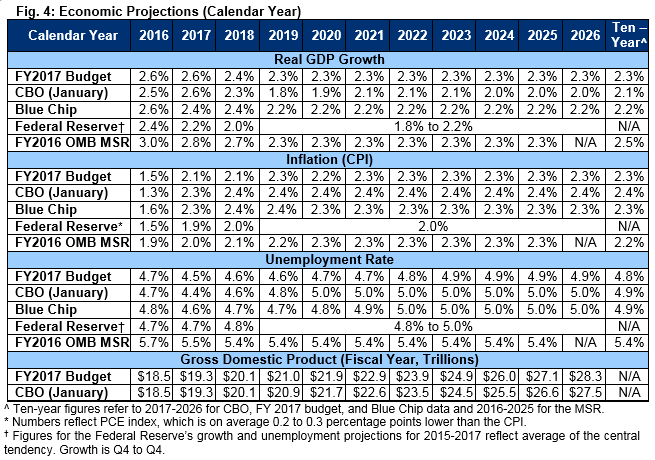
At least in part as a result, OMB projects a somewhat more optimistic economic picture over the next decade than CBO. For example, OMB projects average real growth to total 2.3 percent per year, compared to CBO’s estimate of 2.1 percent. That gap is even more significant late in the budget window, when OMB projects annual growth of 2.3 percent and CBO only 2.0 percent. As a result of these differing growth projections – as well as differences in inflation -- OMB projects nominal GDP to be 2.3 percent higher than CBO.
This difference is due to a number of factors, including that OMB projects more robust growth over the next few years than CBO (likely due to the President’s proposed policies), assumes the economy reaches potential (CBO assumes it remains modestly below potential to account for the likelihood of a recession), and assumes faster growth in potential GDP – due largely if not entirely to its immigration reform policy.
As a result of this growth, OMB projects the unemployment rate to dip further from 4.9 percent today to 4.5 percent by 2017 and then stabilize at about 4.9 percent. By comparison, CBO projects the unemployment rate will settle around 5.0 percent.
Conclusion
By reducing Medicare cost growth, reforming the immigration system, and enacting a large number of tax increases, the President’s budget would not only pay for his new initiatives, but reduce projected deficits in order to stabilize the debt as a share of the economy.
It is encouraging that the budget would stem the growth of the debt, yet disappointing it does not go further. At 75 percent of GDP, debt would remain at record-high levels not seen other than during and just after World War II, and more than twice as high as in 2007. Such high levels of debt will tend to slow economic growth and perhaps more importantly would leave the federal government under prepared to face the next recession, war, or other national emergency.
The budget takes important steps to control Medicare cost growth, but does not go far enough on this front and fails to address the looming insolvency of the Social Security program altogether.
Though the President deserves much praise for paying for all of his new initiatives – and we strongly urge Congress to follow his lead – his budget simply doesn’t do enough to put our record-high debt levels – or our entitlement programs – on a sustainable long-term path.
We hope that Congress and the President will work together over the next year, combining the best parts of this budget with other reforms to restore the country’s fiscal and economic health.
See a printer-friendly version (8 pp.)
1 CRFB’s “PAYGO Baseline” adjusts OMB’s baseline to remove claimed savings from a drawdown of OCO and to treat the so-called “sequester” under CBO’s conventions by assuming discretionary levels continue at sequester-levels, adjusted for inflation, beyond 2021.
^ PAYGO baseline assumes continuation of current law, including inflation adjustments of the 2021 post-sequester discretionary levels, along with a drawdown in war spending as in the President’s budget.
2 The Administration estimates discretionary sequester relief will save $77 billion over ten years, rather than costing $325 billion; their “baseline” projections assume that after budget caps and sequestration disappear in 2022, spending jumps roughly $100 billion to pre-sequester levels. By contrast CBO assumes that spending continues to grow with inflation from post-sequester levels based on a long-stranding convention of discretionary spending projections.


