The 75-Year Budget Outlook
The federal budget is on an unsustainable long-term trajectory. With federal debt already high and rising, the country’s fiscal outlook in the medium and long terms are both extremely troubling. This paper shows that the country’s very long-term outlook is frightening and almost certainly unsustainable.
Within a decade or so, official estimators project debt will exceed the size of the economy for only the second time in history. In 75 years, we project federal debt will exceed 3.5 times the size of the economy under current law and 6 times the size of the economy assuming policymakers continue current policies.
The Congressional Budget Office (CBO) discontinued 75-year projections in 2016 in favor of 30-year projections, which are less uncertain and still show an outlook that is quite troubling. However, the Committee for a Responsible Federal Budget’s long-term model – which was built based on CBO’s projections – can still extrapolate the full 75 years. Though 75-year projections are highly uncertain, they show the longer-term direction the nation’s finances are headed. Our model shows that:
- Under current law, debt will double from 78 percent of GDP today to 160 percent by 2050 and reach 360 percent of GDP by 2093.
- Under CBO’s Alternative Fiscal Scenario – which assumes the continuation of current policies – debt would reach 225 percent of the economy by 2050 and over 600 percent of GDP by 2093.
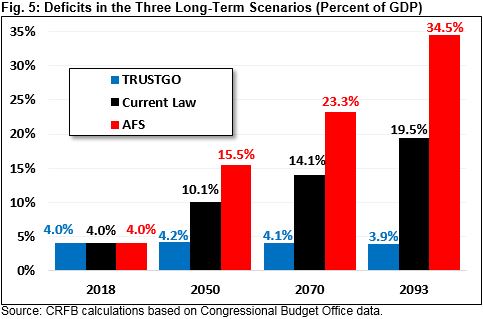
- Budget deficits under these scenarios would rise from about 4 percent of GDP this year to between 20 and 35 percent of GDP by 2093.
- Securing the solvency of various trust funds would go a long way toward fixing the debt. Under our TRUSTGO Scenario – which assumes revenue and/or benefit changes sufficient to achieve solvency in Social Security, Medicare Hospital Insurance, and the Highway Trust Fund – debt would stabilize at about 100 percent of GDP.
Our projections show debt is on an unsustainable long-term path. While today’s high levels of debt already threaten to slow economic growth, there is literally no precedent for deficits and debt at the levels projected over the next 75 years. If policymakers don’t act to avoid such high levels of debt, a financial or inflation crisis would likely force action and severely damage the global economy in the process.
The 75-Year Current Law Outlook is Unsustainable
Under current law, CBO projects debt will roughly double as a share of GDP over the next 30 years. Our model extends CBO’s projections (see Appendix II for methodology) and finds debt will double again by 2083 and continue to grow rapidly thereafter.
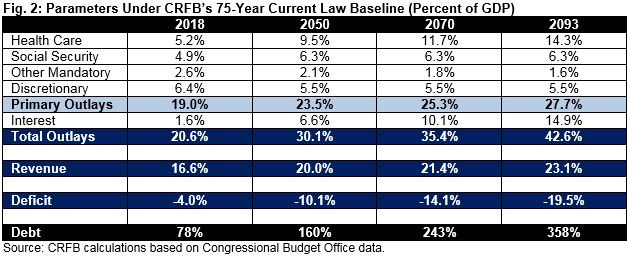
Specifically, we find that under current law debt will rise from 78 percent of GDP in 2018 to 160 percent by 2050 and over 240 percent by 2070. Debt would total 360 percent of the economy in 75 years.

Annual borrowing under this scenario would reach astronomical levels. In 2018, federal budget deficits totaled about 4 percent of GDP. We project current law deficits will rise to 10 percent of GDP by 2050, 14 percent by 2070, and 20 percent by 2093.
These rising deficits are driven by the rapid and continuous growth of health and retirement programs, the failure of tax revenue to keep pace, and rising interest payments that will result from continued borrowing.
According to CBO, Social Security costs will rise from 4.9 percent of GDP in 2018 to 6.3 percent by 2093. We project that federal health care spending will grow from 5.2 percent of GDP to 14.3 percent over the same timeframe. In addition, due to continued excessive borrowing, interest on the debt will explode, rising from 1.6 percent of GDP in 2018 to 14.9 percent by 2093.
As a result of this growth, total spending under current law would grow from 20.6 percent of GDP today to 30 percent by 2050, 35 percent by 2070, and over 42 percent by 2093. In other words, total spending will double as a share of the economy over the next 75 years.
Revenue will also rise – both due to the scheduled expiration of various tax cuts and continued revenue growth due to “real bracket creep” and other factors – but not enough to keep pace with spending. We project revenue will increase from 16.6 percent of GDP in 2018 to a near-record level of 20 percent of GDP by 2050 and 23.1 percent by 2093. According to CBO, almost all of revenue growth over the next 30 years comes from the income tax, and we expect this to be true over the longer term as well.
The massive increase in spending, deficits, and debt under current law is clearly unsustainable. If anything, our model likely understates the severity of rising debt since it does not incorporate economic feedback from rising debt beyond 2048. A sizable course correction is needed to put the budget on a sustainable path.
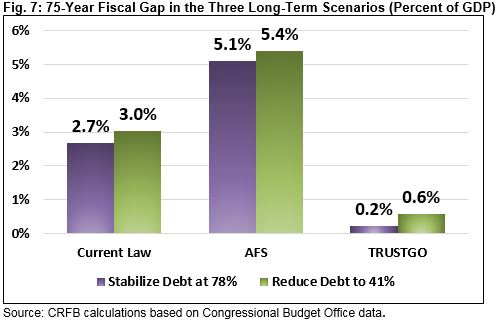
Stabilizing the debt at current levels over the next 75 years would require closing a fiscal gap of about 2.7 percent of GDP. Reducing debt to the historic average of 41 percent of GDP over 75 years would require closing a 3 percent of GDP gap. In other words, fixing the debt would require the equivalent of $6.8 trillion to $7.6 trillion of spending cuts and/or tax increases over the next decade, the equivalent of cutting primary spending by 14 to 15 percent or increasing revenue by 15 to 17 percent.
The 75-Year Current Policy Outlook is Frightening
While the current law fiscal outlook is unsustainable, it is in many ways an optimistic view of fiscal policy. Current law assumes that the recent $150 billion per year spending hike expires and sequester-level discretionary spending levels return starting next fiscal year. It also assumes that many of the tax cuts enacted at the end of last year expire by 2026 and that a variety of other tax provisions expire in the coming years.
CBO’s Alternative Fiscal Scenario (AFS) instead assumes recent discretionary spending increases continue, most expiring provisions in the 2017 tax law are extended, various taxes from the Affordable Care Act continue to be delayed, other expiring tax provisions are extended, and emergency spending is reduced from this year’s elevated levels. CBO estimates that these adjustments – which would cost $2.6 trillion over ten years in total – would lead debt to exceed its all-time record in just over a decade.
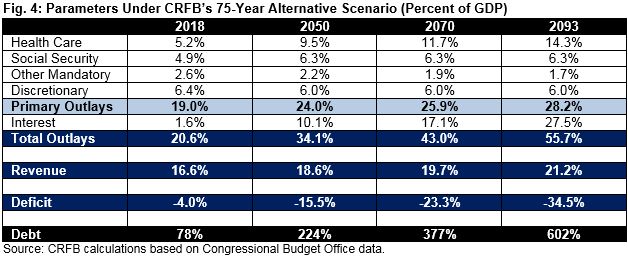
We estimate that under the AFS, debt would rise from 78 percent of GDP in 2018 to almost 225 percent by 2050, nearly 380 percent by 2070, and over 600 percent in 75 years.
Deficits under this scenario would rise from 4 percent of GDP in 2018 to 7.1 percent in 2028, 16 percent in 2050, 23 percent in 2070, and 34.5 percent by 2093. The 2093 deficit would be the largest in history, even surpassing the huge deficits run to finance World War II.

Revenue under the AFS would still rise as a share of the economy but more slowly than under current law. Specifically, we project it would grow from 16.6 percent of GDP in 2018 to 18.6 percent by 2050, 19.7 percent by 2070, and 21.2 percent by 2093 (compared to 23.1 percent in 2093 under current law).
Spending, meanwhile, would grow much more rapidly. Whereas CBO’s current law scenario projects discretionary spending will fall from 6.4 percent of GDP this year to 5.5 percent by 2028 and thereafter, under the AFS, it would only fall to 6 percent of GDP. As a result, primary spending would be half a percent of GDP higher over the long term than under current law.
Much more troubling is the growth in interest payments, driven by higher levels of debt. Under the AFS, we project interest would grow from 1.6 percent of GDP today to an astronomical 27.5 percent in 2093 (compared to 15 percent under current law). By that year, the government would spend almost as much on interest as it spends on the rest of the federal budget.
In total, under the AFS, we project spending would explode from less than 21 percent of GDP in 2018 to 34 percent by 2050, 43 percent by 2070, and almost 56 percent by 2093.
Note that even this scenario assumes that revenue would grow over time to eventually reach a record high as a share of GDP, and other mandatory spending would fall to its lowest level since at least 1965. If instead both categories remained constant as a percent of GDP after 30 years, debt would approach 700 percent of GDP by 2093.
The changes needed to stabilize or reduce the debt would be much larger if lawmakers continued current policy. Stabilizing the debt at current levels over the next 75 years would require deficit reduction of about 5.1 percent of GDP, while reducing debt to the historic average of 41 percent over 75 years would require closing a 5.4 percent of GDP gap. This would be the equivalent of $12.8 trillion to $13.7 trillion of spending cuts and/or tax increases over the next decade, or the equivalent of cutting primary spending by 26 to 28 percent or increasing revenue by 29 to 31 percent.
Securing Trust Funds Could Help to Fix the Debt
Avoiding economically disastrous growth in the national debt will require an aggressive combination of reduced spending and increased revenue over the long term. Significant progress can be made by offsetting all new spending or tax cuts (including extensions of current policy) and by assuring solvency of all major trust funds.
Under current law, CBO projects the Highway Trust Fund will be depleted by 2021, the Social Security Disability Insurance Trust Fund will run dry by 2025, the Medicare Hospital Insurance Trust Fund will be exhausted by 2026, and the Social Security Old-Age and Survivors Insurance Trust Fund will be insolvent by 2032. Absent a plan to assure solvency of these trust funds, CBO’s (and our) projections assume spending continues as if no trust fund constraint existed.
Our TRUSTGO scenario assumes that spending and revenue are brought in line for these four major trust funds after the projected insolvency dates. This reflects an interpretation of current law, since programs are not legally able to spend beyond trust fund reserves without new legislation. However, this scenario also shows how lawmakers could improve debt projections by making trust funds solvent through a thoughtful mix of targeted benefit and revenue changes.
Under the TRUSTGO scenario, deficits would average about 4 percent of GDP throughout the 75-year period, including in 2093. This is in stark contrast to current law, where deficits would reach 19.5 percent of GDP, and the AFS, where they would reach 34.5 percent of GDP.
These deficits would allow debt to stabilize, albeit at near-record high levels. Specifically, we project debt would rise from 78 percent of GDP in 2018 to 94 percent by 2028, but then it would rise only slightly further to 98 percent of GDP by 2050 and 102 percent of GDP in 2070 and 2093.
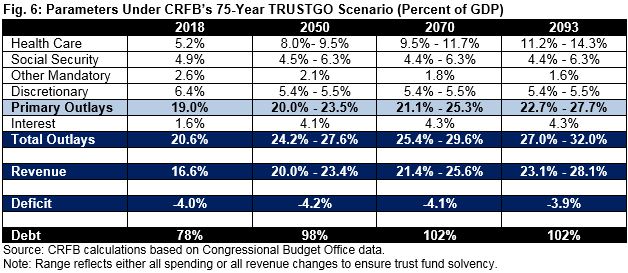
If the trust fund adjustments were made solely on the spending side, total spending would grow far more slowly than under current law. Social Security’s costs would fall from 4.9 percent of GDP in 2018 to 4.4 percent in 2093 (compared to rising to 6.3 percent under current law and the AFS). Discretionary spending would fall from 6.4 percent of GDP in 2018 to 5.4 percent by 2093 (compared to 5.5 percent under current law and 6 percent under the AFS).
Health and interest costs would rise, but not as rapidly as under other scenarios. Health spending would grow from 5.2 percent of GDP in 2018 to 11.2 percent by 2093, compared to 14.3 percent under current law and the AFS. Interest spending would grow from 1.6 percent of GDP in 2018 to 4.3 percent in 2093, well below the 14.9 percent under current law and 27.5 percent in the AFS.
Total spending in this case would grow steadily from 20.6 percent of GDP in 2018 to 27 percent by 2093, with about three-fifths of spending growth coming from primary spending and the rest coming from interest. Total spending in 2093 under the TRUSTGO scenario would be well below the 43 percent and 56 percent of GDP projected under current law and in the AFS, respectively.
If an all-revenue solution were used to make the trust funds solvent, non-interest spending would grow as projected under current law, while revenue would rise from 16.6 percent of GDP in 2018 to 28.1 percent by 2093, compared to 23.1 percent in current law and 21.1 percent in the AFS. Total spending would grow from 20.6 percent of GDP in 2018 to 32 percent by 2093, still well below the 42.6 percent of GDP projected under current law and 55.7 percent in the AFS.
Making these trust funds solvent would close 2.5 percent of GDP of the fiscal gap over the next 75 years. The result would be a remaining gap of 0.2 percent of GDP, the equivalent of about $560 billion over ten years. Reducing debt to 41 percent of GDP in 75 years would require 0.6 percent of GDP of deficit reduction, or about $1.4 trillion over ten years, in addition to the changes already made to Social Security, Medicare Part A, highway spending, payroll taxes, the gas tax, or any other dedicated revenue sources.
Conclusion
The United States will not be able to sustain its current fiscal course over the next 75 years. While CBO’s 30-year budget outlook already shows a bleak picture of rapidly rising deficits and debt, both would grow to unbelievable levels over the very long term.
Under current law, we project deficits will reach 20 percent of GDP by 2093 and debt would total 360 percent of GDP. If allowed to occur, such high levels of debt would mean a substantial reduction in economic growth, a large increase in interest rates, and an explosion of federal interest costs. In reality, there is virtually no historic or international precedent for such high levels of debt. If policymakers refused to act to prevent this debt accumulation, a fiscal crisis could force corrective action.
Even this scenario is in many ways optimistic. The Alternative Fiscal Scenario, showing the continuation of expiring tax cuts and spending increases, has an even bleaker outlook. In this case, we estimate deficits would reach 35 percent of GDP by 2093, and the national debt would total 600 percent of GDP. Such a debt load is in many ways unimaginable.
The dramatic deterioration of the fiscal outlook associated with the Alternative Fiscal Scenario makes a strong case against unpaid-for policy extensions. Recent tax cuts should be allowed to expire (in part or in full) and/or offset with new base broadening and loophole closures. Recent spending increases should be scaled back if they are continued and fully offset with spending cuts or revenue elsewhere.
To put the debt on a more sustainable path, policymakers could restore solvency to the major trust funds. If the Social Security, Medicare Hospital Insurance, and the Highway Trust Funds were all made solvent, debt would stabilize at about the size of the economy. Modest additional deficit reduction could hold future debt to current levels or below and generate additional economic improvement.
To be sure, offsetting policy extensions and making trust funds solvent will require significant reductions in spending and/or increases in revenue. These kinds of tough choices, though, are absolutely necessary to keep debt from rising to dangerous new heights.
Appendix I: Fiscal Gap Analysis
One measure of the growth of debt over the long term is the fiscal gap, or the amount of sustained non-interest deficit reduction necessary to keep debt stable as a percent of GDP. CBO estimates that the 30-year fiscal gap is 1.9 percent of GDP, the equivalent of $4.8 trillion over ten years. If the target were instead the 50-year historic average for debt (41 percent of GDP), the gap would be 3 percent of GDP, or $7.6 trillion.
We estimate that the 75-year fiscal gap for current law is 2.7 percent of GDP, or $6.8 trillion over ten years. Reducing debt to its historical average would require deficit reduction of 3 percent of GDP, or $7.6 trillion over ten years.
The other scenarios show much different fiscal gaps. The Alternative Fiscal Scenario, not surprisingly, has a much larger fiscal gap of 5.1 percent of GDP, or $12.8 trillion over ten years. Reducing debt to the historic average would require deficit reduction of 5.4 percent of GDP, or $13.7 trillion. Since the AFS already builds in some deficit-increasing policies, some of this deficit reduction could simply involve not extending expiring tax cuts or spending increases (or offsetting them).
The TRUSTGO scenario, by contrast, shows that much less deficit reduction is needed to hit each target. Stabilizing the debt over 75 years would require deficit reduction of 0.2 percent of GDP, or about $560 billion over ten years, while reducing debt to its historic average would require 0.6 percent of deficit reduction, or about $1.4 trillion. This deficit reduction would come on top of the already large changes that lawmakers would have to undertake to eliminate the trust fund shortfalls.
Appendix II: Methodology for Creating 75-Year Outlooks
In constructing the 75-year outlook, our model first incorporates the detailed ten-year budget projections in CBO’s April 2018 Budget and Economic Outlook and additional data from CBO’s 2018 Long-Term Budget Outlook (LTBO) for the major categories of spending and revenue for the following 20 years. Our model allows various parameters to be adjusted and generates net interest, deficit, and debt numbers based on these adjustments.
Beyond 2048, our model extrapolates CBO’s projections in the following ways to generate a current law baseline:
- Revenue: Our model assumes steady growth of revenue based on the growth trajectory between 2028 and 2048.
- Health Care: Our model assumes total federal health spending grows at the rates projected in CBO’s 2015 Long-Term Budget Outlook, the most recent 75-year outlook CBO produced.
- Social Security: Our models relies on CBO’s most recent 75-year projections for Social Security, converting calendar year (CY) numbers into fiscal year (FY) totals and extrapolating one additional year.
- Discretionary: Our model assumes discretionary spending remains fixed as a share of GDP.
- Other Mandatory: Our model extends CBO’s assumptions of slight and sustained reductions in the size of non-health, non-Social Security mandatory spending relative to GDP.
- Interest: Our model assumes interest rates remain constant after 2048, resulting in growing net interest costs as the size of the overall debt grows.
- GDP, Inflation, and Other Economic Variables: Beyond 2048, our model relies on economic assumptions from CBO’s 75-year Social Security projections but converts from calendar year to fiscal year, where possible. In other cases, our model assumes relatively steady changes based on projections from the 2040s.
Importantly, our estimates do not incorporate additional economic feedback resulting from changes in debt beyond 2048. Doing so would likely substantially worsen the long-term outlook, particularly in the Alternative Fiscal Scenario.
Working within our model, we incorporate several adjustments for our Alternative Fiscal Scenario and TRUSTGO Scenario.
For the Alternative Fiscal Scenario, we assume (as CBO does):
- Most parameters remain the same as under current law
- The individual tax cuts from the 2017 tax law that expire after 2025 are extended
- Certain other expiring tax provisions, most of which have been extended numerous times before, are extended permanently
- Health care taxes in the Affordable Care Act that have already been delayed twice are repealed permanently
- Recent discretionary spending hikes are extended so that discretionary spending increases with inflation after 2019 (and GDP after 2028) rather than dropping substantially when the sequester returns in 2020
- Emergency disaster spending is drawn down to its historic average rather than growing with inflation from a 2018 highpoint (an assumption that reduces deficits)
CBO provides year-by-year projections of the AFS through 2038, as well as single-year projections in 2048. To match those 2048 numbers, we calibrated our model to assume a modest reduction in the growth rate of revenue, consistent with the likely effects of extending current tax policy. Our estimates implicitly incorporates the negative economic feedback effects of debt through 2048, but not beyond. It is likely that debt would be substantially higher as a share of GDP if these effects were incorporated.
Lastly, for our TRUSTGO scenario, we assume:
- Most parameters remain the same as under current law
- Highway Trust Fund revenue and spending are brought into line beginning in 2021, and primarily grow with GDP after 2028
- Social Security Disability Insurance Trust Fund spending and revenue are brought into line in 2025, and the program continues to remain in balance over 75 years based on CBO’s long-term Social Security projections (converted from calendar year to fiscal year)
- Medicare Part A (Hospital Insurance) revenue and spending are brought in line beginning in 2026. Our estimates rely on CBO’s Medicare Part A projections through 2028 and their Hospital Insurance payroll tax estimates through 2093 but assume Part A spending grows at the same rate as total Medicare spending between 2028 and 2048 and at the same rate as total health spending from 2048 through 2093.
- Social Security Old Age and Survivors Insurance Trust Fund spending and revenue are brought into line in 2032, and the program continues to remain in balance over 75 years based on CBO’s long-term Social Security projections (converted from calendar year to fiscal year)
Again, we do not incorporate economic feedback, which in this case should result in higher GDP and thus lower debt as a share of GDP.


