Medicare Trustees Report Delivers Good News But Need for Reform Remains
We have already released our analysis of the 2014 Social Security Trustees' report, which showed that the program's long-term finances are largely similar but slightly worse than projected last year. Now it's time to turn to the Medicare report, which showed some improvement in the finances of the Hospital Insurance (HI) trust fund for Part A (which covers inpatient hospital and post-acute care) and lower Medicare spending on an apples-to-apples basis. However, the improvement in the Medicare outlook does not mean that the program is out of the woods. Even with assumptions that the Trustees question as too optimistic, the report forecasts a significant rise in Medicare spending, and the HI trust fund is projected to be insolvent in 16 years.
Hospital Insurance Trust Fund Solvency
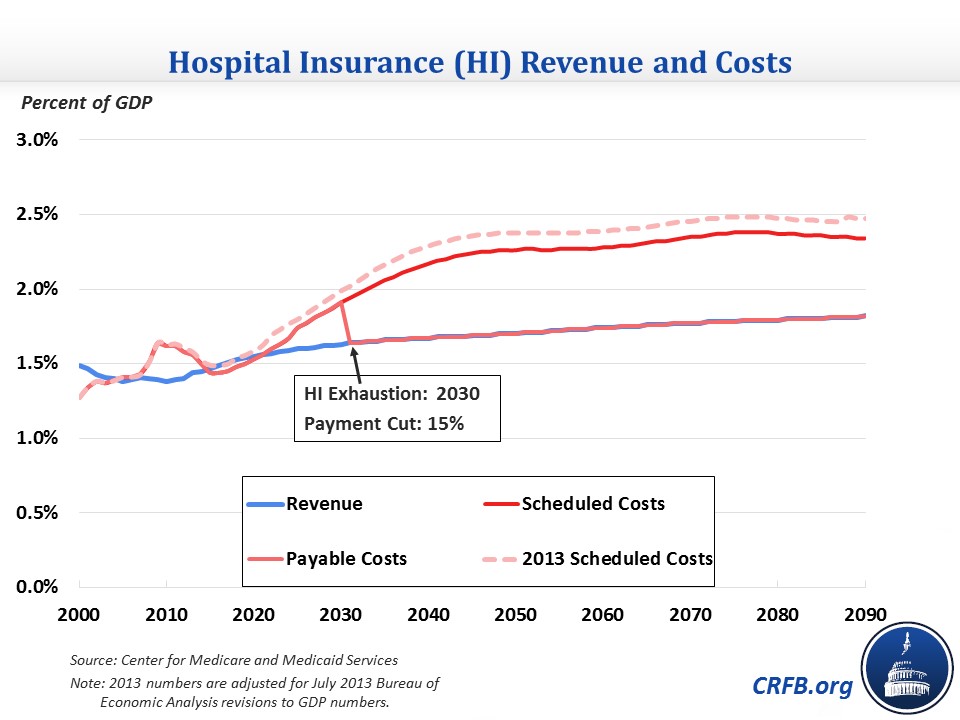
The Trustees now foresee the HI trust fund being exhausted in 2030, four years later than they predicted last year, at which point payments from the trust fund would be cut by about 15 percent. The 75-year actuarial shortfall narrowed by one-quarter of a percentage point, from 1.11 percent of taxable payroll to 0.87 percent. These revisions are similar to those of Congressional Budget Office (CBO) earlier this month.
As a percent of GDP, Part A spending will rise from 1.5 percent this year to 2.1 percent by 2035 and 2.4 percent by 2070. Meanwhile, revenue will rise more slowly from 1.45 percent this year to 1.7 percent by 2035 and 1.8 percent by 2070. The HI fund is projected to run surpluses from 2015-2020, which would be the first time since 2004. However, deficits will quickly return and rise to 0.5 percent of GDP by the late 2030s, stabilizing at that level after.

The drop in the 75-year shortfall for HI is attributed to lower-than-expected 2013 spending and changes in future assumptions. Specifically, the Trustees lowered their assumptions of hospital utilization and are now expecting fewer increases in the case mix for skilled nursing facilities and home health agencies. Economic and other technical assumptions also slightly reduce the shortfall, including higher productivity assumptions (which reduce payment updates), a different methodology for transitioning from short-term to long-term growth assumptions, and a slightly lower CPI. Factors that increased the shortfall are a shift in the 75-year period, which increases the shortfall every year because the relatively high 2088 deficit is included, and an increase in the number of beneficiaries expected to enroll in private health plans (such as Medicare Advantage), which are more costly on average than traditional Medicare. The latter change is based on a recent trend of increased enrollment in Medicare Advantage, despite the Affordable Care Act's reductions to the program's payment rates.
| Change in Medicare HI Long-Term Projections | |
| 75-Year Change (Percent of Payroll) | |
| 2013 Shortfall | -1.11% |
| Shift in 75-Year Window | -0.02% |
| Incorporation of Actual 2013 Data | +0.11% |
| Private Health Plan Assumptions | -0.06% |
| Hospital Assumptions | +0.11% |
| Other Provider Assumptions | +0.07% |
| Economic and Demographic Assumptions | +0.03% |
| 2014 Shortfall | -0.87% |
Source: 2014 Medicare Trustees Report
Note that in contrast to the Social Security report, which showed an increase in its shortfall in each of the last four reports, the HI shortfall has fallen in each of the last two reports by 0.5 percentage points in total.
Total Medicare Spending
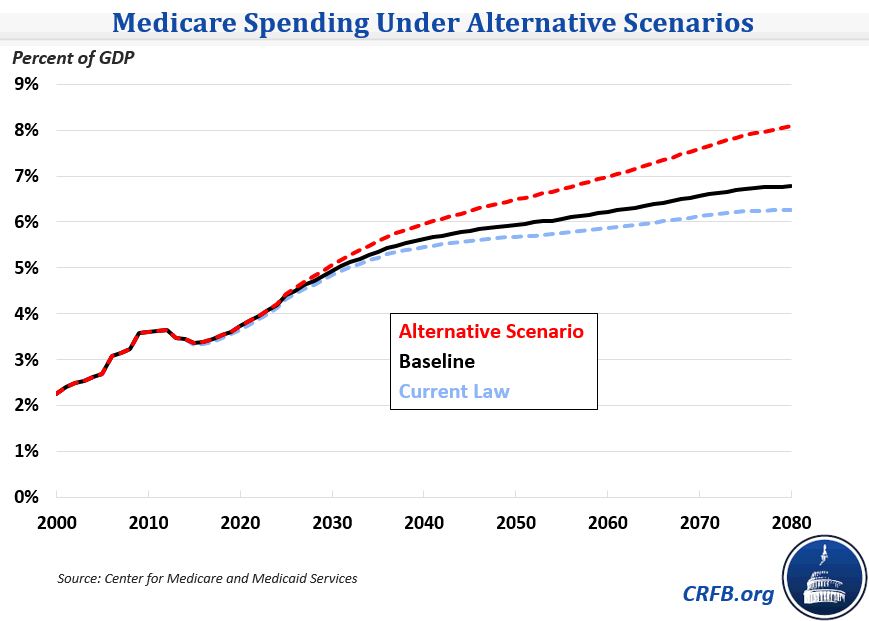
Overall, Medicare spending is expected to climb significantly as a share of GDP, particularly over the next few decades. It will grow from 3.4 percent of GDP this year to 4.4 percent by 2025, 5.4 percent by 2035, and 6.8 percent by 2085. The Trustees have similar projections to CBO through 2040 but have significantly slower growth beyond that.

Since growth rates differ among programs, the proportion of spending among the three parts of Medicare will also change. Part A spending will grow more slowly than Medicare overall, dropping its share of spending from 43 percent this year to 35 percent by 2085. Part B spending, which covers outpatient care, will exceed Part A for the first time starting next year and grow from 43 percent of total payments to 46 percent by 2085. Part D, which covers prescription drugs, will grow from 13 percent to 20 percent of spending despite the recent slowdown in prescription drug cost growth.
As Part B and D spending become a bigger factor in Medicare, the 2.9 percent payroll tax which finances Part A will become a less important financing source. Medicare as a whole will be relying more on the premiums and general revenue that supports Parts B & D.
Total spending is somewhat higher than in last year's report. Much of this increase may be due to the Trustees' new assumption that lawmakers will override the Sustainable Growth Rate (SGR) formula's scheduled 21 percent cut to physician payments in April 2015. In year's past, the Trustees have always assumed that lawmakers would allow the rate cuts to go into effect, even though lawmakers have continually prevented them since 2003. Instead, the Trustees now assume payments will freeze for the remainder of 2015 and increase by 0.6 percent annually through 2023. This is the first time the Trustees have not included the SGR cut in its default scenario; allowing the cut to take place – or including an equivalent amount of savings – would reduce Medicare spending to 6.3 percent of GDP in 2085. On an apples-to-apples basis though, this year's report has Medicare spending lower than last year's report with the SGR repealed: spending was 7.2 percent in 2080 last year, compared to 6.8 percent this year. In part, this is because the Trustees use a 0.1 percentage annual lower payment update as a substitute for the SGR and because of the upward revisions to historical GDP data in July 2013.
Alternative Scenario
While the default scenario deviates from current law by assuming the SGR does not take effect, it still includes provider payment cuts that may not be sustainable over the long term: the reduction in non-physician payment updates to account for multifactor productivity growth (1.1 percent over the long term) and the Independent Payment Advisory Board's (IPAB) mandate to limit Medicare spending growth. The productivity adjustments, for example, will reduce Medicare inpatient hospital payments drastically, from 70 percent of private insurance levels today to 41 percent 75 years from now. The Chief Actuary of Medicare has estimated that this reduction would cause a substantial share of providers to have negative margins by 2040. IPAB's mandate is also of questionable sustainability given the limited range of options it has to work with to meet it.
Because there is a "strong likelihood" that the payment reductions are not attainable, the Trustees publish an alternative scenario which scales back the long-term productivity adjustments from 1.1 percent to 0.4 percent (consistent with recent historical experience for non-physician providers) and assumes IPAB cuts won't take effect. These alternate assumptions would grow HI's 75-year shortfall to 1.9 percent of taxable payroll and accelerate the trust fund exhaustion date by one year while increasing Medicare spending in 2080 from 6.8 percent of GDP in the default scenario to 8.1 percent. However, the alternative scenario has improved significantly since last year, when spending was projected to rise to 9.4 percent of GDP in 2080.

*****
The outlook for Medicare is important to the overall long-term budget picture, so good news is welcome, but we must keep the new report in perspective. Despite the good news, the Trustees still forecast a significant rise in Medicare spending as a share of GDP and the exhaustion of the HI trust fund in 16 years. Further, there is a good chance that the Trustees' baseline could be worse if planned cuts in provider payments turn out to be unsustainable (although paying for SGR fixes with real health savings would improve the outlook). Although Medicare's cost curve has bent slightly, there is still more work to be done to lower health care spending.


