Key Takeaways from the New Health Care Spending Outlook
The Office of the Actuary (OACT) at the Centers for Medicare and Medicaid Services (CMS) has released its latest National Health Expenditure (NHE) projections. Although the latest numbers show that 2013 spending growth was very low at 3.6 percent, CMS continues to predict a pick-up in growth beyond that as the coverage expansions in the Affordable Care Act go into full effect and recent favorable trends at least partially reverse. The overall NHE projections are very similar to the previous ones in September of last year, with 2014-2023 health spending now about $95 billion (0.2 percent) lower than they previously estimated and spending as a share of Gross Domestic Product (GDP) slightly higher in the short term.
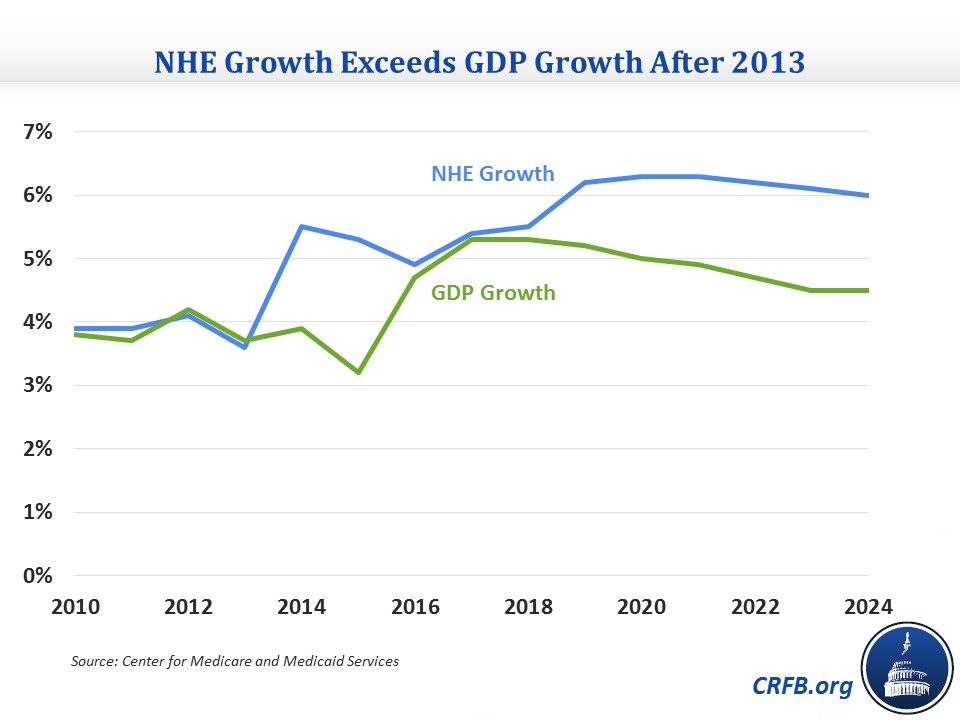
After recording the lowest spending growth in the post-recession period at 3.6 percent in 2013, NHE growth is estimated to have picked up to 5.5 percent in 2014 and is projected to remain around 5 to 6 percent in the years after that through 2024. Health spending will outpace GDP growth in every year over this period, particularly after 2018, although coverage is also expanding in the next few years as a result of the Affordable Care Act (ACA). As a result, NHE as a share of GDP will increase for the first time since 2009 from 17.4 percent in 2013 to 17.7 percent by 2014 and increase thereafter to 19.6 percent by 2024. While NHE growth shows somewhat of a bounceback from the low levels during and following the Great Recession, it would still generally be below the growth rates that prevailed for much of the 1990s and 2000s.
Compared to the previous projections, spending is slightly lower in nominal dollars but slightly higher in the short term as a share of GDP. In short, they both show a pickup in spending growth and a rise in health care spending's share of GDP of about 2 percentage points.

Beyond the overall numbers, there are some interesting trends within the NHE projections that are worth highlighting.
Prescription Drugs
A major story in 2014, which we previously discussed with regards to Medicare, was the bounceback of prescription drug spending growth, fueled in part by expensive new drugs to treat Hepatitis C and to a lesser extent cancer and multiple sclerosis. Patent expirations, one of the key contributing factors to the Medicare slowdown, also contributed to an uptick in cost growth as fewer drugs went off patent. Overall, prescription drug spending growth accelerated significantly from 2.5 percent in 2013 to 12.6 percent in 2014 and is expected to remain above the levels we have seen in recent years. Although growth is expected to come down to 4.5 percent in 2016 and remain in the 6 to 7 percent range after that, these growth rates are still above the ones experienced in 2010-2013, when spending growth stayed below 3 percent each year.
The high growth rate in the short term also means that prescription drug spending will take up a larger share of 2024 health spending than it did in 2013 (10.4 percent versus 9.3 percent). We also saw this trend in the Medicare Trustees' report as Part D takes up a greater share of Medicare spending over time.
ACA Implementation
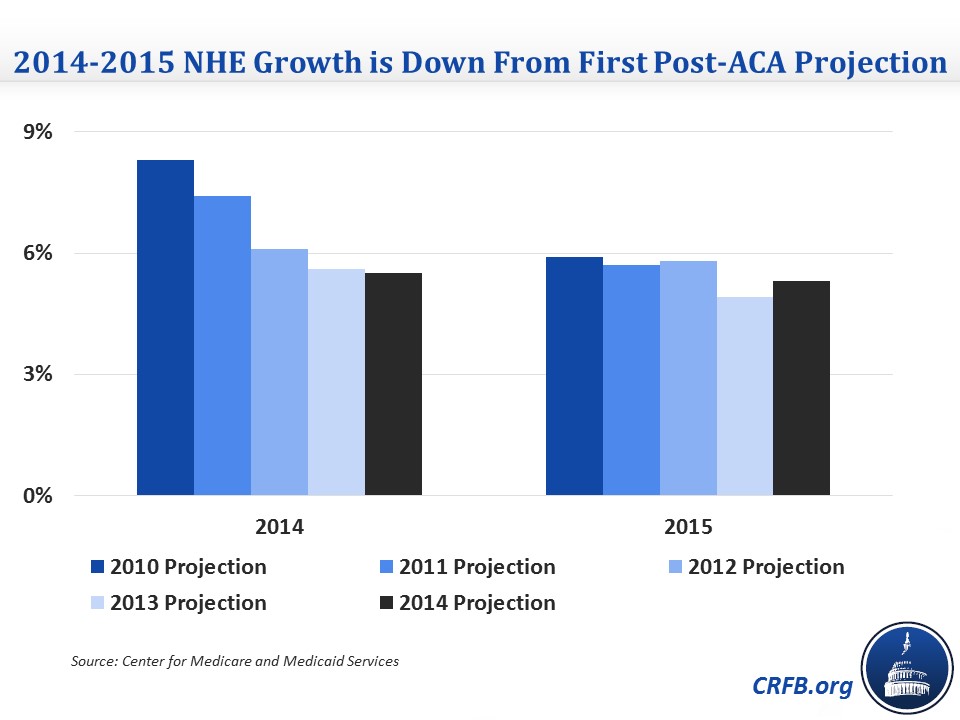
These NHE projections are the fifth that have come out since the Affordable Care Act was enacted. It is interesting to see how their projections for the early implementation years have changed since the initial post-ACA numbers. Expected 2014 growth has dropped significantly since the 2010 projection, from 8.3 percent to 5.5 percent, and is actually lower than the 5.8 percent growth they projected in 2010 would occur in absence of the ACA. Some of this downward revision, though, is due to the coverage expansions not reaching as many people right away as they previously thought and people falling into the Medicaid coverage gap. The 2010 projections forecasted a nearly 7 percentage point jump in the insured rate between 2013 and 2014, while the 2015 projections only see a 3 percentage point jump. Although the insured rate ultimately reaches the same level in both projections, it takes longer to get there in the latest forecast.
The ACA and Private Health Insurance
Looking more narrowly, the NHE data also show the ACA's effect on private health insurance spending and cost as major pieces took effect in 2014. The projections show the growth in the net cost of private health insurance, which includes both employment-based and individual health insurance, having jumped in 2014 to 15.5 percent from 5 percent in 2013 as more people enrolled in private plans and some plans became more generous due to the essential health benefits requirements. Reflecting this growth, private health insurance premium growth accelerated from 2.8 percent in 2013 to 6.1 percent in 2014 (2.1 percent to 5.4 percent per person). However, household premiums actually declined by 0.3 percent, likely driven by the new insurance subsidies. In short, there was a jump in the cost of health insurance and acceleration in premium growth, but the brunt was borne by the federal government and employers.
High-Deductible Plans
One area of health care spending that isn't as prone to the growth acceleration is physician and clinical services. After growing by about 4 percent per year from 2010-2013, it will stick in the 4 to 5 percent range through 2017 before eventually rising to the 6 percent rate more consistent with overall NHE growth. CMS attributes this relatively restrained growth in the near term to the continued prominence of high-deductible insurance plans. It cites data from the Robert Wood Johnson Foundation finding that high-deductible plans "may be significantly offsetting the effects of the coverage expansion in the Marketplaces on growth in the number of physician office visits made by consumers with private health insurance."