How Much Do Donald Trump's Tax Cuts for Millionaires Cost?
Democratic presidential candidate Hillary Clinton recently released a fact sheet on her campaign website that criticizes Republican presidential candidate Donald Trump’s tax plan, saying “His plan would give $3 trillion over 10 years or more than 35% of its tax breaks to millionaires, enough money to ensure Medicare and Social Security’s solvency for the next 75 years, repair our ailing infrastructure, or raise every person now living in poverty up to the poverty line.” We find this statement to be largely true, although the statement about Social Security and Medicare solvency depends on which estimate is used.
The campaign relies upon a calculation from the Center on Budget and Policy Priorities (CBPP), which estimated that $3.2 trillion of Trump’s tax cut would go to millionaires. CBPP’s based its figure on the Tax Policy Center’s (TPC’s) estimate of Trump’s plan, which found the plan would cost $9.5 trillion over ten years with those making over $1 million receiving 31.4 percent of the tax cut in 2017 and 38 percent by 2025. TPC’s distributional analysis counted both direct tax cuts for individuals and the less certain effect of corporate tax cuts, which make up about one-fifth of Trump’s total. TPC also assumed that 80 percent of the corporate income tax burden falls on capital, which is more heavily concentrated among high earners, thus corporate tax cuts would also benefit those making over $1 million.
CBPP adjusted the $9.5 trillion cost down to $9.2 trillion to account for the Congressional Budget Office’s (CBO) latest economic projections and multiplied that by the average share of the tax cut that millionaires will receive in 2017 and 2025 (34.7 percent) to get $3.2 trillion. This total would be 1.4 percent of Gross Domestic Product (GDP) over the next ten years.
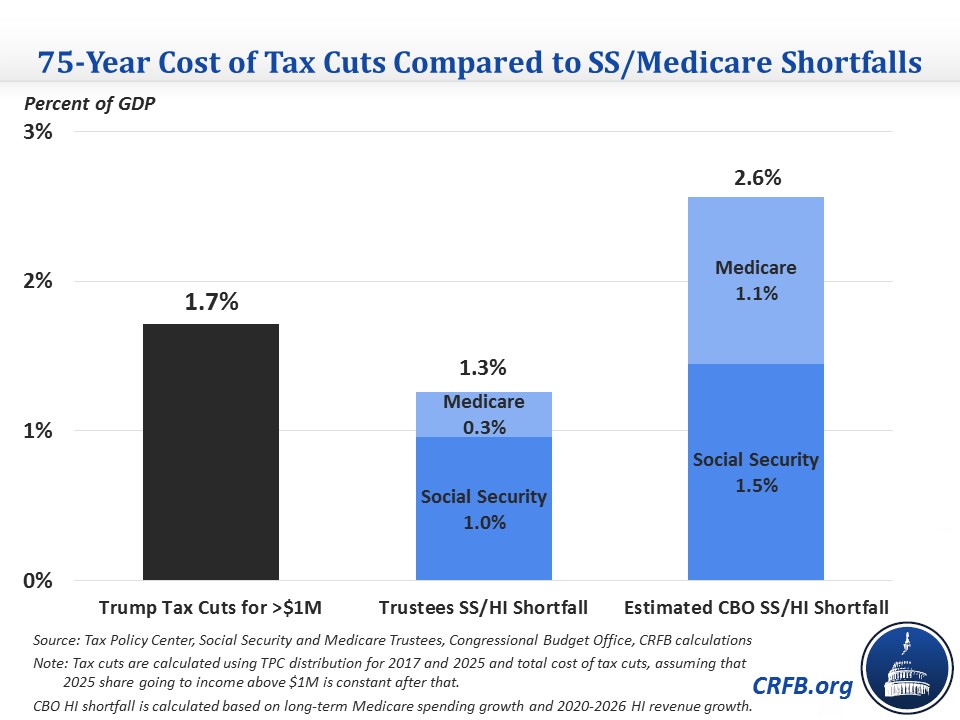
According to the Social Security and Medicare Trustees, the Clinton campaign is correct that 1.4 percent of GDP would cover the amount needed to make Social Security and Medicare solvent over 75 years. The Trustees estimate that over the next 75 years the combined funds would have a 1.26 percent shortfall, with Social Security having a shortfall of 0.96 percent of GDP and Medicare’s Part A Hospital Insurance (HI) trust fund having a 0.3 percent shortfall. The combined shortfall of the two trust funds would be slightly less than the estimated ten-year cost of the tax cuts for people making over $1 million.
These numbers don’t provide enough information about whether Trump’s tax cuts for millionaires would cost at least 1.26 percent of GDP over 75 years since tax estimates do not usually extend that far. TPC estimated the total cost of Trump’s tax plan in the second decade, which is similar to the cost in the first decade at about 4 percent of GDP. TPC’s distributional estimates for 2017 and 2025 show that the share going to millionaires would increase over time, so that by 2025, the cost of those tax cuts would slightly higher at 1.6 percent of GDP. If we assume that the 2025 share of tax cuts going to people making over $1 million (38 percent) continues, the second decade cost of those tax cuts would also be 1.6 percent. If the cost of the tax cuts grew with CBO’s long-term revenue projections after that, they would cost about 1.7 percent of GDP over 75 years (including the indirect effect of the corporate tax cuts).
According to CBO, however, the ten-year cost of Trump’s tax cut for millionaires would not be enough to make Social Security and Medicare solvent. CBO estimated that Social Security’s shortfall alone will be 1.45 percent of GDP over the next 75 years, which is more than the 1.4 percent of GDP that millionaires will receive from Trump’s tax cuts. While CBO does not provide projections for the HI trust fund beyond 2026, the shortfall under CBO’s model is likely greater than the Medicare Trustees’ projection because CBO assumes the HI trust fund will be insolvent four years earlier (2026 compared to 2030) and CBO assumes overall Medicare spending will grow much faster. In the last year that CBO ran projections for the HI trust fund, it found a shortfall nearly four times larger than the Trustees. If HI spending grows at the rate of CBO’s long-term Medicare spending projection and trust fund revenue grows at the same rate that it did towards the end of CBO’s ten-year projection, we roughly estimate the shortfall would be 1.1 percent of GDP. Thus, under CBO’s methodology, the combined trust funds could need as much as 2.6 percent of GDP to ensure long-term solvency. Even if the actual total for the HI trust fund is lower than we estimate, it’s safe to say that CBO’s combined estimate for the Social Security and Medicare trust fund shortfalls would be more than the share of Trump’s tax plan that benefits millionaires. Regardless, the Clinton campaign is correct by at least one projection of the cost of shoring up the combined trust funds.
As for the Clinton campaign’s second claim on infrastructure, according to the American Society of Civil Engineers, the US has a funding gap of $1.44 trillion between what is currently committed to be spent on infrastructure and what is needed through 2025 in 2015 dollars. This amounts to about $1.6 trillion in nominal dollars. The total is less than the $2.7 trillion cost of the tax cuts for millionaires through 2025. ASCE estimates a funding gap through 2040 of $5.2 trillion in 2015 dollars, or $7 trillion in nominal dollars, which would likely be less than the cost of the tax cuts in that time. Assuming that the 2025 share of tax cuts going to millionaires applies to the years after that, the tax cuts would cost nearly $9 trillion just through 2036.
The Clinton campaign’s third claim about keeping every person out of poverty is also true, at least by the official poverty measure. The Census Bureau estimates that in 2014, 20.8 million families were living in poverty with average incomes that were $10,137 below the poverty line, meaning it would take about $210 billion to lift everyone’s income up to the poverty line in that year. If the amount of families in poverty stayed the same every year and the income gap increased with inflation, it would cost $2.44 trillion to keep everyone out of poverty over the 2017-2026 period. If the amount of families increased with population growth, it would take about $2.6 trillion over ten years. Either would be slightly below the ten-year cost of the Trump tax cuts for people making over $1 million.
In sum, the Clinton campaign is correct on the three statements it makes comparing other spending costs to Donald Trump’s tax cuts for millionaires, though it depends on whose estimates one uses for the Social Security and Medicare shortfalls.