Another Way to Look at the Medicare Slowdown
A recent Health Affairs piece from CRFB's Loren Adler and Adam Rosenberg showed that the prescription drug benefit, Part D, has been responsible for a majority of the Congressional Budget Office's downward revisions to actual and projected Medicare spending since 2011 (although Part A, the hospital insurance component, also played a significant role).
But judging the slowdown by how much CBO projections have changed is only one way to look at the issue. Another way would be to compare the actual slowdown in annual growth rates of each Part of Medicare over the past few years. Not surprisingly, a similar story arises from this approach -- the slowdown has been most prominent in Part D, followed closely by Part A.
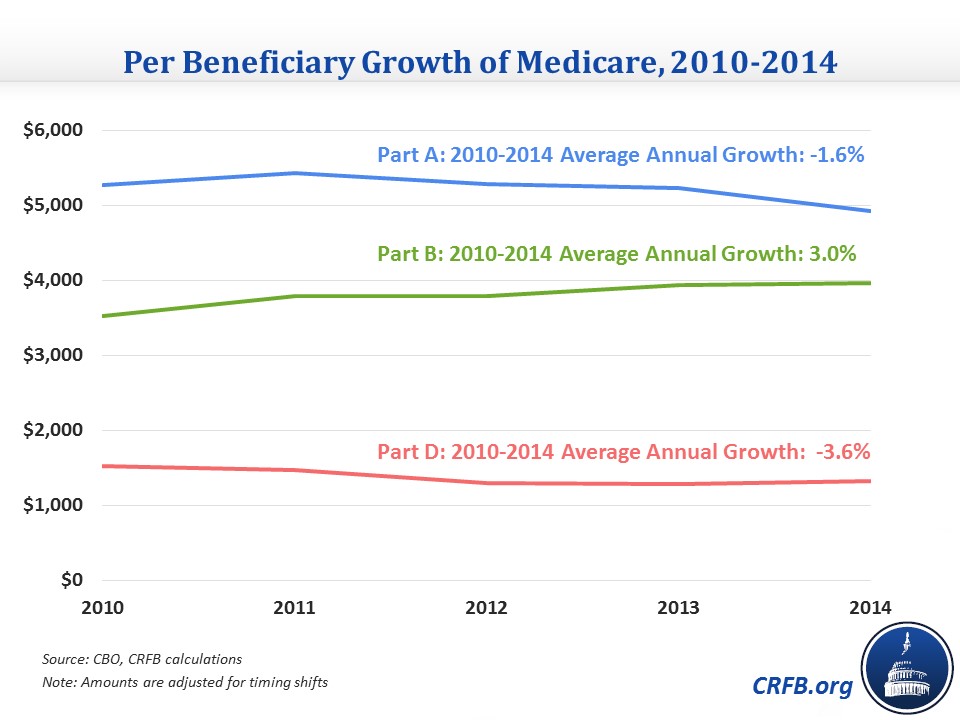
From 2010-2014, Medicare per beneficiary spending actually shrank at an average annual rate of 0.3 percent (although total spending still increased as more and more baby boomers reached retirement). As illustrated below, both Parts A and D experienced negative per beneficiary growth over this window, while Part B grew only slightly slower than GDP per capita.
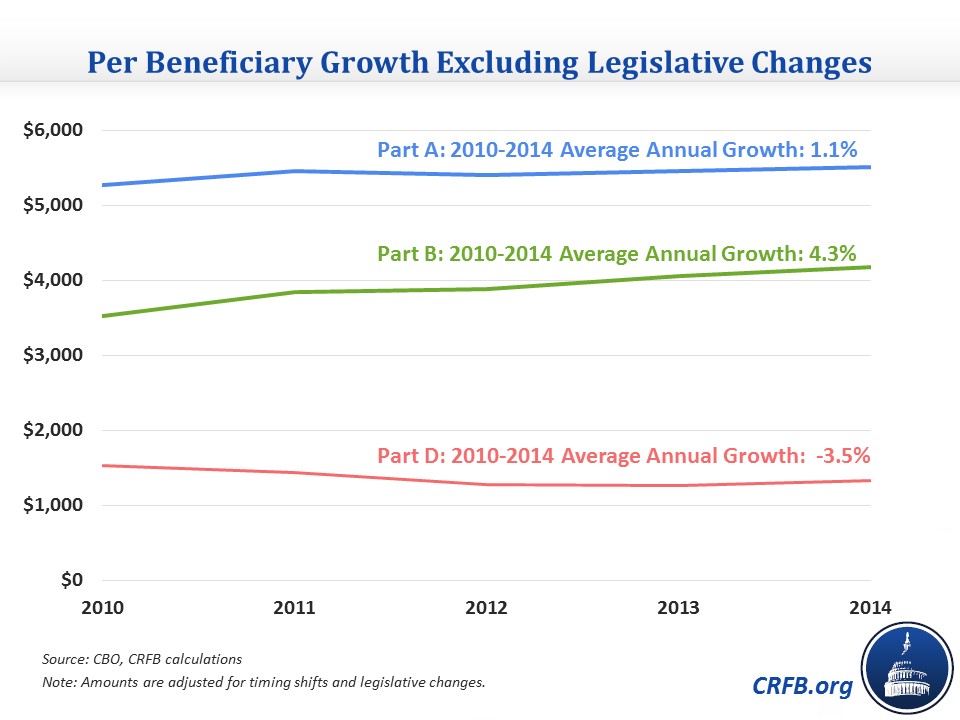
An important distinction to make, however, is how much of the slowdown is due to the direct effects of legislative changes (which were predictable) and how much is due to other factors. Excluding the effect of legislative changes in the Affordable Care Act, from the sequester, and doc fix offsets, Medicare per beneficiary costs grew at an average annual rate of 1.6 percent. While Parts A and B would have grown faster without the myriad explicit Medicare cuts, predominantly those included in the Affordable Care Act (ACA), Part D would have grown at roughly the same rate (because the ACA also closed much of Part D's coverage gap, or "donut hole").
Underlying per beneficiary spending in Part D, therefore, has remarkably declined by an average of 3.5% annually since 2010. Even after accounting for legislative effects, Part A still grew at an impressively slow rate of 1.1% annually on a per beneficiary basis, but Part B spending grew closer to historical rates (at roughly GDP+1 percent per capita growth). Notably, though, as Peter Orszag pointed out, some of the faster growth in Part B could be the result of the ongoing shift to perform more services in the outpatient rather than inpatient setting (similarly, this means that the extent of the Part A slowdown might be overstated). Combined, per beneficiary costs in Parts A and B grew at just 2.5% annually from 2010-14.
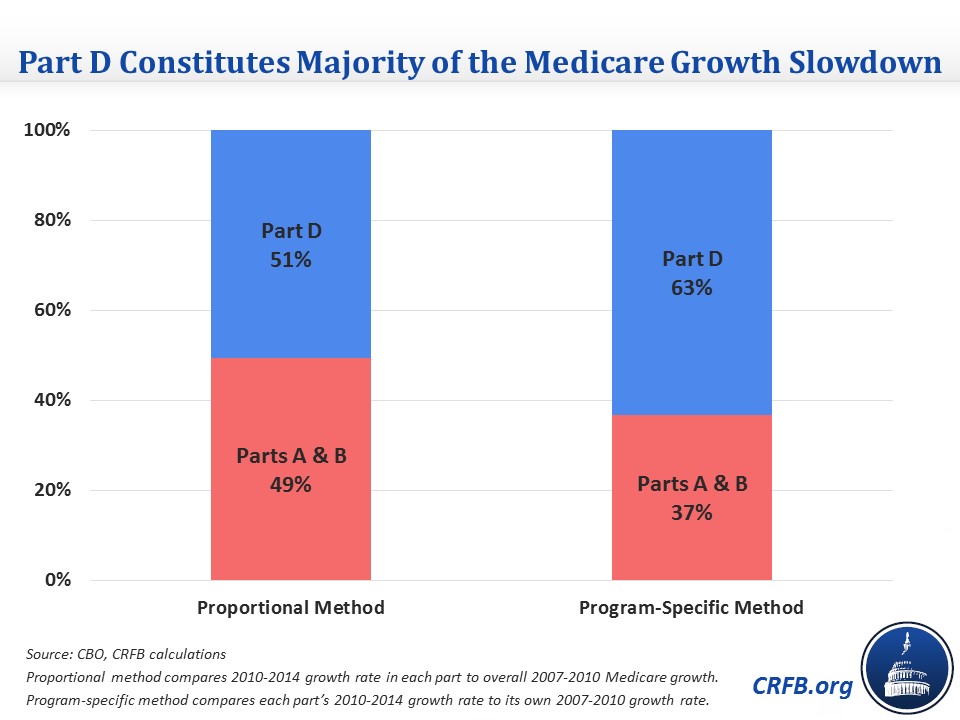
Therefore, just as with CBO's downward revisions, we find that Part D played a disproportionate role in the recent slower growth of Medicare spending. To determine the share of the additional slowdown in average annual Medicare cost growth from 2010-14 compared to 2007-10 (the window analyzed by CBO) attributable to Part D, we use two methods to compare the growth from 2007-2010 to the legislation-excluded 2010-2014 growth rate. The first compares the growth rate of each component part of Medicare (i.e., Part A, B, or D) for 2010-2014 to the overall Medicare growth rate for 2007-2010 (the "proportional method"). The second compares the growth rate of each part across each period (the "program-specific method"). Both methods weight the difference in growth rates by the total spending in each part. Each method finds that a majority of the slowdown resulted from Part D's shrinking per beneficiary spending: 51 percent from the proportional method and 63 percent from the program-specific method.
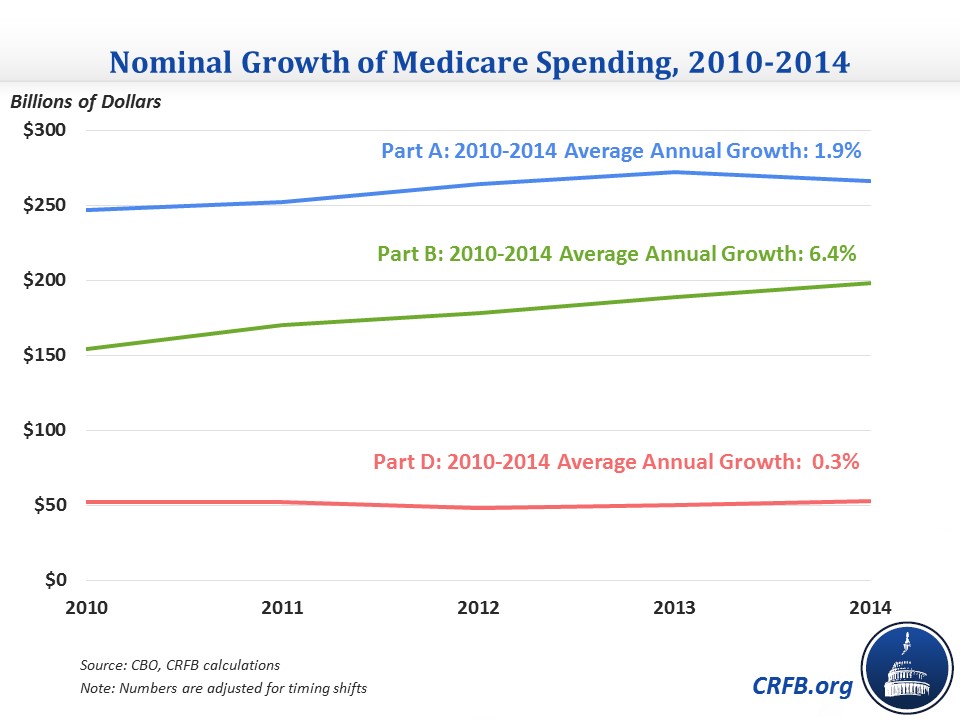
Indeed, total nominal Part D costs are nearly the same today as they were back in 2010 -- even as Part A and B costs have grown by $19 and $44 billion, respectively.
That Part D has played an outsized role in the slowdown, though, should not take away from the also remarkable slowdown occurring in Parts A and B. Growth in Parts A and B remains significantly below historical trends even after excluding the direct effects of policy changes, and while some of this slowdown simply reflects the Medicare population getting younger, on average, as more and more baby boomers age into the program, much remains unexplained (fostering the possibility that some may prove structural). It's too early to be certain, but growing evidence indicates that some of this slowdown might be the result of hospitals and other providers changing their practices to prepare for the potential future world, in which fee-for-service may no longer be the dominant reimbursement scheme and quality metrics drive a higher percentage of revenue.
But while the Part D slowdown also benefits from the Medicare population getting younger, its sustainability looks far less certain since CBO found that it has been primarily the result of the "patent cliff" and a slower rate of technological innovation in prescription drugs that may very well pick up in the future. The Part D slowdown might also be buoyed to some degree by prescription drug plans' improving methods of steering toward lower-cost drugs (something policymakers could help with on the margins), but pharmaceutical innovation may already be returning with the recent wave of expensive specialty drugs. Moreover, it's unclear whether a permanent Rx technological slowdown would constitute a positive development (even if it meant lower costs).
Understanding the root causes of the Medicare cost slowdown (on which more research is still needed) is important to predicting its future, which will have enormous ramifications for its beneficiaries and our nation's fiscal situation.