Our Top 20 Charts of 2020
2020 was a busy year for fiscal policy, which gave us ample opportunities to conduct substantive policy analyses using charts and tables. This year, we published over 230 papers, blog posts, and other products. As we get ready to pop the champagne and ring in the new year, here are our top fiscal charts of 2020.
1. The National Debt is Now Larger than the Economy
In September, the Congressional Budget Office (CBO) projected debt would rise from over 98 percent of Gross Domestic Product (GDP) at the end of Fiscal Year (FY) 2020 to 109 percent by 2030. Under an alternative scenario where lawmakers enact another $1 trillion of stimulus, allow expiring tax provisions to continue, and grow annual appropriations with the economy, debt would reach 121 percent of GDP by 2030.
Since this chart was published, CBO noted that FY 2020 ended with debt over 100 percent of GDP. This estimate marks the first time debt has eclipsed the size of the economy since 1946 when the national debt totaled 106 percent of GDP. Congress also enacted another relief package in late December with over $900 billion in additional COVID relief and extending many expiring tax provisions, two of the three elements of our alternative scenario.

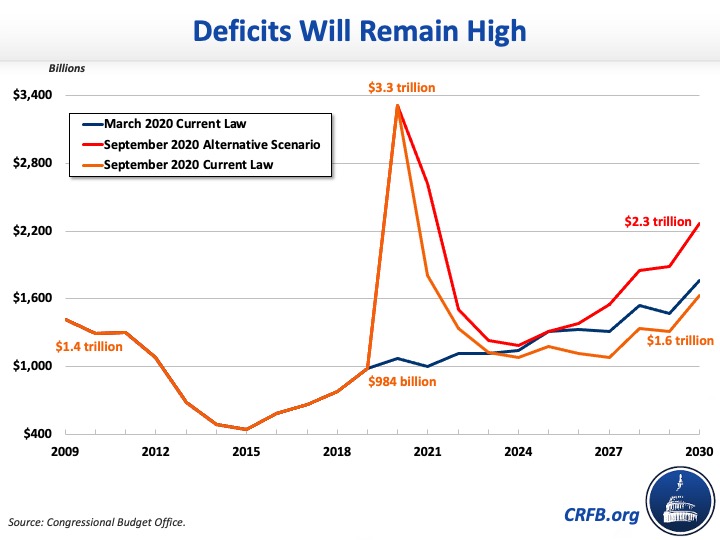
2. The Budget Deficit Exceeded $3 Trillion in 2020
In September, CBO projected the FY 2020 deficit would total $3.3 trillion. From there, CBO projected deficits would decline to $1.8 trillion in 2021, fall just below $1.1 trillion in 2027 and then rise again to $1.6 trillion by 2030. Since this chart was published, CBO updated its FY 2020 deficit figure to the reflect the actual year-end deficit of $3.1 trillion.
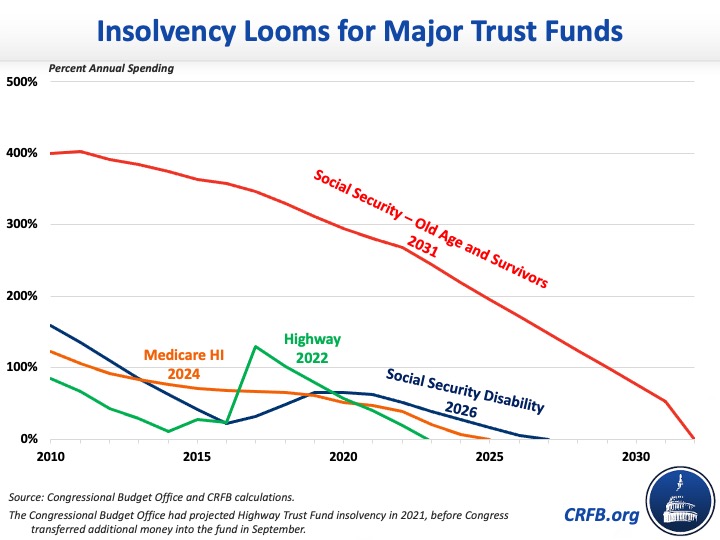
3. Major Trust Funds Are Approaching Insolvency
Over the next decade, four major federal trust funds are expected to exhaust their reserves and become insolvent. The Highway Trust Fund (HTF) will deplete its reserves in 2022, while CBO estimates the Medicare Hospital Insurance (HI) trust fund in 2024, the Social Security Disability Insurance (SSDI) trust fund in 2026, and the Social Security Old-Age and Survivors Insurance (OASI) trust fund in 2031. Upon insolvency of these trust funds, across-the-board benefit cuts will occur unless action is taken to stabilize their finances.
4. The CARES Act Provided $2.3 Trillion of COVID Relief
In March, the $2.3 trillion Coronavirus Aid, Relief, and Economic Security (CARES) Act was signed into law. The bill provided much-needed relief to households, businesses, health providers, state and local governments, and other entities. To show all the different aid within the bill, we created a visual showing the sources and recipients of the $2.3 trillion relief bill.

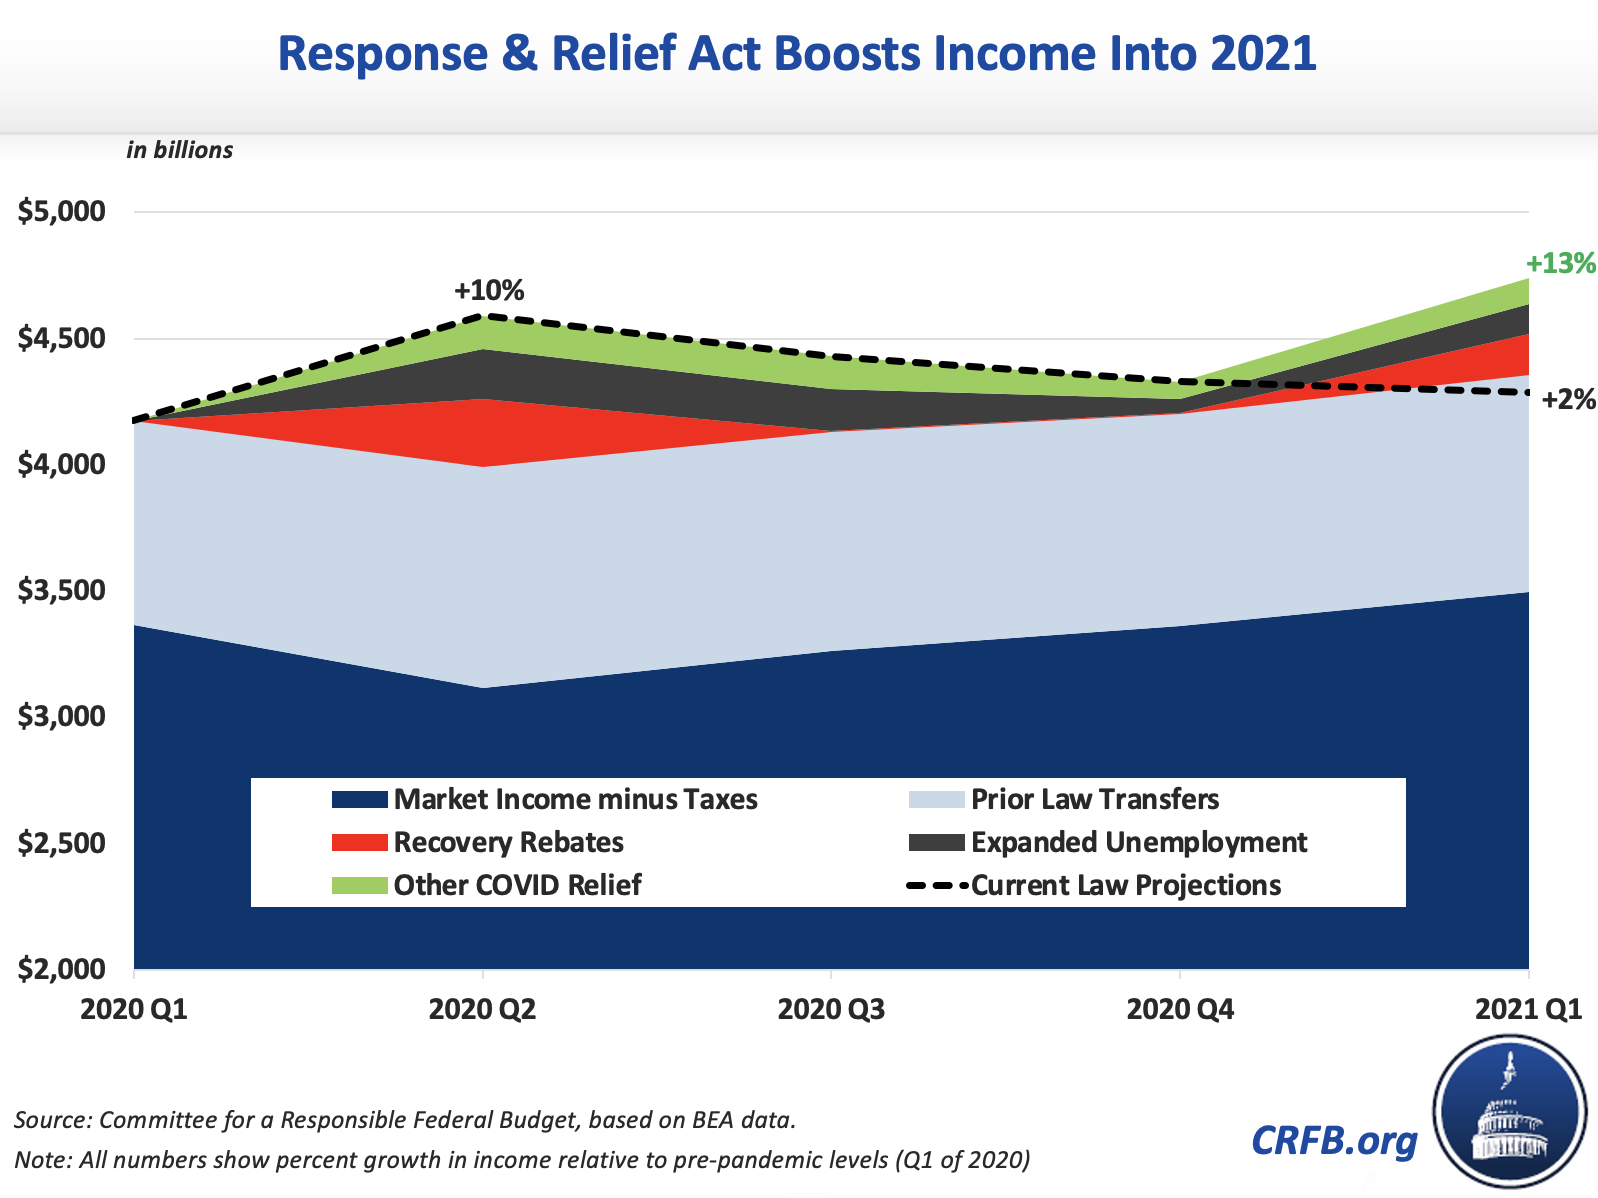
5. Personal Income Grew Massively During the COVID Recession
Total personal disposable income rose by 10 percent between the first and second quarter of 2020 – about 10 times the normal pace – despite GDP falling by 10 percent over the same period. Though income fell somewhat in subsequent quarters, it remained above pre-pandemic levels over the course of the year. In the first quarter of 2021, we project income to rise to 13 percent above pre-pandemic levels. The disconnect between economic output and personal income is driven largely by increased unemployment benefits, stimulus checks, and other fiscal and monetary support.
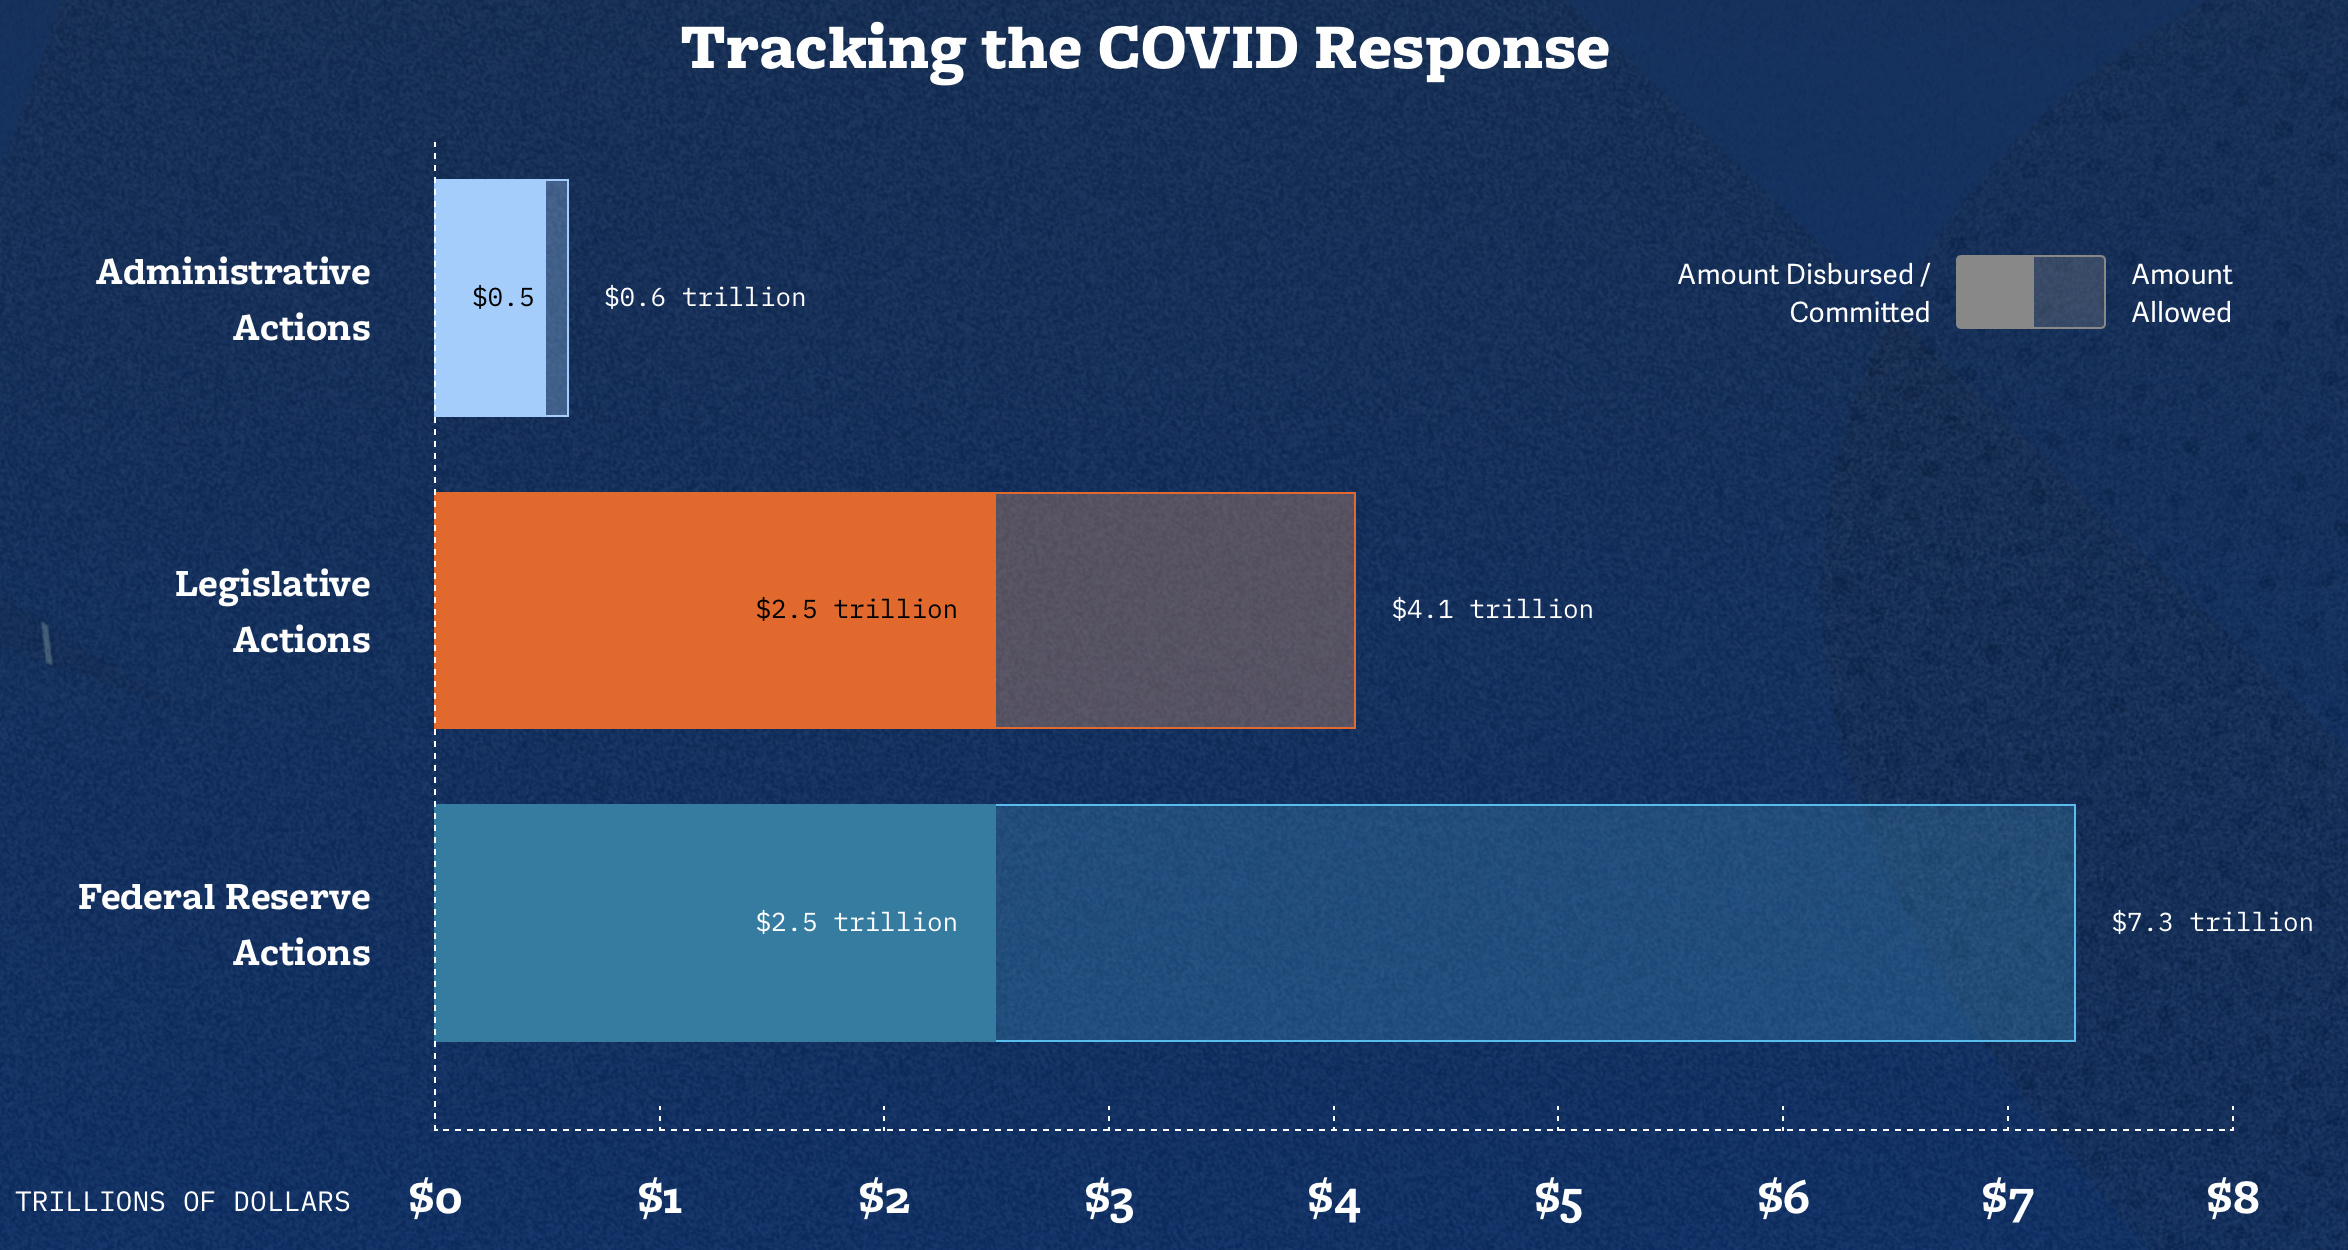
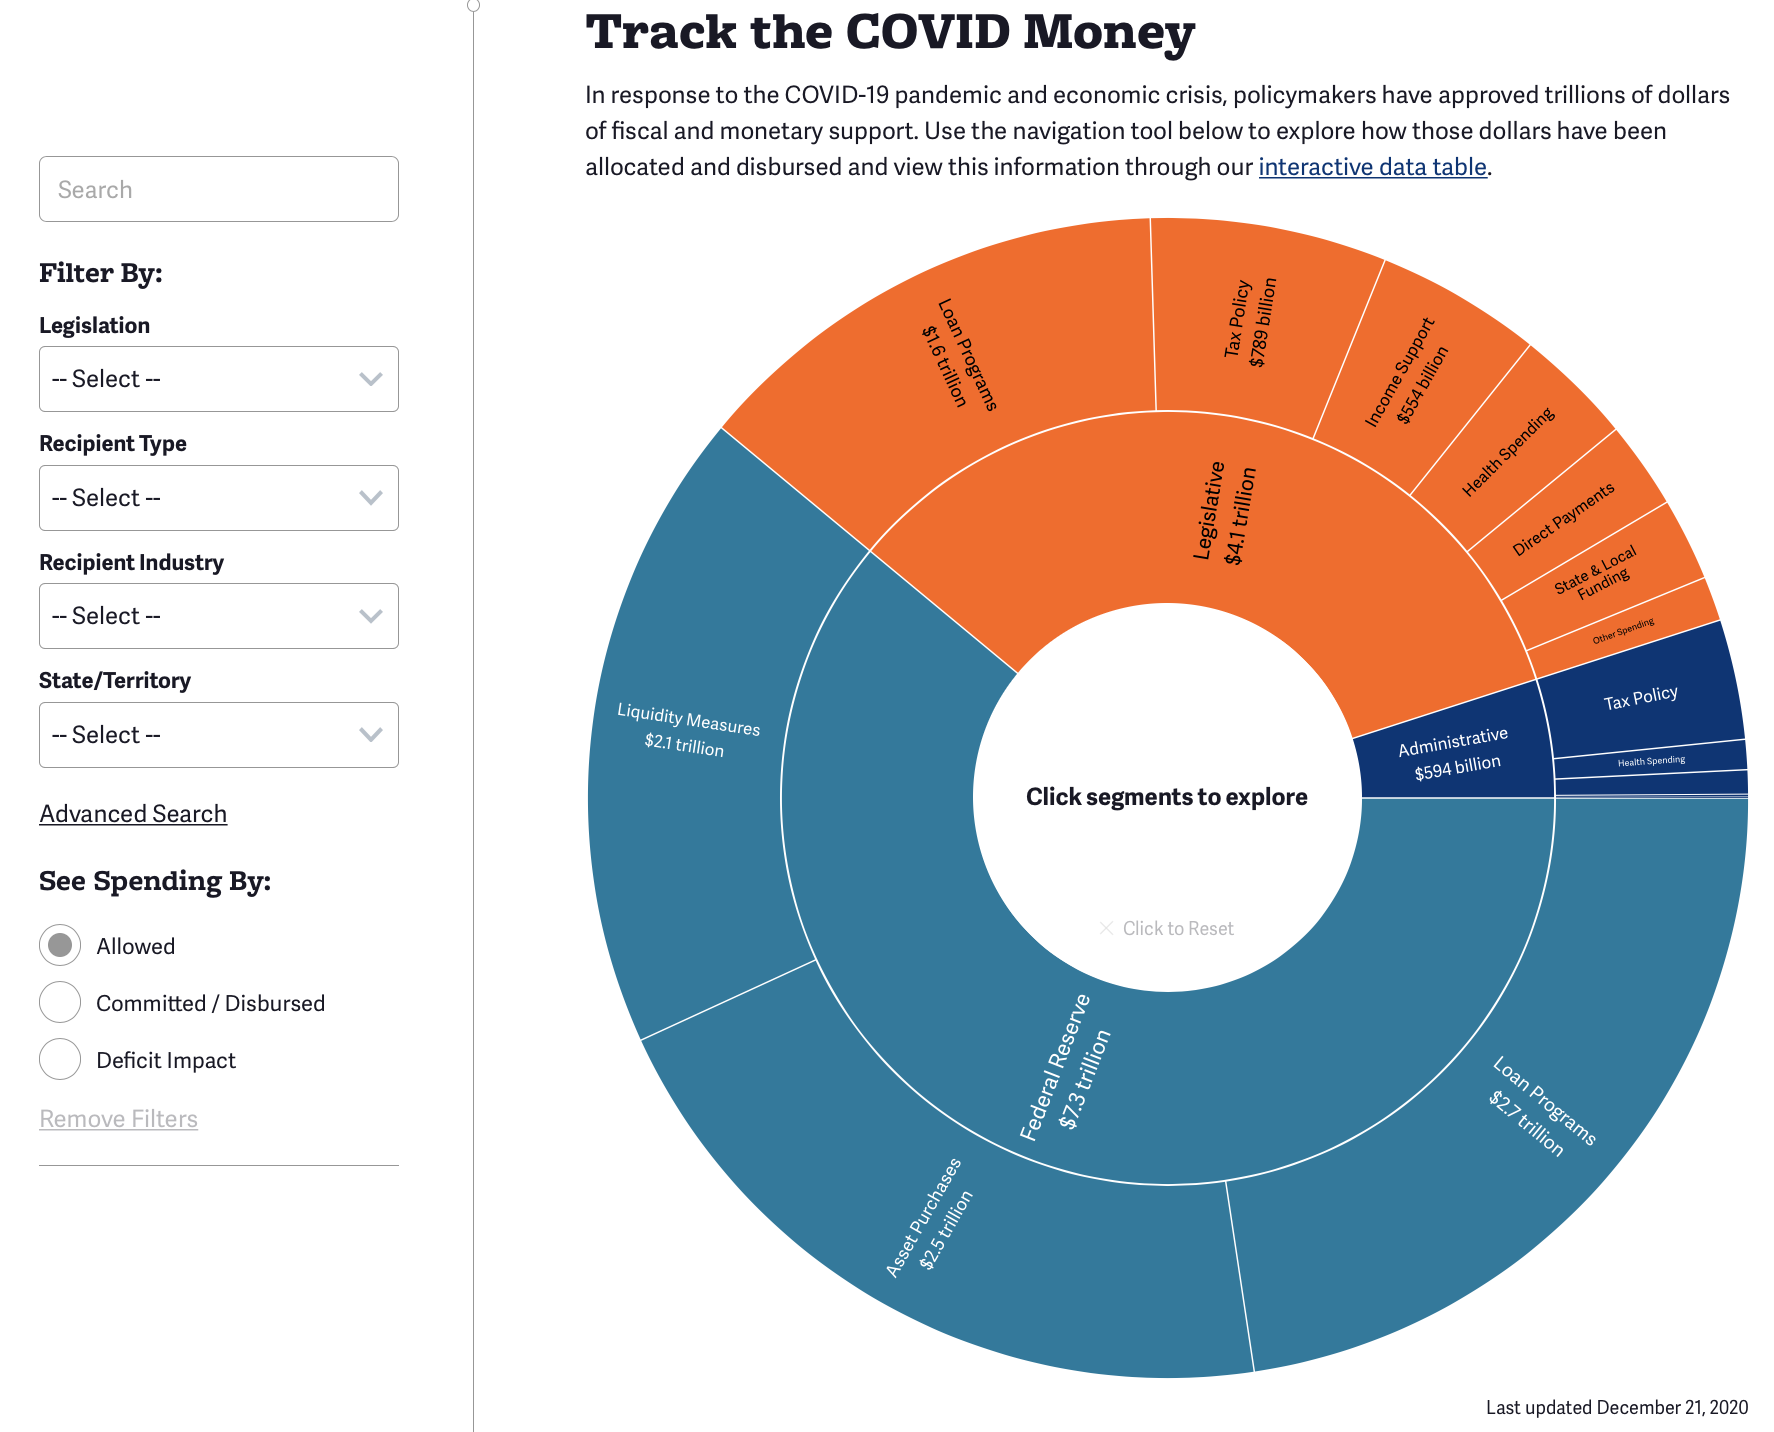
6. You Can Now Track COVID Relief Dollar by Dollar
In August, the Committee for a Responsible Federal Budget launched our interactive COVID Money Tracker tool. At COVIDMoneyTracker.org users can follow every major action taken by Congress, the Administration, the Federal Reserve, and various federal agencies in response to the current public health and economic crisis. As of December 21, a total of $12.0 trillion of relief has been allowed, and $5.5 trillion of the relief has been committed or disbursed. Those numbers will soon change in light of the recently-enacted Response & Relief Act.
7. You Can Use COVID Money Tracker to Track Federal Dollars in Multiple Ways
Our interactive COVID Money Tracker tool allows users to track federal dollars in multiple ways. Through a "sunburst" visualization, for example, users can follow the dollars allowed, disbursed, or added to the deficit and dive down into the data to see great levels of detail – down to the dollars allocated to specific states and entities. Users can also narrow their search with search and filter options. See more at COVIDMoneyTracker.org.
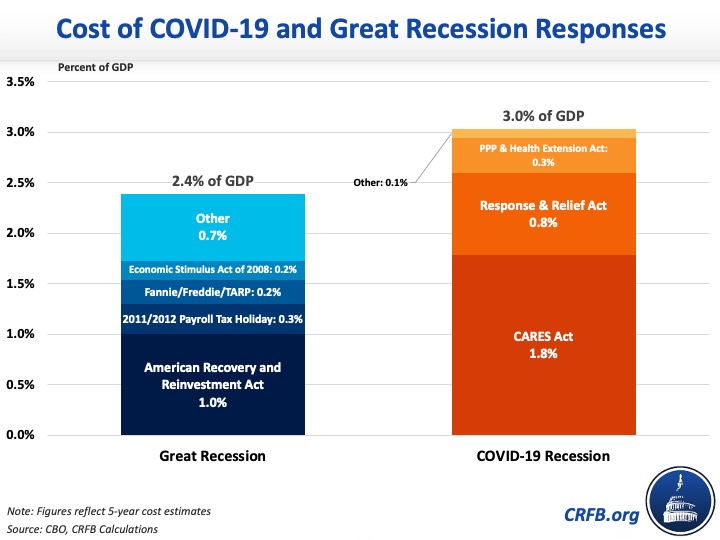
8. The Fiscal Response to COVID-19 is Larger Than the Great Recession Response
Over the next five years, we estimate the legislative response to the COVID-19 pandemic – including the recently-passed Coronavirus Response & Relief Supplemental Appropriations Act – will total about $3.5 trillion, or approximately 3 percent of GDP through 2024. By comparison, between 2008 and 2012 Congress enacted roughly $1.8 trillion of fiscal stimulus and other economic support in response to the Great Recession. This support was equivalent to 2.4 percent of GDP. As we show, the COVID response is also much more accelerated – with nearly all the spending taking place over two fiscal years, compared to five years for the Great Recession.
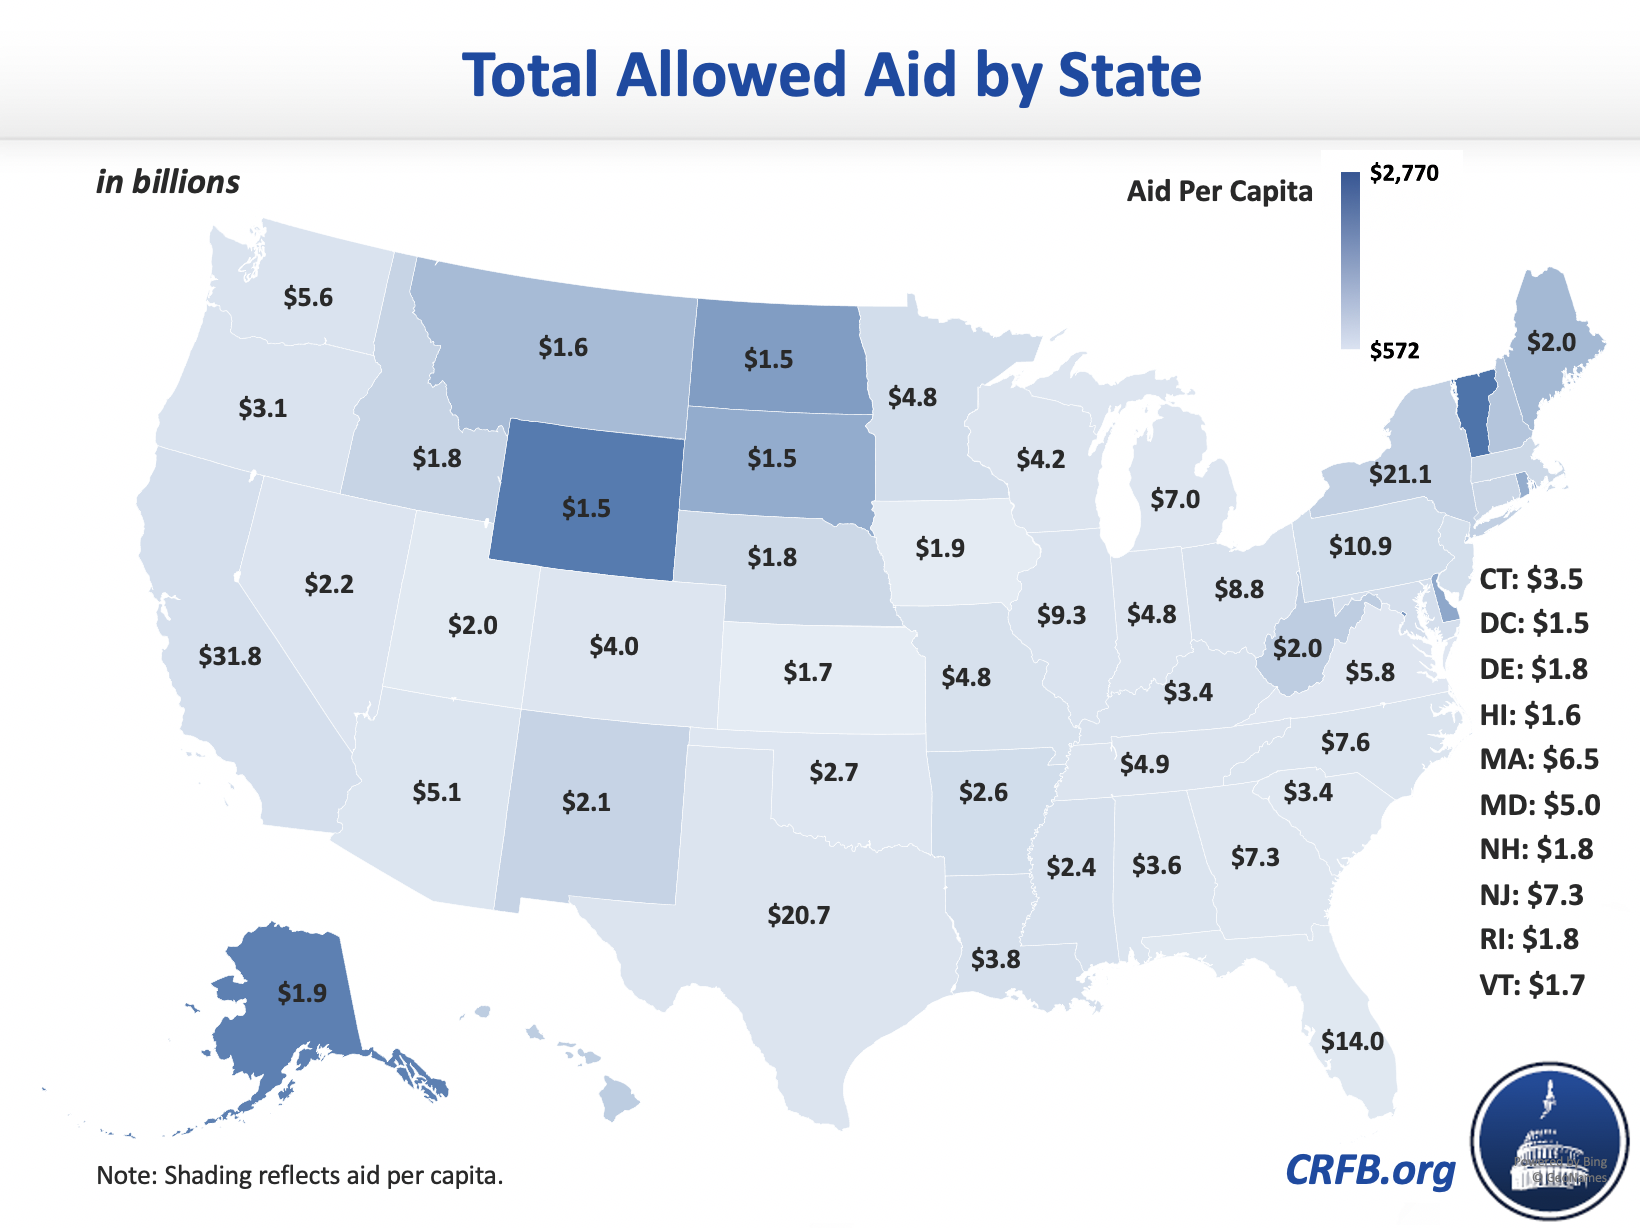
9. State and Local Governments Received Substantial COVID Relief
Prior to the recent Relief & Response Act, we estimated that policymakers authorized roughly $280 billion of direct support to state and local governments - including $150 billion in grants through the Coronavirus Relief Fund, $85 billion through higher Medicaid matching rates, and over $40 billion to schools and transit authorities. We estimate California will get the most aid – $32 billion – while Vermont will get the most aid per capita ($2,770). In light of the Relief & Response Act, total available support to state and local governments now exceeds $350 billion.
10. The Paycheck Protection Program Helped Many Small Businesses
The CARES Act created the Paycheck Protection Program (PPP) to provide forgivable loans to small businesses to sustain their operations during the COVID-19 pandemic. Our July analysis of the program found $521 billion of disbursed PPP loan dollars out of a $670 billion appropriation. That includes the entire $349 billion of original funding authorized in the CARES Act that quickly ran out, and over 50 percent of the $321 billion in additional funding authorized under the Paycheck Protection Program and Health Care Enhancement Act, with about $40 billion in loans returned or canceled.
The Paycheck Protection Program ended on August 8 with $134 billion of unused funds. The latest COVID relief package will reopen the PPP and provide another $284 billion of forgivable loans to small businesses.

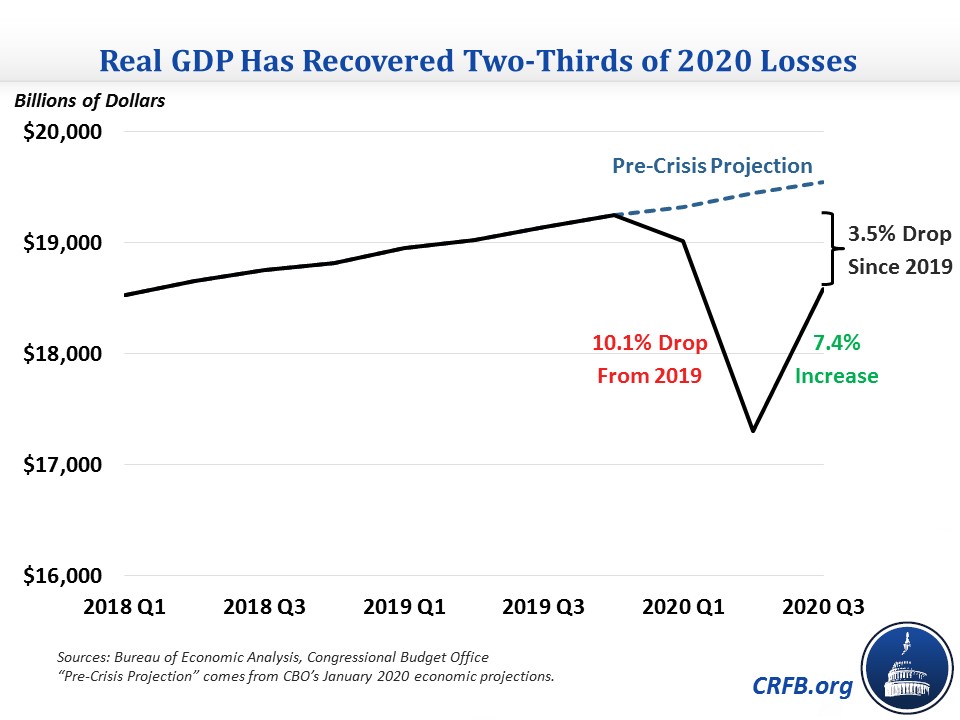
11 and 12. No, GDP Did Not Fall or Rise by 33 Percent This Year
Annualized numbers are useful for describing trends in economic growth, but not sharp one-time shifts. In a pair of fact checks released in July and October, we showed that the economy neither shrank by one-third in the second quarter of 2020 nor grew by that much in the third quarter. Rather, the economy shrank by almost one-tenth – still a massive contraction – and then regained about two-thirds of that loss in the third quarter.

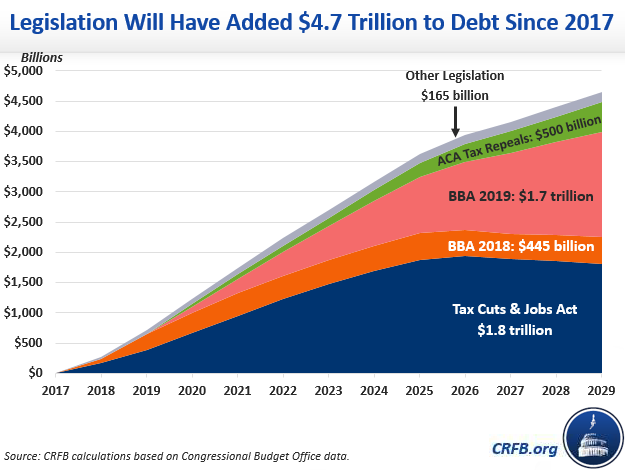
13. Before the COVID Crisis, President Trump Added $4.7 Trillion to the National Debt
Between 2017 and 2019, we estimated President Trump signed $4.7 trillion of new debt into law through 2029. That includes over $1.8 trillion from the Tax Cuts and Jobs Act, $1.7 trillion from the Bipartisan Budget Act of 2019 (BBA 19), and another $1.1 trillion from other tax cuts and spending increases. This debt increase is nearly as large as our estimates of Trump's 2016 campaign agenda.
14. The Major Democratic Presidential Candidates Proposed Costly Health Care Plans
Through our US Budget Watch 2020 project, we estimated the costs of the health care plans proposed by the four major Democratic presidential candidates. Our analysis found that Elizabeth Warren's plan would have the greatest gross cost - $31.8 trillion - under our central estimate while Joe Biden's plan would have the lowest gross cost of roughly $2.3 trillion. Once cost reductions and pay-fors were added in, we estimated that the Warren plan would cost $6.1 trillion, Bernie Sanders' plan would cost about $13 trillion, the Biden plan would cost $800 billion, and Pete Buttigieg's plan would save $450 billion.

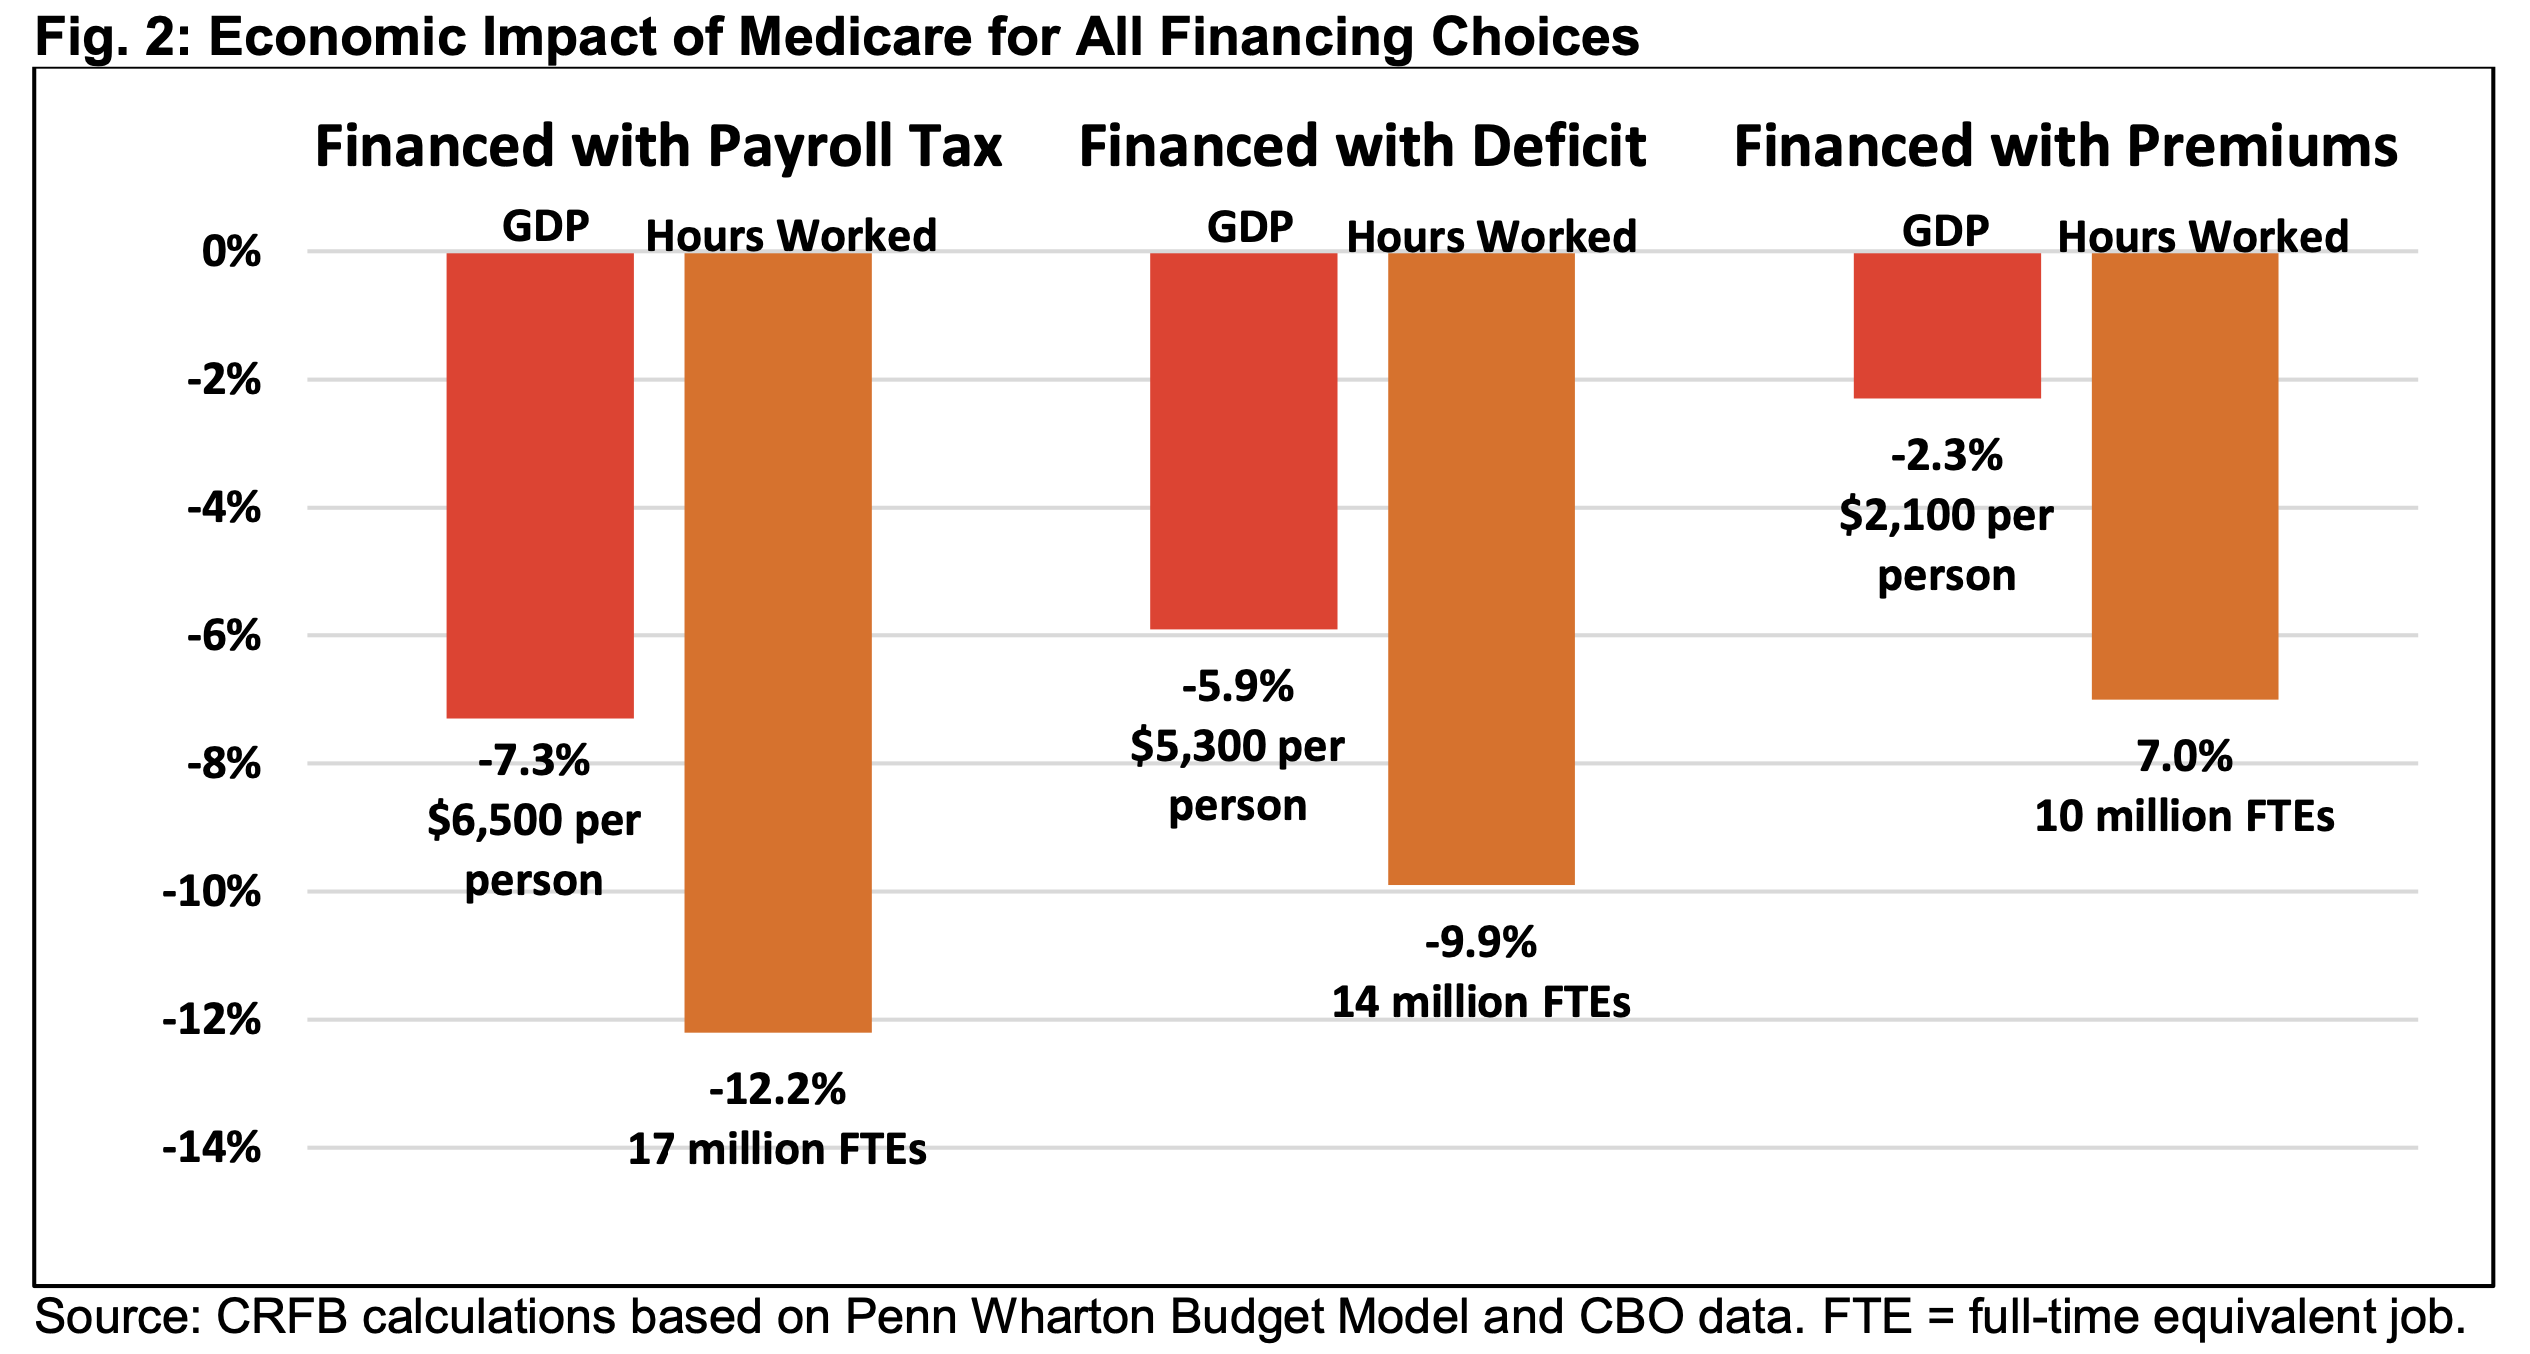
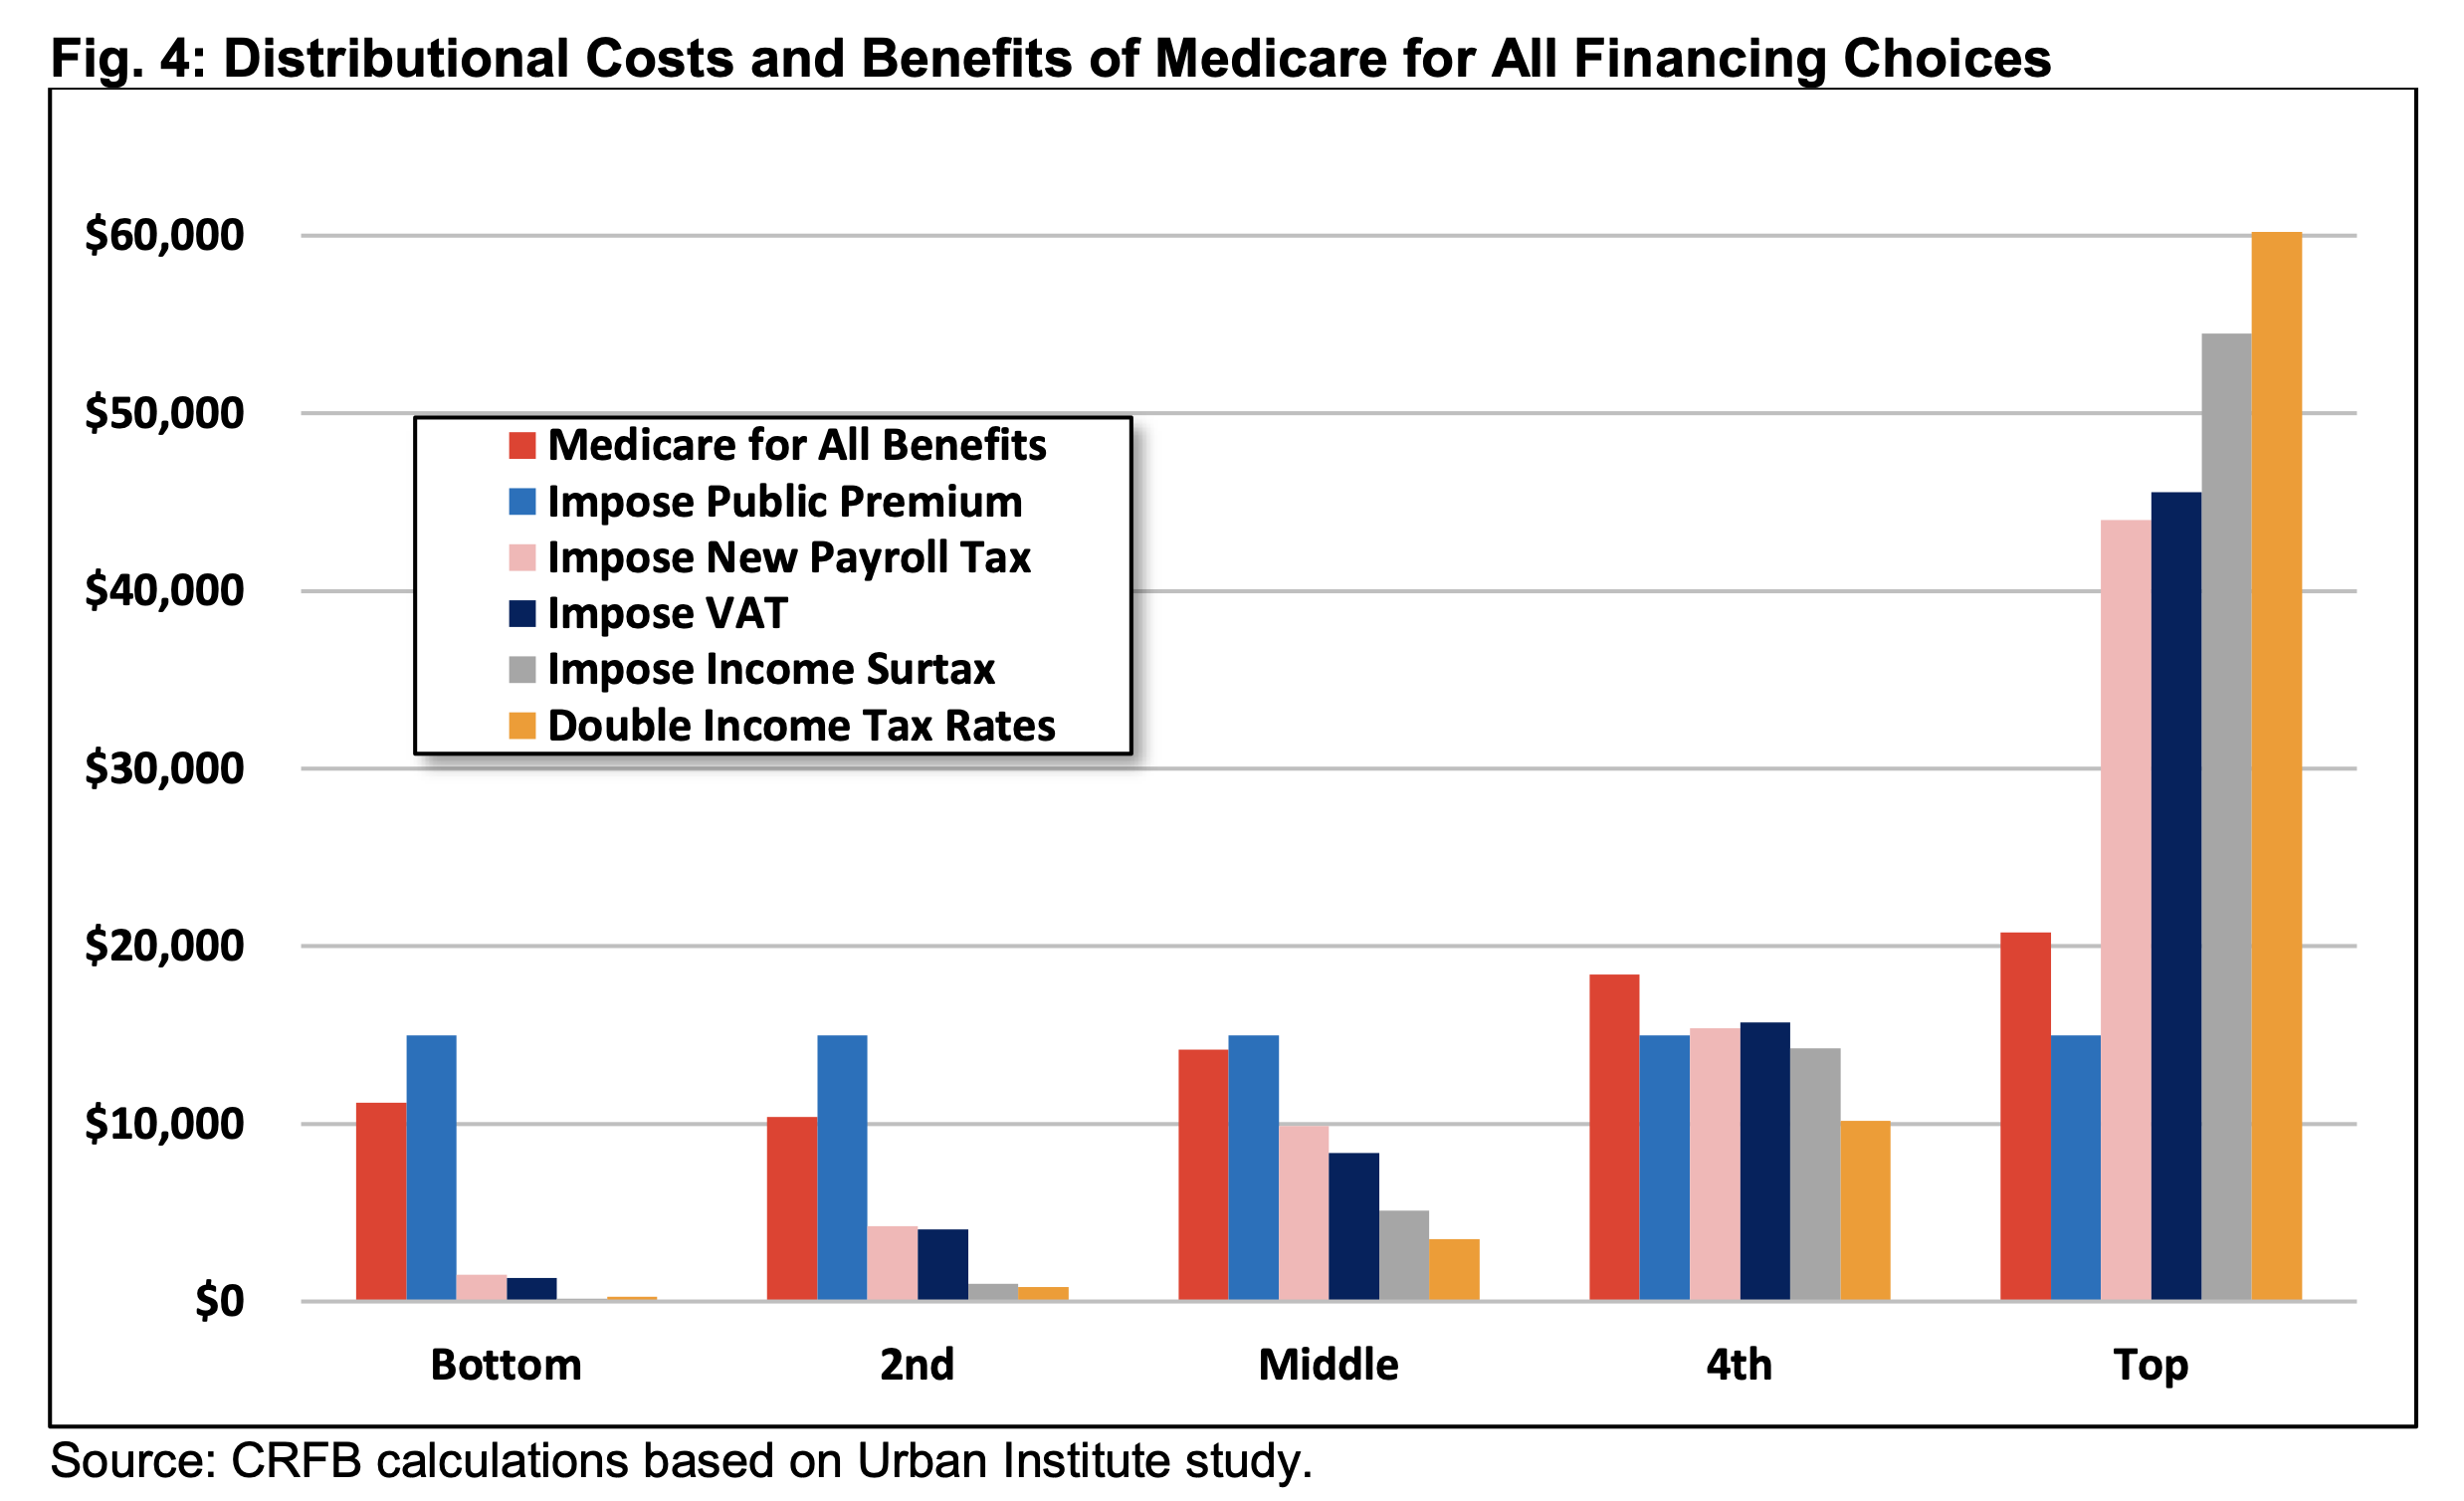
15 and 16. Financing Medicare for All Includes Making Tough Choices
Medicare for All proposals under discussion generally eliminate premiums and most cost-sharing. These funding sources can be replaced with new taxes, spending cuts, borrowing, or some combination. As we show in Choices for Financing Medicare for All, however, the decision of what financing source to use could have substantial economic, distributional, and policy consequences.
17. Presidential Campaign Agendas Would Significantly Increase the National Debt
During the 2020 presidential general election campaign, we estimated the cost of the Trump and Biden campaign plans. Our central estimate of the Trump plan found that debt would rise to 125 percent of GDP by 2030, excluding the effects of further COVID relief. Under our central estimate of the Biden plan, we found that debt would rise to 127 percent of GDP by 2030, excluding COVID proposals. Our analysis also provided low-cost and high-cost estimates of the candidates' plans.

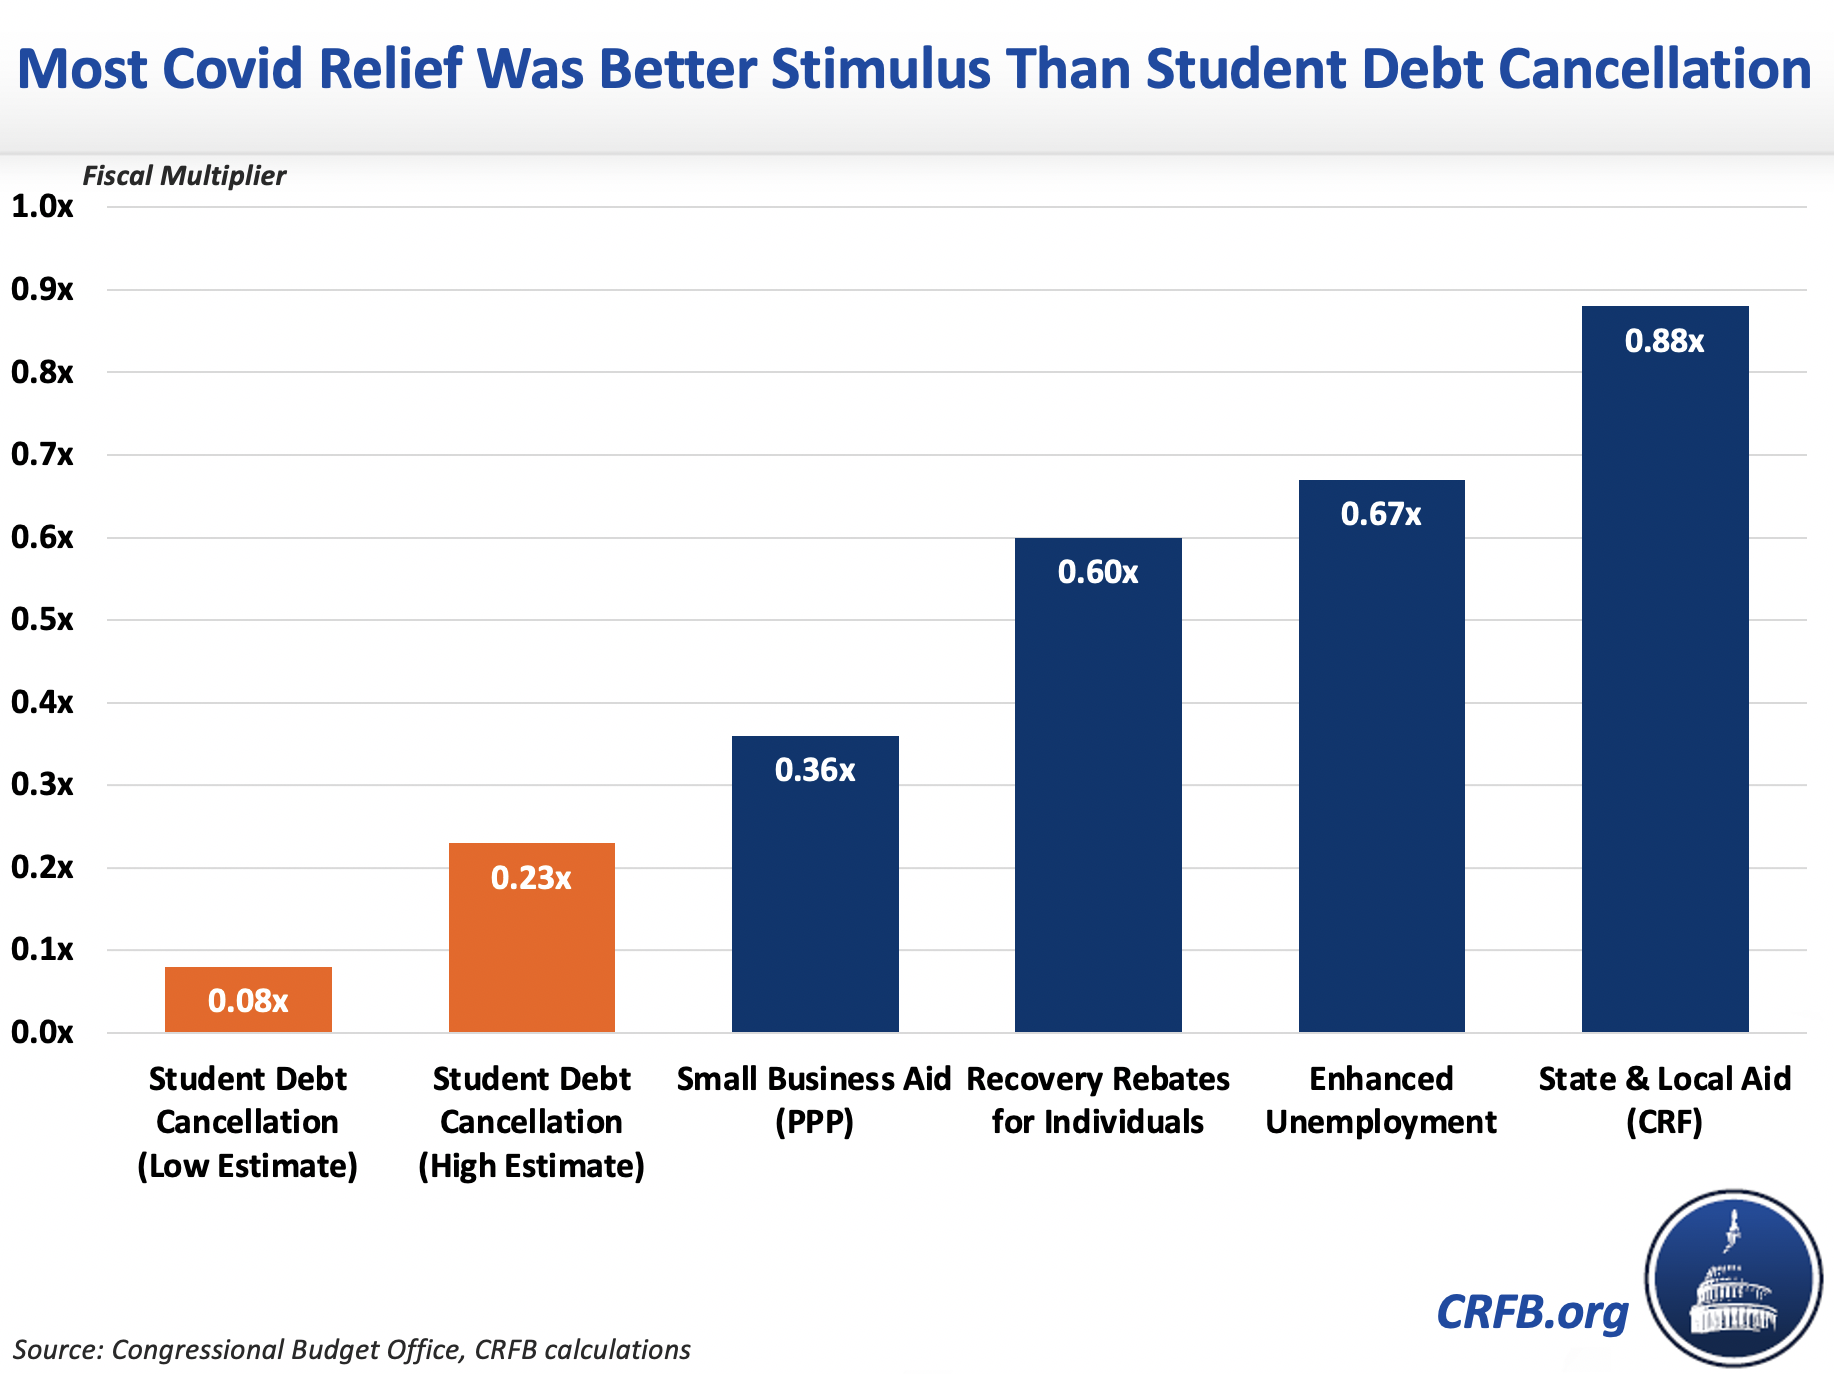
18. Student Debt Cancellation Has a Poor Fiscal Multiplier
Even with the effects muted as a result of social distancing, CBO estimated most COVID relief measures have a fiscal multiplier between 0.36x and 0.88x, meaning every dollar of fiscal support increased the size of the economy by 36 to 88 cents. By contrast, we recently estimated that canceling all student debt would have a multiplier of somewhere between 0.08x and 0.23x - meaning each dollar of debt cancellation would produce somewhere between less than a dime and less than a quarter of economic output. This low multiplier is partially driven by the minimal effect of debt cancellation on annual cash flow, and partially driven by the larger share of cancellation that would go to those with higher levels of education and earnings and lower levels of unemployment and income loss.
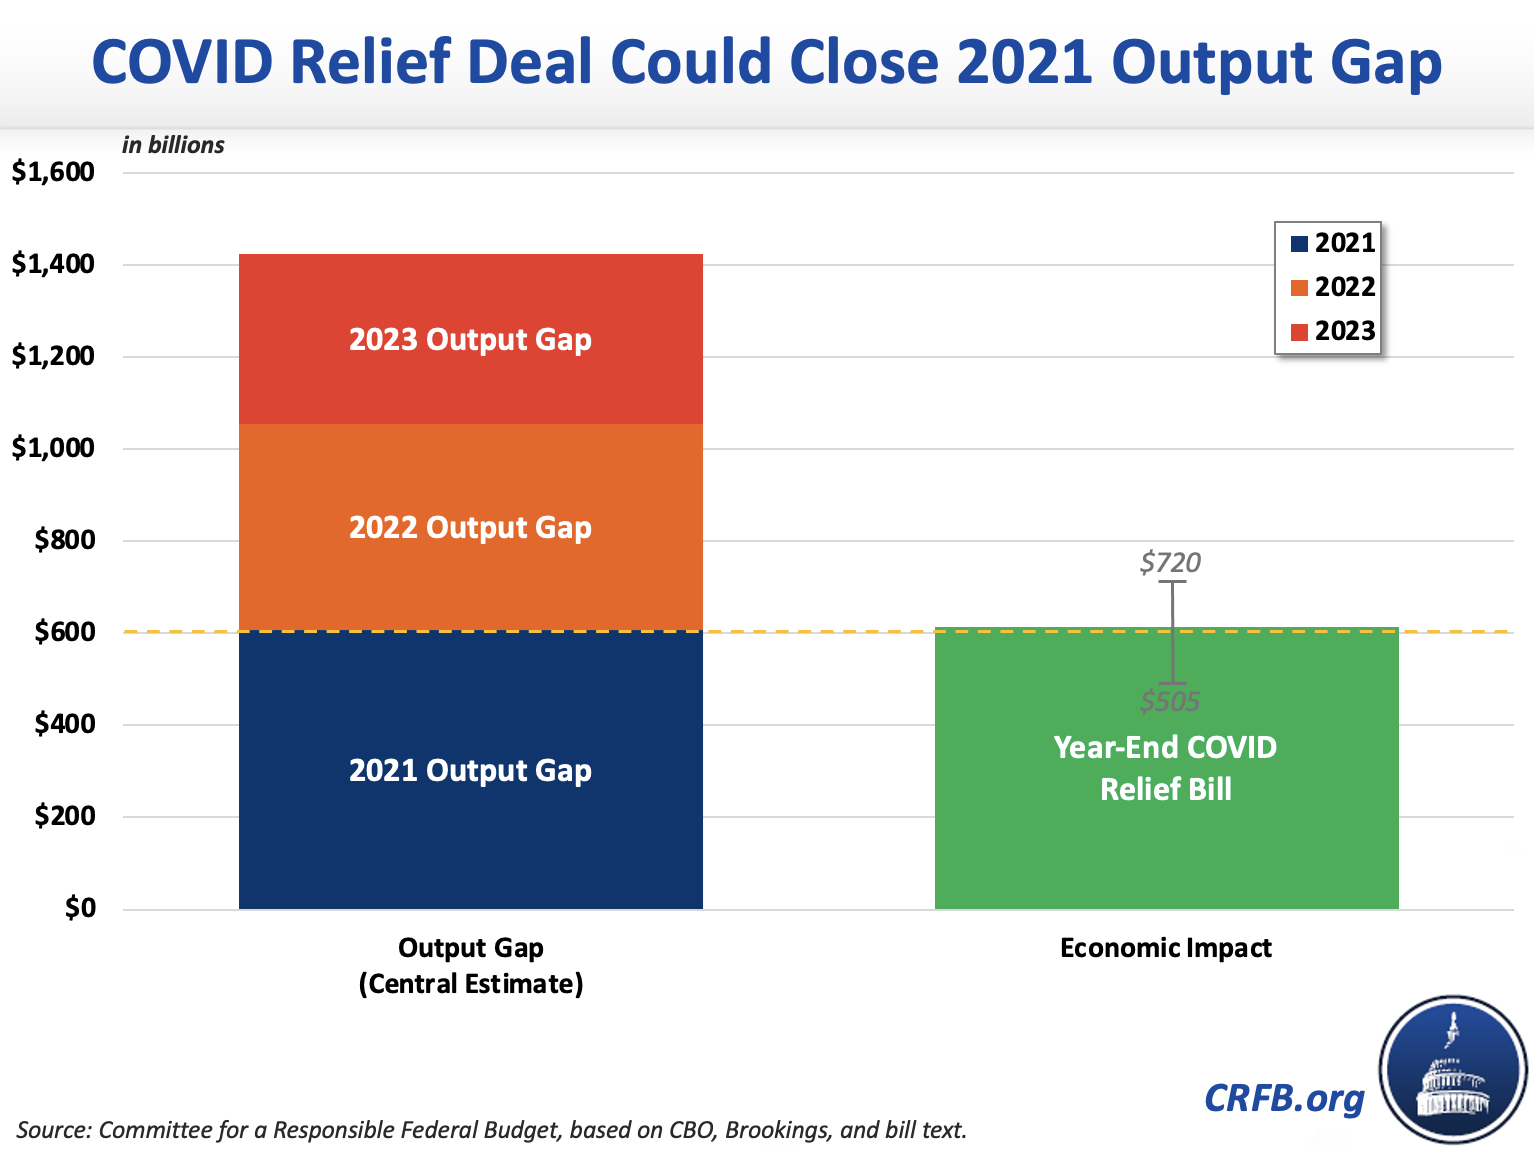
19. The End-Of-Year COVID Relief Deal Will Support the Economic Recovery
We recently estimated that the $920 billion Response & Relief Act will boost economic activity by somewhere between $505 and $720 billion over a three year period. The mid-point estimate of $615 billion would be enough to close the entire output gap – the difference between how the economy will perform and how it would perform at its full potential – in 2021. Since the economic effect of the legislation takes time to fully take hold, we estimate it would actually close about three-quarters of the output gap in 2021 and then another fifth of the gap in 2022 and 2023. Under our central economic projections, more fiscal support would be needed to support a full economic recovery once the pandemic has essentially ended. In the optimistic scenario, this relief bill would be enough to allow the economy to fully recover on its own.
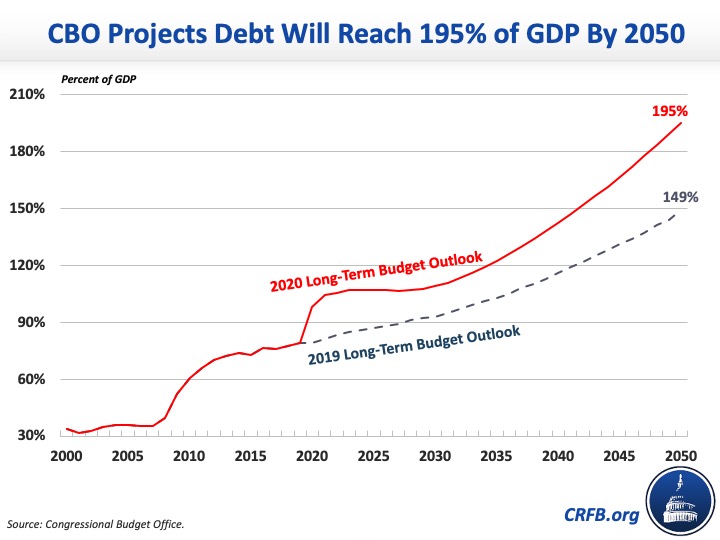
20. The Long-Term Debt Trajectory is Unsustainable
Prior to the COVID crisis, CBO estimated debt would total 1.5 times the size of the economy within 30 years – well above the prior record of 106 percent of GDP set just after World War II. Under CBO's latest long-term projections, debt will be almost twice as large as the economy by 2050. CBO estimates that such unprecedented debt levels could slow economic growth by about 20 basis points per year and reduce projected income by $6,300 per person. To make matters worse, debt could rise to nearly 250 percent of GDP if policymakers allow irresponsible tax cuts and spending increases to continue.
* * * * *
2020 was a dramatic year for fiscal policy. We look forward to a more normal year – with plenty more charts – in 2021. Happy New Year!
What's Next
-
Image

-
Image

-
Image