Our Top Fiscal Charts of 2019
2019 was a busy year for budget policy, which gave us ample opportunities to conduct substantive policy analysis using charts and tables. This year, we published over 220 papers, blog posts, and other products. As we get ready to pop the champagne and ring in the new year (and decade), here are our top charts of 2019.
1. Our National Debt is High and Rising
In August, the Congressional Budget Office (CBO) projected debt would rise from 79 percent of Gross Domestic Product (GDP) this year to 95 percent of GDP by 2029. As we've repeatedly warned, high and rising debt could have substantial adverse consequences. Rising debt is likely to slow income growth, increase interest payments and crowd out other priorities, place upward pressure on interest rates, weaken our ability to respond to the next recession or emergency, place an undue burden on future generations, and heighten the risk of a fiscal crisis.
Since this chart was published in August, policymakers added another $500 billion in debt by repealing three Affordable Care Act (ACA) taxes. Debt will now rise 2 points higher, to 97 percent of GDP by 2029.

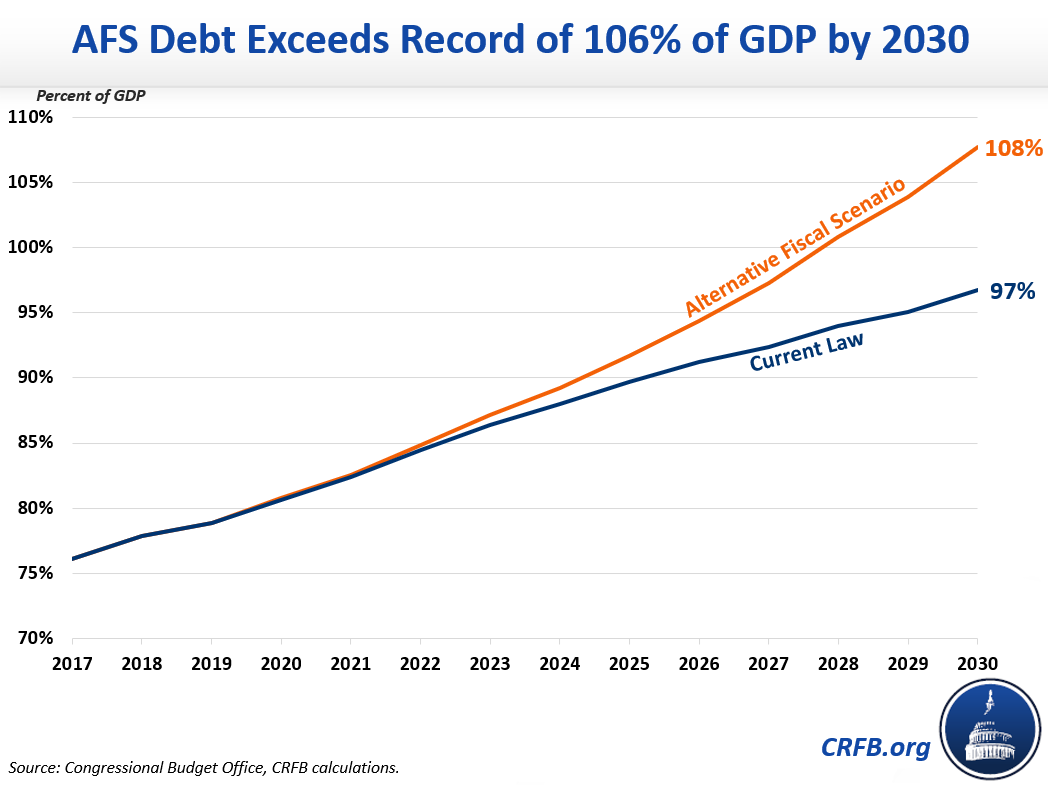
2. Debt Could Reach Record Levels by 2030
The Alternative Fiscal Scenario (AFS) assumes costly tax and spending policies that are temporary are extended rather than expire as scheduled under current law. Under the AFS, debt would rise from 81 percent of GDP this year, exceed the size of the economy by 2028, and reach 104 percent in 2029, compared to 95 percent of GDP under current law projections in August. By 2030, debt would reach 108 percent of GDP and surpass the all-time record of 106 percent of GDP set in 1946 just after World War II.
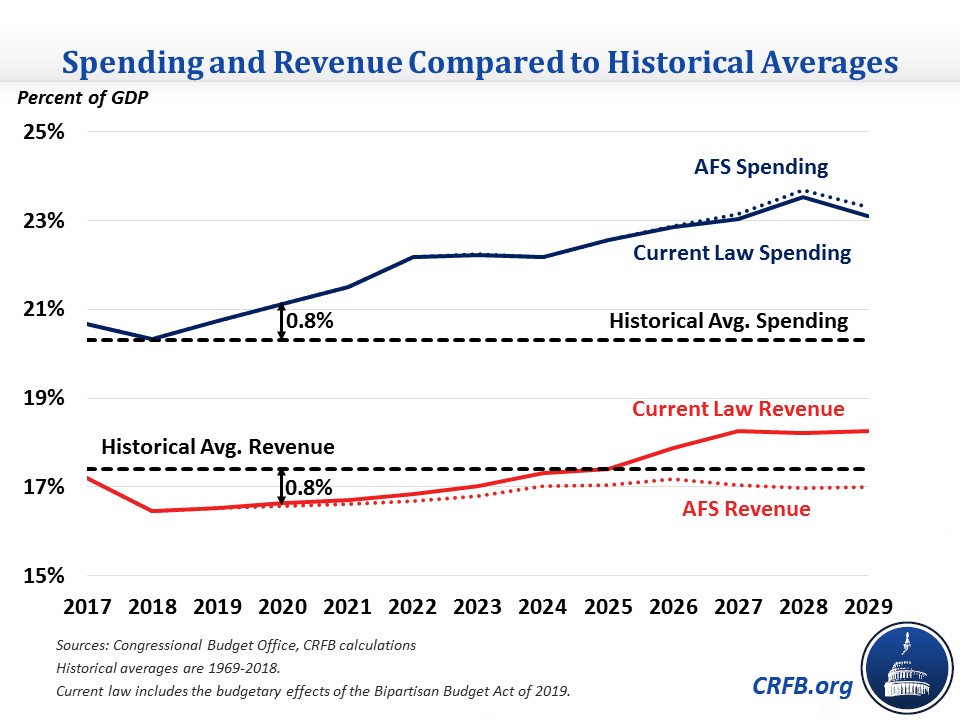
3. Spending is Above Its 50-Year Average While Revenue is Below
Federal spending is expected to total 21.0 percent of GDP in FY 2020, while revenue is projected to total 16.4 percent of GDP. With the 50-year historical averages for spending and revenue at 20.3 percent of GDP and 17.4 percent of GDP, respectively, spending will be higher and revenue lower than the 50-year averages by 0.8 to 1.0 percent of GDP. This wasn't always the case: as recently as 2017, revenue was close to its 50-year average, and as recently as 2018, spending was. However, partially thanks to the Tax Cuts and Jobs Act and Bipartisan Budget Act of 2019, revenue and spending have diverged from their averages.
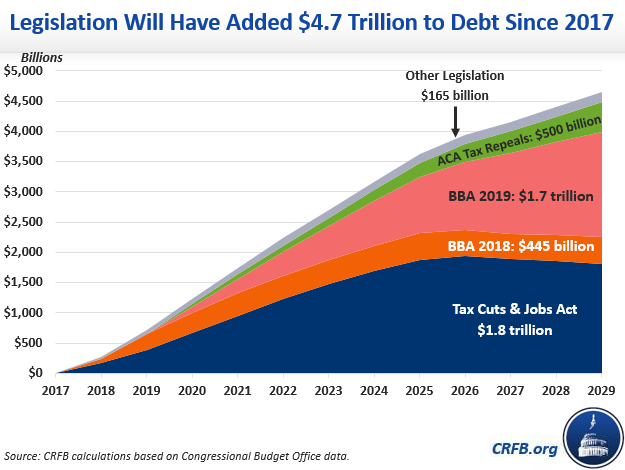
4. Legislation Has Added Over $4.5 Trillion to Our National Debt
This summer, we reported that legislation signed into law by President Trump will add $4.1 trillion to the debt between 2017 and 2029. The single-largest contributor was the Tax Cuts and Jobs Act, which is projected to cost $1.8 trillion through 2029 and could easily cost more if lawmakers extend the individual income tax provisions set to expire at the end of 2025. The Bipartisan Budget Act of 2018 was nearly as costly on an annual basis, adding nearly $450 billion to the debt, and the Bipartisan Budget Act of 2019, which effectively makes the spending increases in BBA18 permanent, adds another $1.7 trillion in debt through 2029.
Since that time, policymakers enacted further tax cuts, including repeals of three ACA taxes, adding another $500 billion to the debt by 2029. Combined with smaller pieces of legislation such as disaster relief, legislation since 2017 will add $4.7 trillion to debt between 2017 and 2029.
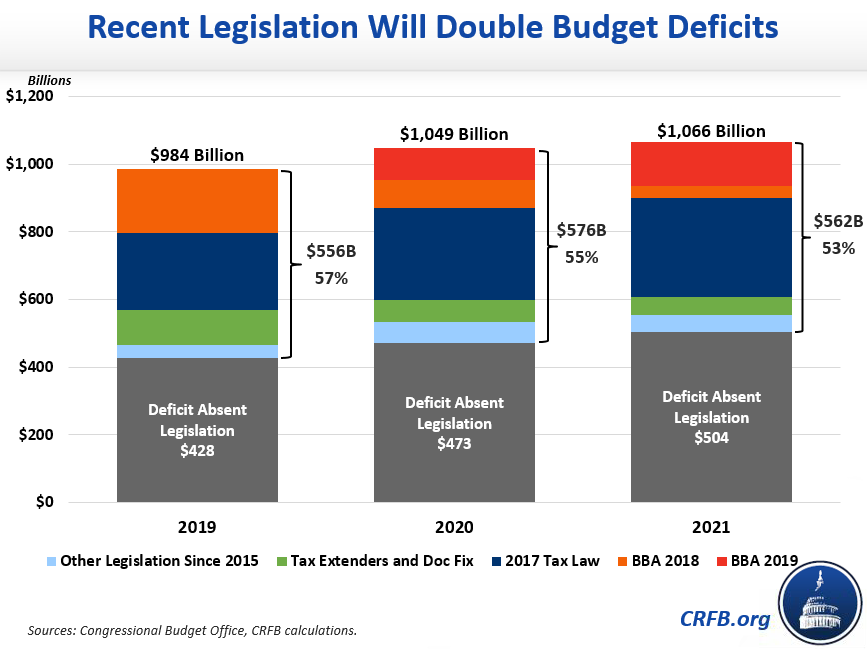
5. Fiscal Irresponsibility Will Double Budget Deficits
The Tax Cuts and Jobs Act, Bipartisan Budget Act of 2018, and other legislation enacted since 2015 are responsible for about 60 percent of the $984 billion budget deficit in FY 2019. The tax law and this year's spending deal (the Bipartisan Budget Act of 2019) are expected to add even more to the deficit in FY 2020 ($272 billion and $98 billion, respectively), pushing it over $1 trillion for the first time since 2012.
6. Fixing the Debt Could Increase Average Income
CBO estimates putting debt on a downward path could increase average income by almost $9,000 per person per year, or about 10 percent as compared to continuing on our current trajectory. According to CBO's Long-Term Budget Outlook, real Gross National Product (GNP) per person – a proxy for income – would total $99,500 in 2049 if debt is reduced to its historic average of 42 percent of GDP. Otherwise, average income would be $97,000 if debt remains stable at 92 percent of GDP, $94,000 if debt rises to 144 percent of GDP in 2049 as projected this summer, and $90,500 if lawmakers extend costly tax cuts in addition to the spending increases they have already extended and increase debt to 219 percent.

7. Social Security is Approaching Insolvency
CBO projects the combined Social Security trust funds will run out of reserves by 2032, at which point all beneficiaries will experience a 24 percent cut in benefits. There are many ways to address the shortfall. The Social Security 2100 Act would enact a set of benefit expansions funded by revenue increases, the Social Security Reform Act of 2016 would cut taxes and slow the growth of benefits, while the Conrad-Lockhart plan would raise revenue and slow the growth of benefits. The recently-introduced TRUST Act would establish bipartisan commissions to make recommendations that would receive a fast-track vote in Congress.

8. Medicare for All Would Be Extremely Costly to Finance
Transitioning the United States to a single-payer health care system with no copays or deductibles would mean shifting virtually all private health care costs to the federal government. Most independent estimates of Medicare for All find it would cost the federal government roughly $30 trillion over the next decade, requiring significant new taxes to replace current premiums and out-of-pocket costs.

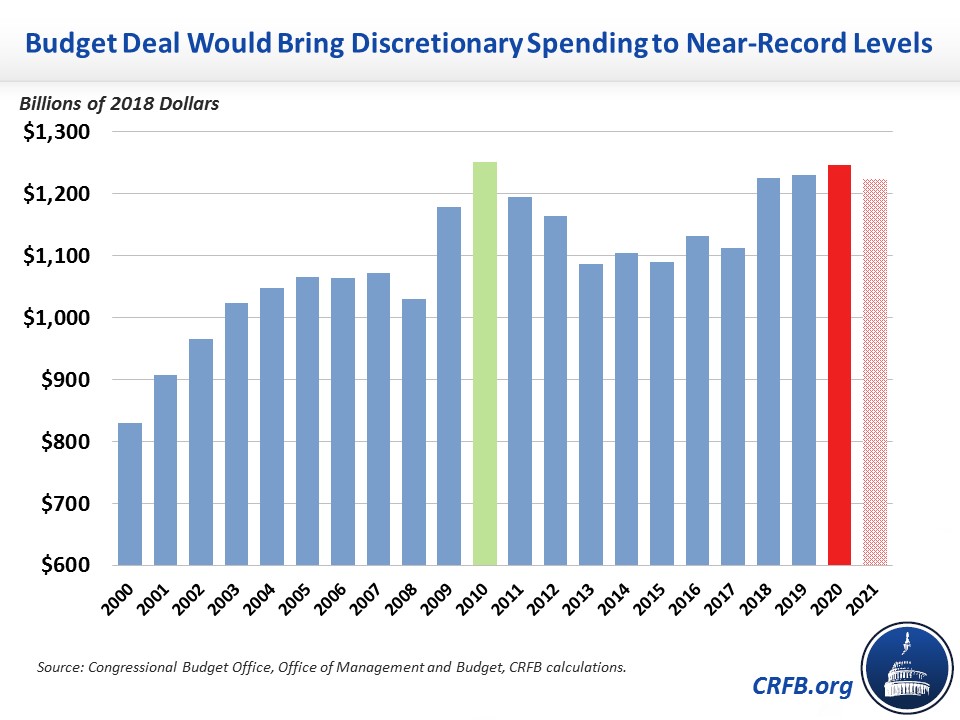
9. The Bipartisan Budget Act of 2019 Increased Discretionary Spending to Near-Record Levels
In inflation-adjusted dollars, the Bipartisan Budget Act of 2019 increased base discretionary spending to approach the record levels set in 2010. Budget agreements in 2018 and 2019 fully repealed the sequester and increased spending further, largely without offsets. Spending caps are set to end entirely after 2021.
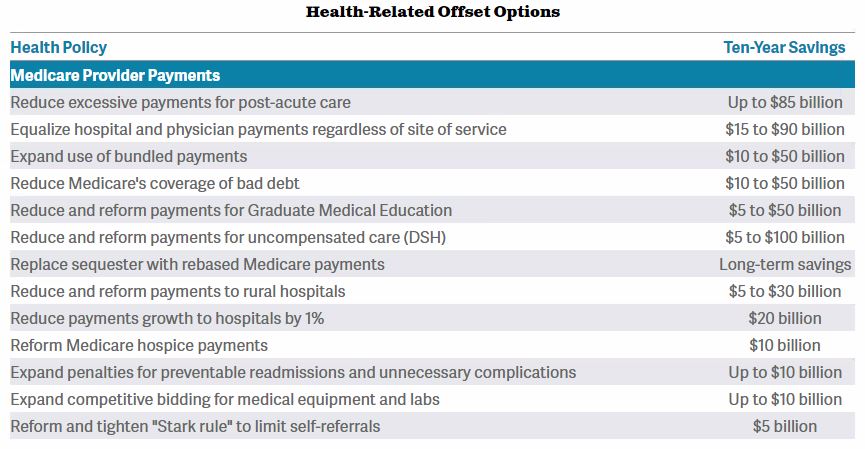
10. Lawmakers Have Many Options to Pay For Their Policies
In October, we debuted our Budget Offsets Bank of options policymakers could take to raise revenue and reduce spending. Our first installment focused on health care policies that reduce the cost of Medicare, Medicaid, or other federal health spending or increase health-related revenue. Our second installment featured infrastructure-related policies. We will be publishing additional options in the coming months. View the full Budget Offsets Bank at crfb.org/offsets or look at a list of our previous proposals that include options here.
****
2019 has been a dramatic year for budget policy, with policymakers this year adding $2.2 trillion to the debt by 2029. We will be continuing our analysis into the new year of both pending legislation and 2020 presidential campaign proposals, advocating for fiscal responsibility in Washington.
Tags
What's Next
-
Image

-

-
Image