Addressing Tax Expenditures Could Raise Substantial Revenue
While the House and Senate each has put forth its own version of the Build Back Better Act reconciliation legislation, the offsets that will be included in the final legislation are still unknown. As negotiations continue, policymakers should consider options that would not only raise revenue but improve the overall structure of the federal tax code. One approach is to address tax expenditures, tax breaks in the federal tax code.
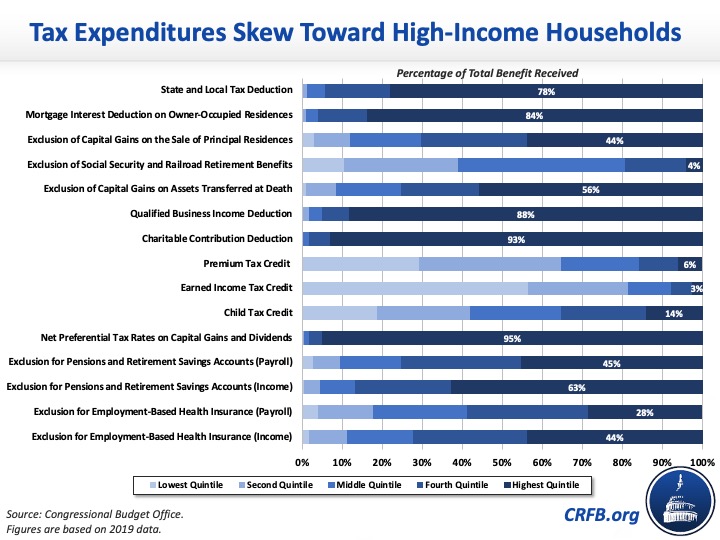
A recent Congressional Budget Office (CBO) analysis estimated the budgetary and distributional effects of the major tax expenditures in 2019 found most tax expenditures to be costly and regressive. The tax expenditures CBO analyzed cost the federal government nearly $1.2 trillion, or 5.8 percent of Gross Domestic Product (GDP), in 2019. This includes $987 billion of individual income tax expenditures and $195 billion of payroll tax expenditures.

The largest tax expenditure CBO estimated was the exclusion for employment-based health insurance, which totaled $280 billion; $159 billion of which was an individual income tax expenditure and $121 billion a payroll tax expenditure. On both the individual and payroll tax sides, the benefits accrued mostly to high-income households since they’re more likely to have access to employment-based health insurance.
Specifically, 89 percent of the individual benefit went to the top 60 percent of households and 11 percent to the bottom 40 percent. Households in the top 1 percent received 2.9 percent of the total benefit. On the payroll tax side, 81 percent of the benefit went to the top 60 percent of households and 18 percent to the bottom 40 percent. Households in the top 1 percent received 0.9 percent of the total benefit (largely because most payroll taxes were only paid on the first $132,900 of income in 2019). Subjecting all or some portion of employer contributions to health insurance to the income and/or payroll tax could help policymakers pay for their reconciliation package.
The second-largest tax expenditure in CBO’s analysis was the exclusion of contributions to certain pension plans and retirement accounts from income and payroll taxes, which totaled $276 billion in 2019; $202 billion of which was an individual tax expenditure and $74 billion a payroll tax expenditure. On both the individual and payroll tax sides, the benefits skewed substantially toward high-income households.
On the individual side, 63 percent of the benefit went to the top 20 percent of income earners (5.3 percent to the top 1 percent), while the bottom 40 percent received less than 5 percent of the total benefit. In that same vein, 45 percent of the payroll tax benefit went to the top 20 percent of households (1.9 percent to the top 1 percent), while the bottom 50 percent received less than 10 percent of the total benefit. Policymakers could scale back this exclusion or eliminate the provision entirely to raise additional revenue.

In 2019, long-term capital gains and dividends were subject to a maximum marginal tax rate of 20 percent for taxable income above $434,550 ($488,850 for couples). At the same time, income above $200,000 ($250,000 for couples) was subject to the 3.8 percent Net Investment Income Tax (NIIT), which offset some of the benefit of the lower tax rates. On net, the tax expenditure totaled $140 billion in 2019 – $174 billion of revenue loss from lower tax rates on long-term capital gains and dividends and $34 billion of revenue gain from the 3.8 percent NIIT. Benefits skewed substantially toward high earners, with 75 percent of the benefit going to households in the top 1 percent of the income distribution.
The current reconciliation legislation would expand the 3.8 percent NIIT to taxpayers that use S corporations and partnership entities to shield themselves from the current NIIT. The Joint Committee on Taxation (JCT) estimates the proposal would raise $250 billion of revenue over ten years, which could further reduce the size of the tax expenditure from preferential tax rates on capital gains and dividends.
In 2019, the Child Tax Credit (CTC) totaled $2,000 per child under age 17, $1,400 of which was refundable. An additional $500 credit was available for older dependent children and relatives. CBO estimates this tax expenditure totaled $118 billion in 2019 and was evenly distributed across the income spectrum. Households in the bottom four income quintiles received between 19 percent and 23 percent of the benefit, while households in the top income quintile received 14 percent (the top 1 percent did not receive any benefit).
For tax year 2021, the American Rescue Plan (ARP) increased the CTC to $3,000 ($3,600 for children under age six) and made the credit fully refundable for lower-income households. The current reconciliation legislation would extend the increased CTC for one year and make the full refundability of the credit permanent at a cost of $185 billion, which would increase the size of the tax expenditure and the benefits it delivers to households across most of the income spectrum.
The Earned Income Tax Credit (EITC) totaled $70 billion in 2019, and its benefits were skewed heavily towards households at the bottom of the income distribution. Eighty-one percent of the benefit was received by the bottom 40 percent of households, and the top 1 percent received only 0.1 percent of benefits. For tax year 2021, the ARP increased the maximum EITC for workers without children to about $1,500 and raised the income cap to qualify from roughly $16,000 to $21,000. It also expanded the pool of eligible workers without children to include adults aged 19 to 25 and people aged 65 and over. The current reconciliation legislation proposes to extend the expanded EITC for one year at a cost of $15 billion, which would increase the size of the tax expenditure and the benefit it provides to households, particularly at the bottom of the income spectrum.
CBO estimated that Affordable Care Act (ACA) premium tax credits totaled $53 billion in 2019 and provided 84 percent of the total benefit to the bottom 60 percent of households. The ARP increased the amount of the credit for those who are eligible through 2022 and made individuals with income above 400 percent of the Federal Poverty Line (FPL) eligible for them. The Build Back Better reconciliation legislation would extend the enhanced ACA subsidies through 2025 and make them available to eligible people in Medicaid coverage gap states at a cost of $130 billion, which would increase the size of the tax expenditure.
The tax expenditure from the stepped-up basis loophole for assets transferred at death totaled $39 billion in 2019, and 56 percent of its benefits went to the top 20 percent of households, including 18 percent to the top 1 percent. While the current reconciliation legislation does not include measures to close this loophole, President Biden has proposed closing the loophole and addressing stepped-up basis in general has broad support. In a previous analysis, we showed that the loophole’s benefits skew towards high-income earners, and addressing it would improve fairness and efficiency in the tax code and could generate between $110 billion and $322 billion of revenue over a decade.
Under current law, the State and Local Tax (SALT) deduction is subject to a $10,000 cap through 2025. CBO estimated this tax expenditure totaled $22 billion in 2019 and that 94 percent of the total benefit went to the top 40 percent of income earners (38 percent to the top 5 percent and 11 percent to the top 1 percent). The current reconciliation legislation proposes to increase the SALT deduction cap to $80,000 through 2030 and then lower the cap to $10,000 in 2031. As we've shown before, any kind of SALT cap relief is costly, and the benefits would skew disproportionately to high-income households. The benefits would be even more skewed to high earners if the cap were eliminated or allowed to expire after 2025.
The remaining tax expenditures CBO examined included the charitable contributions deduction ($43 billion), the qualified business income deduction ($41 billion), exclusions of Social Security and retirement benefits ($37 billion) and the capital gains on the sale of principal residences ($35 billion), as well as the mortgage interest deduction ($28 billion). The benefits of these tax expenditures skewed more toward high-income households, and they could potentially be rolled back or eliminated all together to generate additional revenue to offset the Build Back Better Act.
Importantly, CBO’s analysis examined the budgetary and distributional effects of tax expenditures in 2019; therefore, its results do not account for the economic downturn stemming from the COVID-19 pandemic and the subsequent policy response. In addition, CBO’s estimates do not reflect the revenue that would be raised if the provisions of the tax code that create tax expenditures were eliminated because they do not account for the changes in taxpayers' behavior that would result from tax expenditure changes.
Nevertheless, there is still a lot of potential to raise revenue and produce fairer tax policy with reforms to tax expenditures.
Read more options and analyses on our Reconciliation Resources page.


