Risks and Threats from Deficits and Debt
After two decades of uninterrupted borrowing – including three years in which deficits surpassed 10 percent of the economy – the U.S. national debt is higher as a share of Gross Domestic Product (GDP) than at any time since World War II and is on course to breach that record. Yet policymakers have done little to contain our $24 trillion national debt, and most legislation has added to it in recent years. Additionally, there have been numerous claims that “debt doesn’t matter” and the United States should borrow even more than the $16 trillion it is projected to borrow over the coming decade. These claims are problematic and concerning.
This does not mean there is no proper time to borrow. In fact, deficit spending helped to prevent an economic catastrophe and support the country through a pandemic in the recent COVID-19 crisis. However, even this justified borrowing comes with some consequence, and much of the recent borrowing before and since the COVID crisis was enacted for political rather than purely economic justification.
Excessively high debt levels are damaging for many reasons. High debt levels:
- Threaten economic vitality: The recent surge in deficit spending has contributed to rapid near-term inflation and over time will result in higher interest rates, slower economic and income growth, and a small but increased risk of fiscal crisis.
- Place a strain on the budget: The federal government currently spends as much on interest payments as it does on most of our safety net programs combined, and interest is projected to become the largest government expenditure within the next 30 years. As interest and mandatory spending dominate a greater share of the budget, our government’s ability to invest in new priorities will be limited.
- Create geopolitical challenges and risks: With large portions of our debt held by foreign investors, a substantial share of our national income goes abroad. We are consequentially left with fewer financial tools to manage conflicts with other countries when they have increased leverage over our economy.
- Make responding to new emergencies more challenging: High deficits and debt – particularly if coupled with high inflation or interest rates – make it harder to borrow in response to a recession, pandemic, war, or other legitimate emergency.
- Are unfair to younger and future generations: The federal budget already favors consumption on seniors over investment in children. Failing to address rising debt also leaves future generations with an additional fiscal and economic burden.
Given these very real threats and risks, policymakers should pursue the appropriate tax and spending adjustments to bring the fiscal situation under control.
The Economic Consequences of Deficits and Debt
High and rising debt creates near-term and long-term economic consequences, some of which are playing out in real time through high inflation.
In response to the COVID-19 pandemic and economic crisis, policymakers injected more than $5 trillion of fiscal support into the economy. Deficits ballooned from just under $1 trillion in 2019 to an average of $3 trillion per year over the subsequent two years.
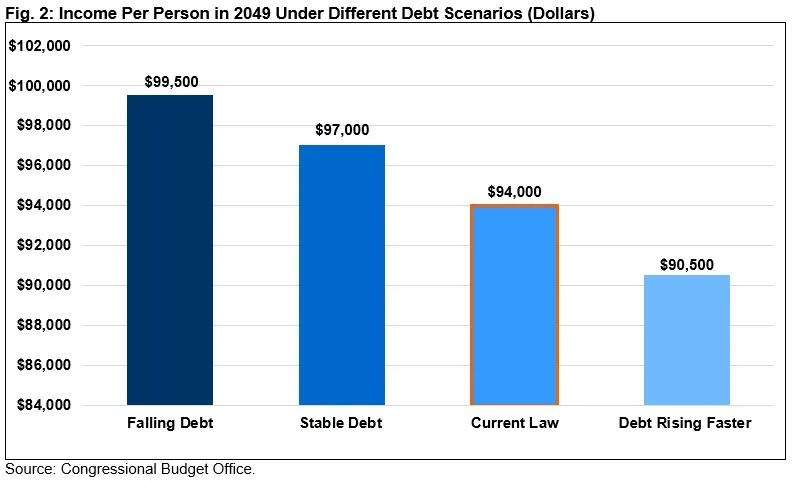
CBO found that growing debt would result in per-person income being $9,000 lower – or a 10 percent reduction – compared to declining debt.
Much of this borrowing was important for supporting households, securing balance sheets, limiting the depth of the recession, and supporting the economic recovery. However, the total magnitude of fiscal support – particularly support enacted in 2021 – greatly exceeded the needs or capacity of the economy.1 The resulting excess demand has contributed to inflation.
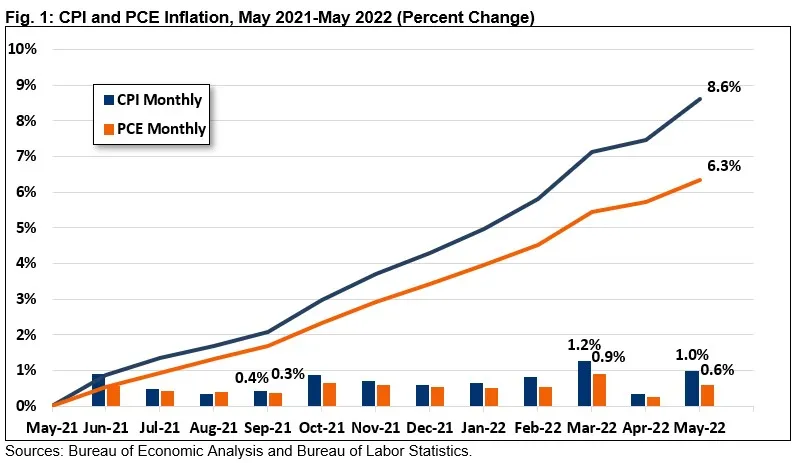
The Federal Reserve normally aims for 2 percent inflation as measured by the Personal Consumption Expenditure (PCE) index, the equivalent of roughly 2.3 percent in the Consumer Price Index (CPI). Over the past year, the PCE index has risen by 6.3 percent; economists have attributed 2 to 4 percentage points of this rate to the $1.9 trillion American Rescue Plan alone.2 CPI inflation has totaled 8.6 percent, the highest in four decades.
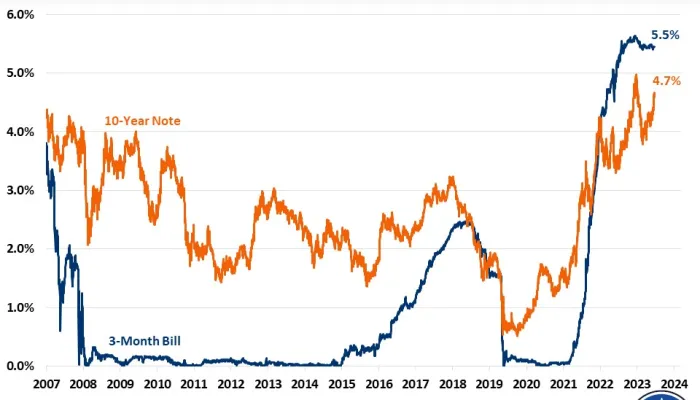
In response to rising inflation, the Federal Reserve has begun aggressively raising the federal funds interest rate, which reverberates throughout the economy. Similarly, investors generally respond to higher levels of debt issuance by demanding higher rates on Treasury bonds.
|
Box 1: Modern Monetary Theory and the National Debt Over the past few years, Modern Monetary Theory (MMT) – a fringe economic theory that argues the government can, should, and effectively does print money to finance deficits – has gained growing prominence. The basic idea behind MMT is that fiscal policy, rather than monetary policy, should manage the macroeconomy and that there is no reason to worry about debt sustainability. Instead, the theory states, deficit spending should continue until the point that the economy is at capacity and substantial inflation emerges. While MMT is appealing as a political excuse to brush aside the tradeoffs involved in budgeting, it makes little sense either in theory or in practice.3 On the theoretical side, MMT rightly recognizes that economies that borrow and print in their own currency can never be forced into default, but it misunderstands the relationship between borrowing, interest rates, demand, investment, and economic growth. For example, some MMT advocates have theorized that higher interest rates could boost demand for goods and services rather than crowd out investment.4 On the practical side, MMT implicitly relies on Congress and the President to substantially raise taxes or cut spending – without help from the Federal Reserve – in order to fight bouts of inflation. There is little evidence of willingness to enact large abrupt tax increases or spending cuts in periods of high inflation.5 In fact, advocates of MMT have offered virtually no fiscal solutions to recent inflation, and in many cases, they have suggested further fiscal expansions.6 MMT has widely been panned by economists on the left and right, ranging from Paul Krugman to John Cochrane.7 Its proponents often articulate a contradictory framework that doesn’t withstand even the most basic scrutiny.8 While MMT does help explain some basic insights about the constraints of an economy’s productive capacity and the technical ability of a government to borrow, it is of little use in understanding how to analyze or manage an economy or government budget. |
A 2019 study by Congressional Budget Office (CBO) economists Edward Gamber and John Seliski found that every 10 percent increase in the debt-to-GDP ratio translates into a 0.2 to 0.3 percentage point increase in interest rates.9 Research from Ernie Tedeschi and Lukasz Rachel & Lawrence Summers reaches similar conclusions.10 These studies show that while many factors have reduced interest rates, high debt has increased them.
Higher interest rates on federal debt and bank reserves increase interest rates throughout the economy on everything from mortgages to student loans to credit cards. They also contribute to a phenomenon called “crowd out,” where investors purchase government bonds instead of investing in the private sector, thus slowing economic growth.
CBO estimates that for every $1 of new U.S. government borrowing, total investment falls by 33 cents and an additional 24 cents of the return to investments goes abroad, resulting in slowing income growth over time.11
In 2019, CBO compared national income if debt were allowed to rise rapidly, as in their alternative fiscal scenario, to a scenario where debt returned to historic levels as a share of the economy.12 After three decades, CBO found that growing debt would result in per-person income being $9,000 lower – or a 10 percent reduction – compared to declining debt.
In a worst-case scenario, high and rising debt could even spur a fiscal crisis. In this case, loss of market confidence could quickly drive up interest rates or inflation expectations, devaluing existing bonds and causing severe global financial disruptions. The likelihood of such a crisis is low in a country like the United States, but it rises as the debt grows relative to the economy.
The Budgetary Consequences of Debt
A high and rising national debt requires growing government interest payments to service it. Each dollar spent on interest is a dollar unavailable to spend on other priorities or lower taxes.
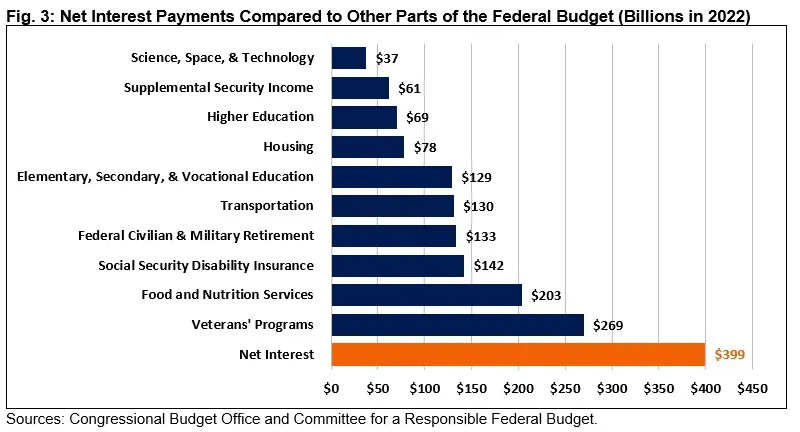
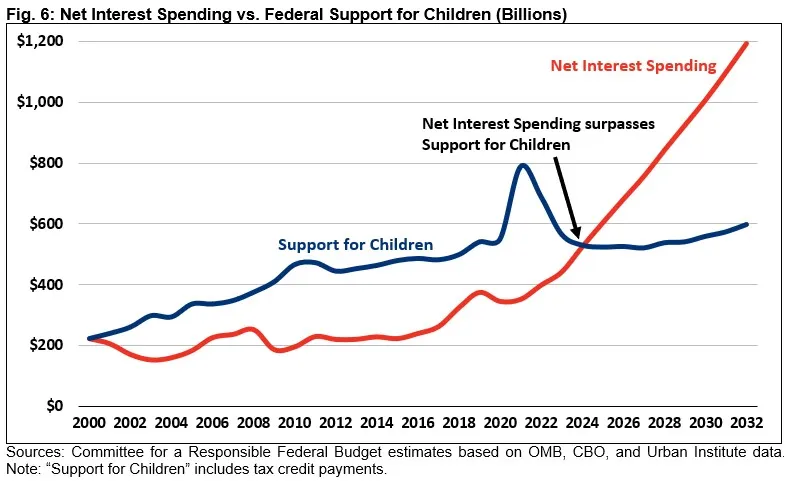
Already, the federal government spends $400 billion on net interest expenses. That’s twice what it spends on food and nutrition, three times what it spends on transportation, and nearly six times what it spends on higher education. It also spends more on interest than it normally spends on total education and training or on nondefense research and infrastructure.13
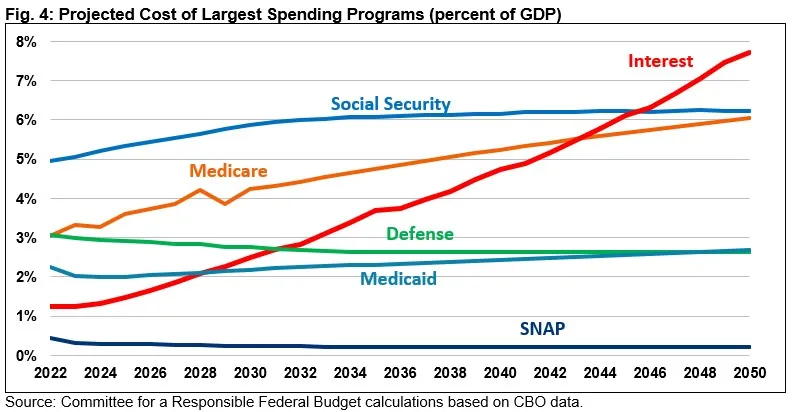
By the end of the decade, CBO projects interest costs will total $1.2 trillion, or 3.3 percent of GDP.14 That’s higher than any other time in history, including during World War II or when interest costs last peaked in the early 1990s. Within 30 years, interest is on course to be the single largest government program – larger than Social Security, Medicare, or defense.
If interest rates are 1 percentage point above projections, interest payments would rise $2.4 trillion over the next decade to well over $10 trillion between 2023 and 2032.
Illustrated another way, interest costs currently equal 8 percent of total revenue – about what is normally collected by the corporate income tax. Within a decade, interest costs will require 18 percent of revenue, and by 2050 they will require 35 percent of revenue – about what is raised by the corporate income tax and payroll taxes combined.15
CBO’s latest baseline estimates interest payments will exceed $8 trillion over the next decade.16 Rising interest rates could balloon these costs. For example, if interest rates are 1 percentage point above projections, interest payments would rise $2.4 trillion over the next decade to well over $10 trillion between 2023 and 2032; under this scenario, interest costs would reach a record 4.4 percent of GDP by 2032.17
|
Box 2: Interest Costs Matter While federal interest spending is high and rising, interest rates remain below the inflation rate and are projected to remain below the nominal economic growth rate for some time. Some economists have argued these interest costs present little threat so long as the economic growth rate exceeds the inflation rate or real interest costs as a share of GDP remain sufficiently low.18 However, these arguments fail to appreciate that nominal interest costs still compete against nominal spending and revenue for nominal resources. Further, they implicitly presume that primary deficits (deficits excluding interest) are low or falling – in which case low interest rates would be sufficient to assure a declining debt-to-GDP ratio. However, primary deficits are high and rising in the United States, which means debt can and will continue to rise as a share of GDP even with interest rates below the economic growth or inflation rate. Interest rates can also increase abruptly, leaving policymakers little opportunity to lower debt in response to an interest rate spike. That interest rates are lower than the growth rate today does not assure they will remain below the growth rate in the coming years. Moreover, because higher debt pushes interest rates up and the growth rate down, efforts to exploit the difference between the growth and interest rate may prove self-defeating. |
Geopolitical Challenges and Risks from High Debt
In 2016, a bipartisan group of some the nation’s foremost national security figures, led by former Chairman of the Joint Chiefs of Staff Mike Mullen, declared “long-term debt is the single greatest threat to our national security.”19 High debt not only crowds out resources that strengthen our security, but it also narrows our tools for dealing with unfriendly nations, leaves our economy more vulnerable to actions of other countries, and weakens our global standing and prestige.
China holds over $1 trillion of U.S. debt – 14 percent of all foreign-held debt.
As of December 2021, foreign governments and individuals held $7.7 trillion of U.S. debt – about one-third of total debt held by the public and 44 percent of debt held outside of the Federal Reserve. Much of this debt is held by close allies to the United States, such as Japan and the United Kingdom. However, China holds over $1 trillion of U.S. debt – 14 percent of all foreign-held debt.
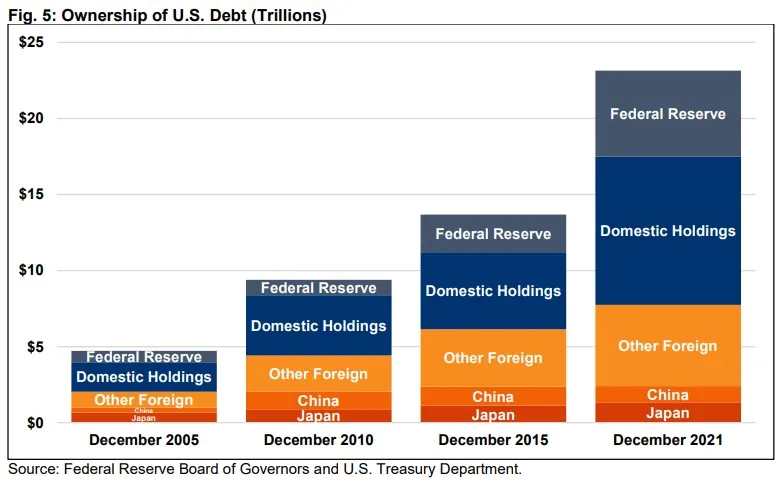
The more federal debt that is held abroad, the larger the share of our national income and growth that accrues to those living in other countries rather than to American households. More foreign-held debt also leaves us with less control over financial markets.
The Russian invasion of Ukraine has highlighted how the global marketplace for sovereign debt has created new vulnerabilities, as countries around the world have frozen Russia’s access to sovereign debt markets. While it is hard to imagine any comparable situation with the United States, this shows how foreign actors can leverage ownership of debt against one another. On a much smaller scale, China may be able to leverage its holdings to create problems in the U.S. Treasury markets.
Higher debt also leaves the United States with fewer tools to leverage its holdings against other countries. Additionally, our high debt means a larger share of our national income is paid to individuals and governments abroad. And being one of the only rich countries without a plan to put its fiscal house is order weakens America’s global standing and soft power.
By funding our priorities through borrowing rather than fiscal discipline, the United States exposes itself to more geopolitical threats than it would without high debt.
|
Box 3: Can the Federal Reserve Buy All of Our Debt? The COVID-19 crisis caused the Federal Reserve to rapidly increase its holdings of U.S. Treasuries, rising from about $2.4 trillion in January 2020 to nearly $5.8 trillion at its peak in June 2022.20 In other words, the Fed effectively bought half of the federal debt issued over the same period. This kind of expansion in the Fed’s balance sheet was unprecedented, and its long-term effects are uncertain. But it is clear that these purchases do not eliminate the cost of issuing debt, nor can they be continued indefinitely without leading to high inflation or other consequences.21 When the Fed purchases Treasury debt, it finances that purchase by creating interest-bearing bank reserves. Except when the Fed is paying a 0 percent interest rate, this means the Fed is effectively swapping one type of government debt (Treasury bonds) for another (reserves). By boosting the money supply and putting downward pressure on long-term interest rates in the economy, it is also very likely that the Fed’s purchases of Treasuries and mortgage-backed securities are contributing to the high inflation we see today. While Fed debt purchases were helpful to support the economy and financial markets during the COVID recession, there is no free lunch. The Federal Open Market Committee has committed to reducing the size of the Fed’s balance sheet over the coming months and years as part of its efforts to control inflation.22 As they do, it will become more clear what repercussions could arise from these large asset transactions. |
Reduced Ability to Respond to Emergencies
While large deficits are undesirable in normal times, they are often necessary in times of emergency. Government borrowing during a war, pandemic, or similar crisis can allow adequate funding for an acute need while spreading the costs over time. In the case of a recession or economic downturn, borrowing can also boost demand, minimize employment losses, and help to support a faster and stronger recovery. Countries must therefore have adequate fiscal space to allow for borrowing in times of need.
There has clearly been such a need three times this century – after the terrorist attacks on September 11, 2001, amidst the global financial crisis that began in 2008, and in response to the COVID-19 pandemic and economic downturn. In each case, the United States responded swiftly, dedicating trillions of dollars of resources to address the crisis and support the overall economy.
While the responses were necessary and helpful in the immediate situation, they also had a substantial impact on the budget. The response to the 2001 terrorist attacks helped end an era of balanced budgets, the global financial crisis and response boosted debt from 40 percent of GDP to 70 percent, and the response to the COVID-19 pandemic further boosted debt from 80 percent of GDP to 100 percent.
It is not clear such aggressive actions would have been possible, desirable, or effective – politically or economically – with substantially higher levels of deficits and debt, particularly if high deficits and debt were accompanied by high inflation and/or interest rates.
In fact, a 2019 study by Christina Romer and David Romer found that countries that enter crises with high debt levels face both political and financial constraints to borrowing, and as a result they tend to do less to combat the crisis and thus recover more slowly.23 Countries that ignore these potential constraints could face adverse consequences.
One need only look to 2021 to find an example of this situation. The $1.9 trillion American Rescue Plan likely would have had a much larger “fiscal multiplier” and contributed much less to inflation had it been enacted on its own as opposed to layered on top of recent deficit-boosting efforts. The nation’s recent experience with inflation might also make policymakers more hesitant to borrow in the future absent a plan to improve the nation’s fiscal and inflationary outlook.
Unfortunately, fiscal space may wane in the coming decades because of rising health, retirement, and interest costs. There is great uncertainty over how long the United States will have the willingness or capacity to enact the type of response we witnessed over the last two years.
The last two years have highlighted the need to be proactive and prepared for future challenges, threats, and potential crises. Romer and Romer recommend countries reduce their debt during good times to create more fiscal space for the bad ones.24 As President John F. Kennedy said in his 1962 State of the Union address, “the time to repair the roof is when the sun is shining.”25
Growing Intergenerational Imbalances
The federal budget is skewed heavily in favor of adults and seniors over children as well as today’s consumption over investments in tomorrow. A rising national debt worsens these generational imbalances by burdening younger and future generations with higher interest payments, slower income growth, and greater financial responsibility for shouldering any ultimate tax or spending adjustments.
The federal government spends roughly $6 per senior for every $1 per child.
This situation is borne out by the composition of federal spending. Currently, the federal government spends roughly $6 per senior for every $1 per child. The two largest federal programs, Social Security and Medicare, mostly benefit the elderly. Meanwhile, total spending and tax breaks for children – including for education, nutrition, tax credits, health care, and other purposes – made up just 9 percent of the budget prior to the pandemic. By 2032, they will make up only 7 percent of the budget.
A similar situation can be seen when comparing consumption and investment. Prior to the pandemic, only 7.6 percent of the budget went toward nondefense federal investments in education, research, and infrastructure. The rest mainly went to support current consumption, and multiple rounds of tax cuts further supported this consumption.
Children and investments are disadvantaged through the budget process itself. Compared to consumption programs for adults, spending on children and investments is more likely to be temporary and capped and less likely to enjoy fast built-in growth or dedicated revenue.26
|
Box 4: Neither Tax Cuts nor Investments Pay for Themselves Both thoughtful tax reform and smart public investments can help improve economic growth by promoting work and investment, building productive capacity, boosting output, and raising incomes. However, any benefit from enacting these types of policies is negated when they are financed with higher deficits. In the past, we have estimated that every $1 of tax cuts would need to generate $4 to $6 of economic growth in order to be self-financing – far in excess of what any model or past experience predicts.27 For example, CBO estimated that the 2017 tax law would only generate enough economic growth to offset about one-fifth of its increase in deficits.28 Likewise, the Joint Committee on Taxation estimated at the time of its passage that the 2017 tax law would generate a little over one-quarter of its cost in economic feedback.29 Similarly, federal investments in education, research, and infrastructure would need to be even more productive in order to pay for themselves. We estimate that a government investment would need to generate as much as an 8-to-1 return to raise enough revenue to equal its cost.30 Using CBO’s estimates of the 2021 bipartisan infrastructure law, we estimated that just 2 percent of the gross costs would be returned in dynamic feedback – nowhere near the kind of return necessary to offset its costs.31 |
Burdening children with increasing levels of debt makes a bad situation worse. A child born today will effectively inherit more than $71,000 of debt upon birth, growing to $180,000 by the time they turn 18. They will effectively service that debt through lower wages, higher future taxes, lower future spending, and an increasing share of their tax dollars paying interest to cover past consumption.
Simply put, high and rising leaves a burden to future generations.
Conclusion
The national debt is nearing its all-time high of 106 percent of GDP and will likely exceed that level in the near future. The reasons for why this is concerning have not changed much over the past few years, but the challenge has become even more daunting.
Before the pandemic, we warned that sustainability of our national debt should be dealt with over the medium run to prevent its rise over the long run. Unfortunately, the pandemic and response hastened that timeline, leading to rapid near-term inflation and an even higher national debt.
Despite claims to the contrary, borrowing is not free, and the national debt cannot be indefinitely ignored. High and rising deficits and debt can lead to persistently high inflation, rising interest rates, slower economic growth, increased interest payments, reduced fiscal space, greater geopolitical risk, and growing generational imbalances.
Fortunately, none of these consequences are inevitable. Policymakers can put the country on a more sustainable fiscal trajectory by prioritizing within the budget and tax code. This will require slower spending growth and higher revenue than we have today, but it can be achieved while preserving the important functions of government and maintaining a competitive tax code.
To begin the process of fixing our debt, policymakers must first acknowledge it is a problem. Debt matters. We owe it to ourselves and future generations to begin solving this problem now.
******
Appendix I – Savings Needed to Reach Select Fiscal Goals
One way to measure fiscal sustainability is in terms of how much total deficit reduction would be required to meet a given fiscal goal. While there is not one best goal, there are several measures – especially in the context of the current fiscal situation – that would represent a positive improvement. Below are a few select fiscal goals that policymakers could target in 2032 along with the ten-year savings required to meet them.
| Fiscal Goal for 2032 | Ten-Year Savings (2023-2032) |
|---|---|
| Stabilize debt at 100% of GDP | $3.5 trillion |
| Reduce debt to 90% of GDP | $7.2 trillion |
| Reduce debt to 80% of GDP | $10.9 trillion |
| Stabilize deficits at $1 trillion per year | $6.0 trillion |
| Reduce deficit to 3% of GDP | $6.5 trillion |
| Achieve primary (non-interest) balance | $7.5 trillion |
| Achieve “on-budget” balance (excludes Social Security & USPS) | $10.0 trillion |
| Achieve full budget balance | $11.5 trillion |
Sources: Committee for a Responsible Federal Budget estimates based on Congressional Budget Office data.
Appendix II – Select Policies for Deficit Reduction
Policymakers would need to enact substantial deficit reduction to put the debt on a downward path as a share of the economy. Below is a short list of select options that could help reduce the deficit, along with deficit reduction savings from 2023 through 2032.
| Policy | Ten-Year Savings |
|---|---|
| Freeze appropriations at FY 2022 levels for two years | ~$1 trillion |
| Adopt chained CPI for all measures of inflation | ~$400 billion |
| Reduce drug costs through negotiations and inflation caps | $200 to $500 billion |
| Reduce Medicare Advantage coding intensity overpayment | $100 to $400 billion |
| Equalize Medicare payments for similar treatments | $50 to $300 billion |
| Raise Social Security and Medicare retirement ages | ~$200 billion |
| Adopt a carbon tax on greenhouse gas emissions | $1 to $2 trillion |
| Repeal state and local tax deduction | $300 billion to $1 trillion* |
| Impose 5 percent surtax on income above $500k/$1m | ~$500 billion |
| Raise corporate income tax to 25 percent | ~$400 billion |
| Reduce tax gap through IRS funding and information reporting | $100 to $400 billion |
Sources: Committee for a Responsible Federal Budget estimates based on various sources. *$300 billion estimate assumes the current $10,000 cap is extended beyond its 2026 expiration.
1 Committee for a Responsible Federal Budget, “How Much Would the American Rescue Plan Overshoot the Output Gap?”, February 3, 2021, https://www.crfb.org/blogs/how-much-would-american-rescue-plan-overshoot-output-gap.
2 See Michael Strain, “Yes, the Biden stimulus made inflation worse,” American Enterprise Institute, February 10, 2022, https://www.aei.org/op-eds/yes-the-biden-stimulus-made-inflation-worse/; Òscar Jordà, Celeste Liu, Fernanda Nechio, and Fabián Rivera-Reyes, “Why Is U.S. Inflation Higher than in Other Countries?” Federal Reserve Bank of San Francisco, March 28, 2022, https://www.frbsf.org/economic-research/publications/economic-letter/2022/march/why-is-us-inflation-higher-than-in-other-countries/; Chris Megerian and Zeke Miller, “Biden relief plan: Major victory gets mixed one-year reviews,” Associated Press, March 11, 2022, https://apnews.com/article/biden-covid-business-health-congress-310542ef5cddc914104960a00ae356e0; and Dean Baker, “Yet More on Inflation,” Center for Economic and Policy Research, March 3, 2022, https://cepr.net/yet-more-on-inflation/.
3 Eric Leeper, “Modern Monetary Theory: The End of Policy Norms As We Know Them?” Progressive Policy Institute, February 7, 2022, https://www.progressivepolicy.org/publication/modern-monetary-theory-the-end-of-policy-norms-as-we-know-them/.
4 Stephanie Kelton, “Paul Krugman Asked Me About Modern Monetary Theory. Here Are 4 Answers.” Bloomberg, March 1, 2019, https://www.bloomberg.com/opinion/articles/2019-03-01/paul-krugman-s-four-questions-about-mmt.
5 Policymakers are currently considering some modest deficit reduction. But very little would take place over the next year, and other legislation and executive actions have increased deficits by more than this legislation would reduce them.
6 See remarks by Stephanie Kelton at “The Road Ahead: The Impact of the National Debt On America’s Economy,” Milken Institute, May 3, 2022, available at https://milkeninstitute.org/video/national-debt-america-economy.
7 Committee for a Responsible Federal Budget, “The Facts on Modern Monetary Theory (MMT),” April 1, 2019, https://www.crfb.org/sites/default/files/MMT%20Readings.pdf; and John H. Cochrane, “’The Deficit Myth’ Review: Years of Magical Thinking,” The Wall Street Journal, June 5, 2020, https://www.wsj.com/articles/the-deficit-myth-review-years-of-magical-t….
8 Lawrence H. Summers, “The Left’s Embrace of Modern Monetary Theory is a Recipe for Disaster,” The Washington Post, March 4, 2019, https://www.washingtonpost.com/opinions/the-lefts-embrace-of-modern-monetary-theory-is-a-recipe-for-disaster/2019/03/04/6ad88eec-3ea4-11e9-9361-301ffb5bd5e6_story.html; and Noah Smith, “MMT and the Meme-ification of Macro,” November 27, 2020, https://noahpinion.substack.com/p/mmt-and-the-meme-ification-of-macro.
9 Edward Gamber and John Seliski, “The Effect of Government Debt on Interest Rates: Working Paper 2019-01,” Congressional Budget Office, March 14, 2019, https://www.cbo.gov/publication/55018.
10 Ernie Tedeschi, “Deficits Are Raising Interest Rates. But Other Factors are Lowering Them.”, Medium, February 19, 2019, https://medium.com/bonothesauro/deficits-are-raising-interest-rates-but-other-factors-are-lowering-them-6d1e68776b7a; and Lukasz Rachel and Lawrence H. Summers, “Public boost and private drag: government policy and the equilibrium real interest rate in advanced economies,” Brookings Papers on Economic Activity, Spring, 1-76, https://www.brookings.edu/bpea-articles/on-falling-neutral-real-rates-fiscal-policy-and-the-risk-of-secular-stagnation/.
11 Jonathan Huntley, “The Long-Run Effects of Federal Budget Deficits on National Saving and Private Domestic Investment: Working Paper 2014-02,” Congressional Budget Office, February 28, 2014, https://www.cbo.gov/publication/45140.
12 Congressional Budget Office, “The Impact of Various Levels of Federal Debt on GNP and GNP per Capita,” August 12, 2019, https://www.cbo.gov/publication/55543.
13 In FY 2021, the federal government spent $352 billion on interest on the debt. By FY 2023, after most COVID relief has ended, OMB projects the government will spend $86 billion on nondefense research and $205.5 billion on nondefense physical infrastructure (including through grants to states and local governments). See Budget of the U.S. Government: Fiscal Year 2023, The White House Office of Management and Budget, https://www.govinfo.gov/app/collection/budget/2023/BUDGET-2023-BUD.
14 Congressional Budget Office, “The Budget and Economic Outlook: 2022 to 2032,” May 25, 2022, https://www.cbo.gov/publication/57950.
15 Ibid.
16 Ibid.
17 Committee for a Responsible Federal Budget, “What Would Higher Interest Rates Mean for the Debt?” June 14, 2022, https://www.crfb.org/blogs/what-would-higher-interest-rates-mean-debt.
18 See Olivier Blanchard, “Public Debt and Low Interest Rates,” American Economic Review, 109 (4): 1197-1229, https://www.aeaweb.org/articles?id=10.1257/aer.109.4.1197; and Jason Furman and Lawrence Summers, “A Reconsideration of Fiscal Policy in the Era of Low Interest Rates,” November 30, 2020, https://www.brookings.edu/wp-content/uploads/2020/11/furman-summers-fiscal-reconsideration-discussion-draft.pdf.
19 Admiral Michael G. Mullen, Madeleine K. Albright, James A. Baker, III, Zbigniew Brzezinski, Michael Chertoff, Robert M. Gates, Stephen Hadley, Chuck Hagel, Lee Hamilton, Michael Hayden, Dr. Henry A. Kissinger, Janet Napolitano, Sam Nunn, Paul O’Neill, Leon Panetta, Henry M. Paulson, Jr., Tom Ridge, LTG Brent Scowcroft, George Shultz, Paul Volcker, John Warner, and Robert Zoellick, “Strength at Home and Abroad: Ensuring America’s Fiscal and National Security,” Coalition for Fiscal and National Security, May 10, 2016, https://www.pgpf.org/pgpf-programs-and-projects/2016-cfns-statement.
20 Board of Governors of the Federal Reserve System, Assets: Securities Held Outright: U.S. Treasury Securities: All: Wednesday Level [TREAST], retrieved from FRED, Federal Reserve Bank of St. Louis, https://fred.stlouisfed.org/series/TREAST.
21 Committee for a Responsible Federal Budget, “Debunking Debt Myths in the COVID Economy,” June 9, 2020, https://www.crfb.org/papers/debunking-debt-myths-covid-economy.
22 Board of Governors of the Federal Reserve System, “Federal Reserve Issues FOMC Statement,” March 16, 2022, https://www.federalreserve.gov/newsevents/pressreleases/monetary20220316a.htm.
23 Christina D. Romer and David H. Romer, “Fiscal Space and the Aftermath of Financial Crises: How It Matters and Why,” Brookings Papers on Economic Activity, Spring, 239-331, https://www.brookings.edu/bpea-articles/fiscal-space-and-the-aftermath-of-financial-crises-how-it-matters-and-why/.
24 Ibid.
25 President John F. Kennedy, “Annual Message to the Congress on the State of the Union,” January 11, 1962, https://www.jfklibrary.org/asset-viewer/archives/JFKPOF/037/JFKPOF-037-003.
26 Committee for a Responsible Federal Budget, “Budgeting for the Next Generation: Does the Budget Process Prioritize Children?” August 16, 2018, https://www.crfb.org/papers/budgeting-next-generation-does-budget-process-prioritize-children.
27 Committee for a Responsible Federal Budget, “Tax Cuts Don’t Pay for Themselves,” October 4, 2017, https://www.crfb.org/papers/tax-cuts-dont-pay-themselves.
28 Congressional Budget Office, “The Budget and Economic Outlook: 2018 to 2028,” April 9, 2018, https://www.cbo.gov/publication/53651.
29 Joint Committee on Taxation, “Macroeconomic Analysis of the Conference Agreement for H.R. 1, The Tax Cuts and Jobs Act,” December 22, 2017, https://www.jct.gov/publications/2017/jcx-69-17/.
30 Committee for a Responsible Federal Budget, “Five Reasons to Pay for New Investments,” July 20, 2021, https://www.crfb.org/papers/five-reasons-pay-new-investments.
31 Committee for a Responsible Federal Budget, “CBO Report Shows Infrastructure is More Pro-Growth When It’s Paid For,” August 6, 2021, https://www.crfb.org/blogs/cbo-report-shows-infrastructure-more-pro-growth-when-its-paid.
Tags
What's Next
-
Image
-
Image
-
