Our Top Fiscal Charts of 2018
The year 2018 was a busy time for budget policy, which gave us plenty of opportunities for analysis via tables and graphs. We published over 250 blogs, papers, and other products. As we get ready to pop the champagne and ring in the new year, here are our top charts of (calendar year) 2018.
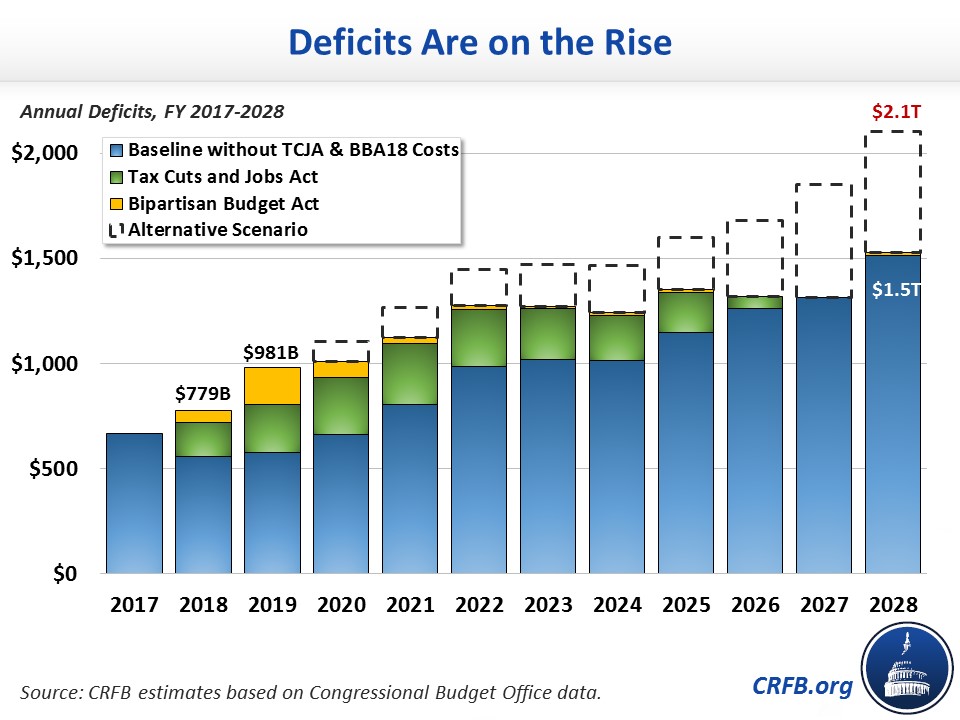
1. The Deficit Could Hit $1 Trillion This Year and $2 Trillion Within a Decade
Although deficits decreased from Fiscal Year (FY) 2011 to FY 2015, they’ve been rising ever since. We now expect deficits to return to nearly $1 trillion this fiscal year (2019) and stay above that level indefinitely. In fact, if lawmakers extend the costly tax cuts and spending increases indefinitely, deficits will be more than $2 trillion by 2028.
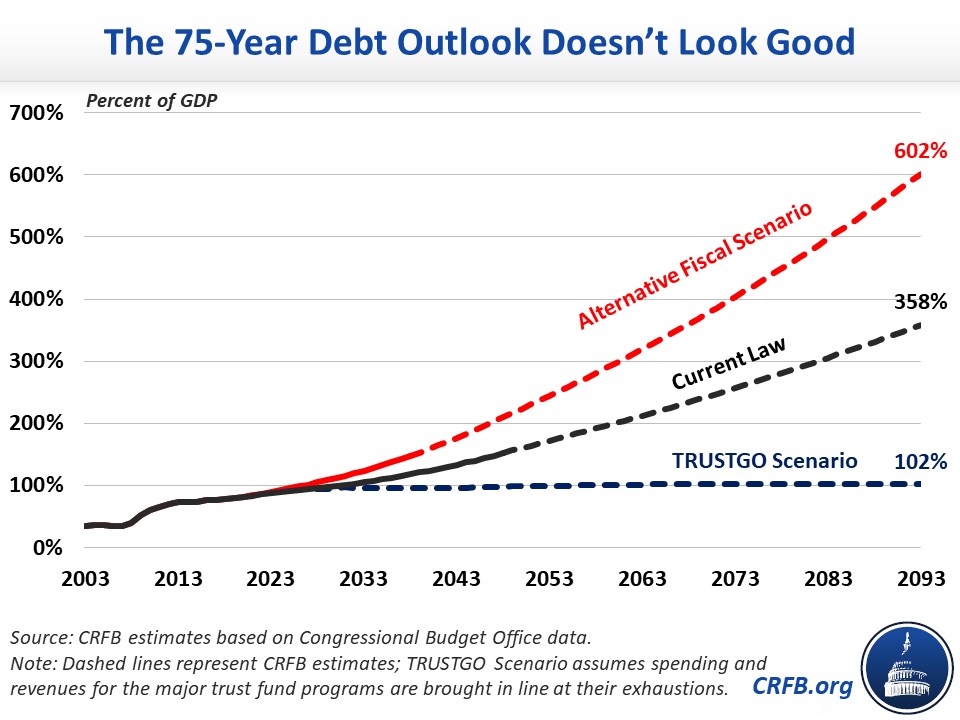
2. The Long-Term Debt Outlook is Terrifying
This fall, CRFB released its own 75-year budget outlook, which projected an unsustainable fiscal outlook. Under current law, debt will rise from 78 percent of Gross Domestic Product (GDP) in 2018 to 160 percent by 2050 and nearly 360 percent by 2093. Under the Alternative Fiscal Scenario, debt will exceed 600 percent of GDP by 2093.
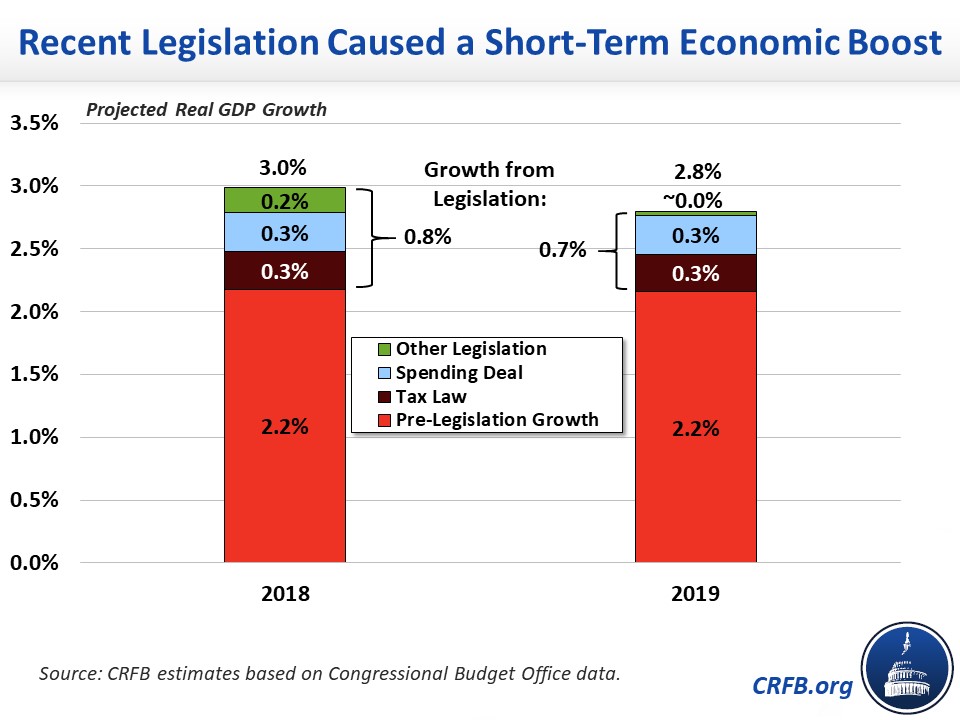
3. Debt-Financed Laws Offered a Temporary Stimulus
While the economy has grown by about 3 percent over the past year, our analysis Can America Sustain the Recent Economic Boost? showed that the growth rate would likely return to 2 percent per year. As we illustrated, near-term growth was largely driven by one-time stimulus and other effects from the Tax Cuts and Jobs Act (TCJA), the 2018 Bipartisan Budget Act, and other deficit-financed legislation. Unfortunately, the economic boost from these laws will be temporary – but the debt will be permanent.
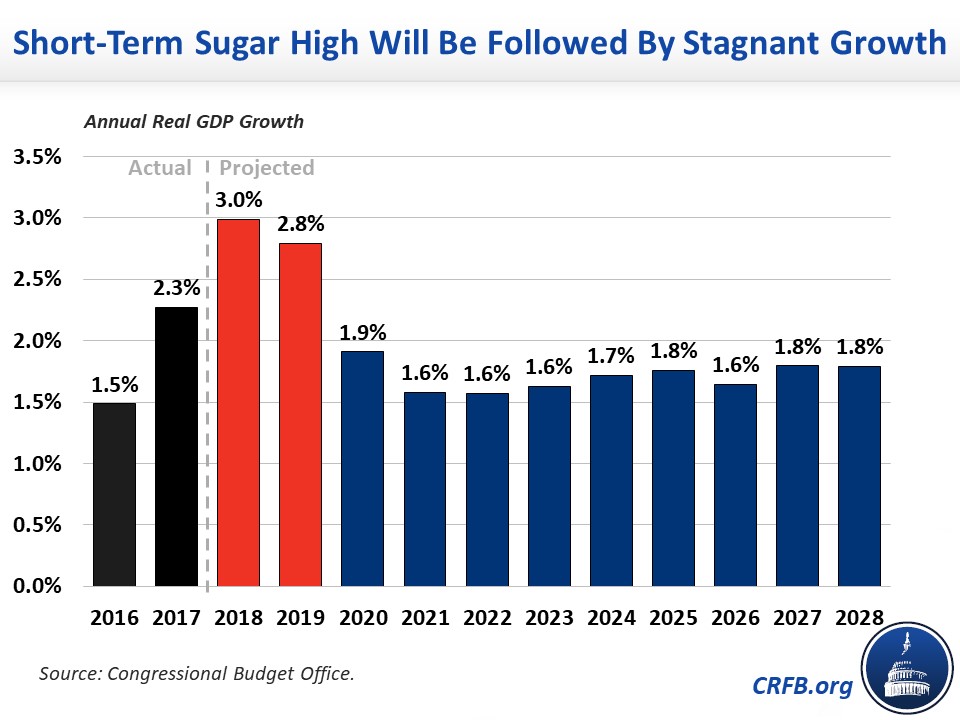
4. Rapid Economic Growth is Unlikely to Last
In the analysis of America's recent economic boost, we showed that nearly all forecasters agree that current rapid rates of economic growth are unlikely to last. For example, the Congressional Budget Office (CBO) projects that the economy will grow by 3 percent in 2018 and 2.8 percent in 2019, but then grow by between 1.6 and 1.9 percent per year for the remainder of the decade.
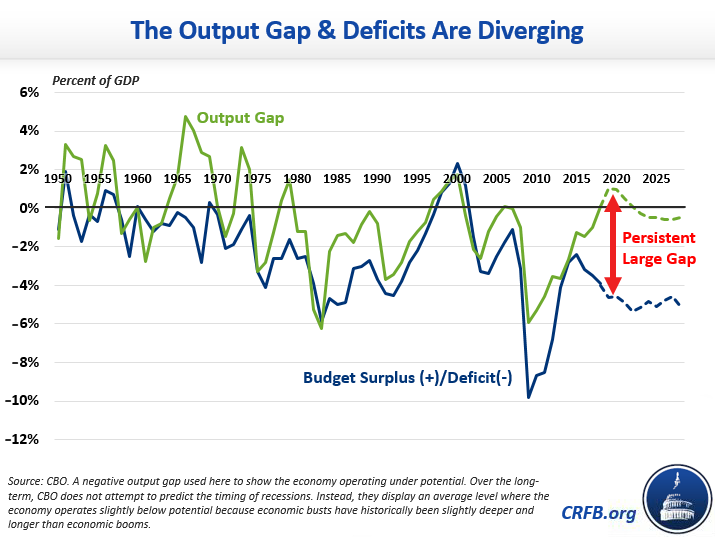
5. Deficits Shouldn’t Rise When the Economy is This Strong
Typically, a strong economy is paired with low deficits (or even surpluses) – both because strong economic performance produces more revenue and because it creates the economic space for deficit reduction. Yet despite the economy performing at or even above its potential, deficits are widening. In a recent analysis of deficits and the economy, we showed that the deficit has never been this high when the economy was this strong. 2018 and 2019 are extremely abnormal in that we are running high and rising deficits despite low unemployment, no significant output gap, no recession, and strong economic growth.
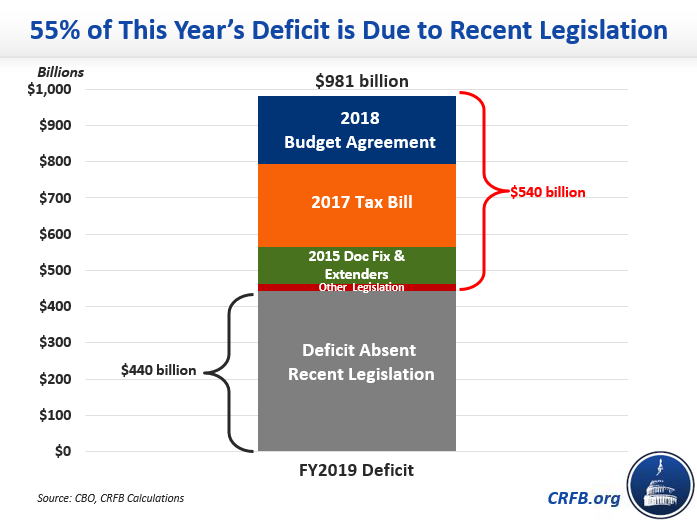
6. Policymakers are Responsible for More than Half of This Year’s Deficit
This year, the deficit will approach $1 trillion – and policymakers have no one to blame but themselves. We estimate that 55 percent of this year's projected deficit is the result of deficit-financed legislation enacted since 2015. Recent spending hikes and tax cuts will cost $540 billion this year. Had these laws been offset or not enacted, the deficit would be $440 billion rather than $981 billion, as CBO projects.
7. Recent Tax and Spending Bills Both Cost Trillions, If Extended
The Tax Cuts and Jobs Act of 2017 and the Bipartisan Budget Act of 2018 both added tremendously to the national debt. And while the tax cuts will cost significantly more ($1.9 trillion versus $435 billion) over ten years, that is largely an artifact of the most of the tax cuts enacted for eight years, while the spending boost was a two-year deal. We found that if lawmakers extend both laws indefinitely, the tax cuts will cost about $2.7 trillion over a decade while the spending bill will cost $2.4 trillion. That's $5 trillion of additional debt that this country simply cannot afford.
| Bill That Was Passed | If Extended | Total | |
|---|---|---|---|
| December tax bill | $1.27 trillion | $770 billion | $2.05 trillion |
| Debt Service | $580 billion | $40 billion | $620 billion |
| Total, December tax bill | $1.9 trillion | $810 billion | $2.7 trillion |
| Bipartisan Budget Act of 2018 | $320 billion* | $1.70 trillion | $2.02 trillion |
| Debt service | $115 billion | $250 billion | $350 billion |
| Total, Bipartisan Budget Act of 2018 | $435 billion | $1.95 trillion | $2.4 trillion |
Source: CBO estimates of the Bipartisan Budget Act of 2018 and April baseline projections. Tax bill reflects increased economic growth; no such estimate was provided for the spending bill. Figures rounded to the nearest $5 billion. With debt service, the tax bill is more expensive, but part of that effect is the inclusion of economic growth effects: faster economic growth raises interest rates and increases debt service for existing debt as well as new debt added because of the tax bill.
*Bipartisan Budget Act of 2018 primary savings scored through 2027, although nearly all costs took place in the short term.
8. Revenue Has Dropped, Not Risen
While some have claimed that revenue grew over the past year despite recent tax cuts (largely TCJA), we've shown that those claims are misleading. Technically, revenue was 0.4 percent higher in fiscal year 2018 than 2017. However, fiscal year 2018 incorporates revenue from the old pre-TCJA code – because it contains October through December of 2017 and April's tax payments for the previous calendar year. This growth does not account for inflation or income growth. Removing these factors, we estimated that actual revenue fell by 3.6 percent between tax year 2017 and tax year 2018. Revenue fell by 5.4 percent after inflation, and by 8.1 percent relative to GDP.

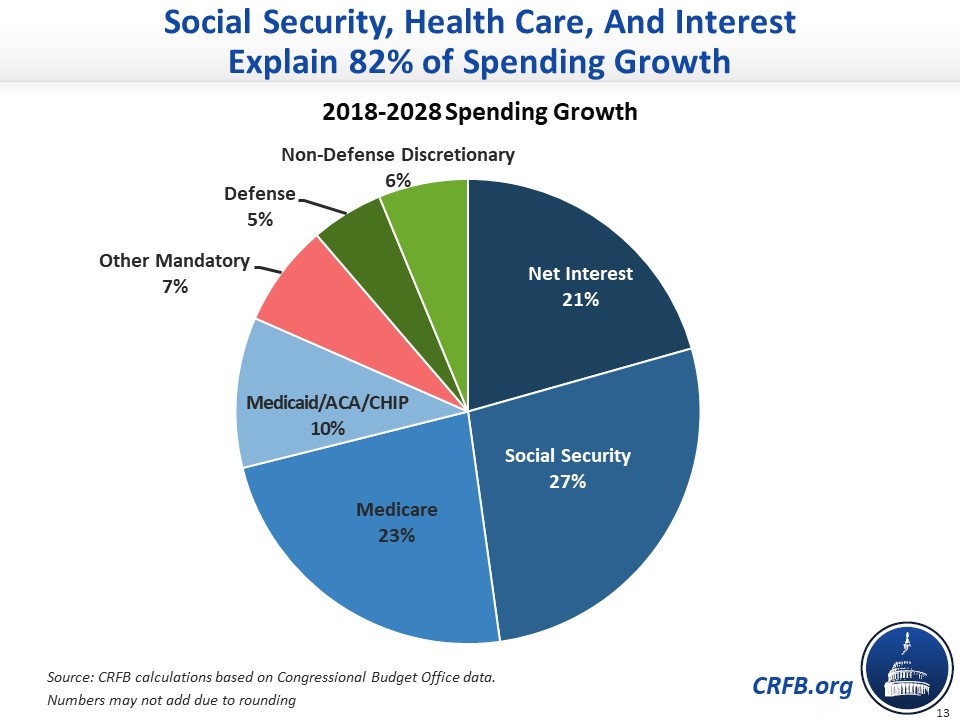
9. Entitlements and Interest Explain Long-Term Debt Growth
While near-term deficits are largely self-imposed, medium- and long-term debt growth are driven primarily by growing costs of Social Security, federal health spending, and interest on the debt. Indeed, these three categories of spending are responsible for over four-fifths of all nominal spending growth over the next decade alone.
10. Social Security is Hurdling Toward Insolvency
Social Security costs continue to grow faster than dedicated revenue, and its trust fund is running out. CBO projected that just 13 years from now – when today's 54-year-olds reach the normal retirement age and today's youngest retirees turn 75 – the Social Security trust fund will be depleted. The Trustees project insolvency in 16 years, when today's 51-year-olds reach the normal retirement age and today's youngest retirees turn 78. At that point, the law calls for a deep automatic across-the-board cut in benefits. Use this interactive tool to see how much you stand to lose.

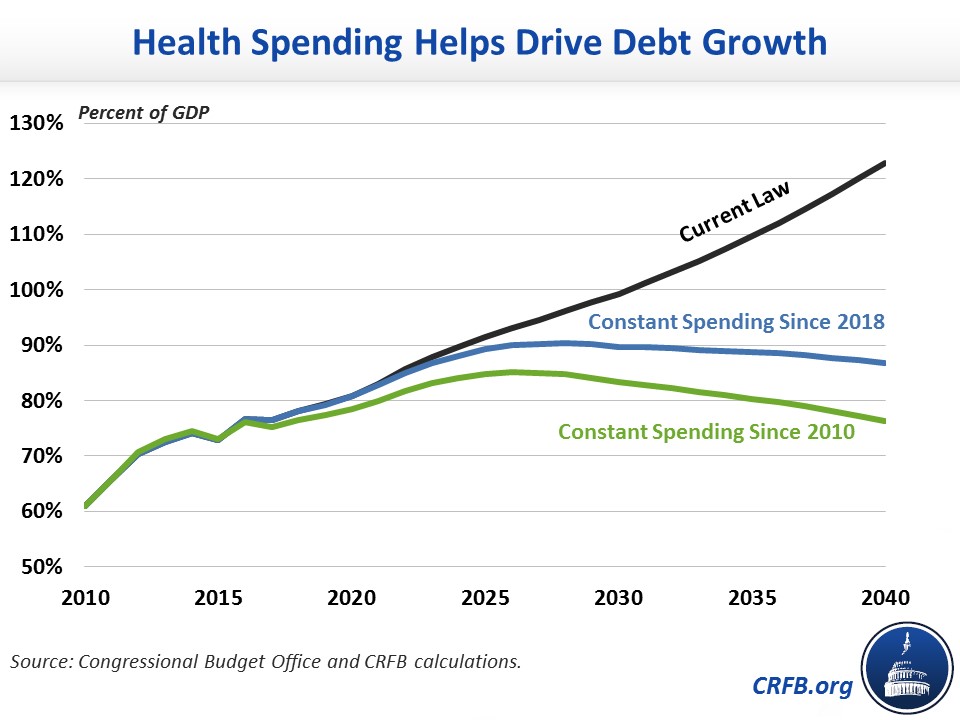
11. Rising Health Costs Are Driving Up the Debt
Health care spending is rising even faster than Social Security spending – both as a result of population aging and rising per-person health care costs. In our analysis of health spending and the federal budget, we found that If health spending were held constant at today’s level, debt would stabilize around 90 percent of GDP; if it had been held constant in 2010, debt would peak in about a decade and return to today's level by 2040.
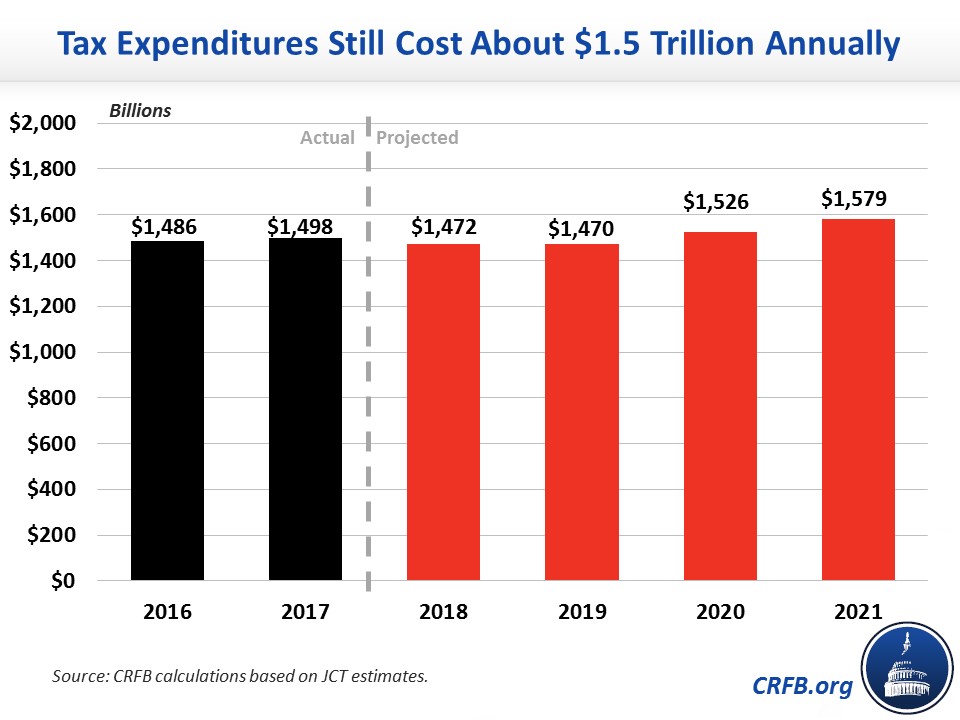
12. Tax Expenditures Remain Costly
While Social Security, Medicare, and Medicaid are the fastest growing federal programs, tax breaks remain costly. According to the Joint Committee on Taxation, income tax expenditures will cost about $1.5 trillion per year in lost revenue. While one goal of tax reform was to dramatically shrink the size and number of these tax breaks, the Tax Cuts and Jobs Act actually only eliminated one significant tax expenditure, and it did little to reduce the overall cost of tax preferences.
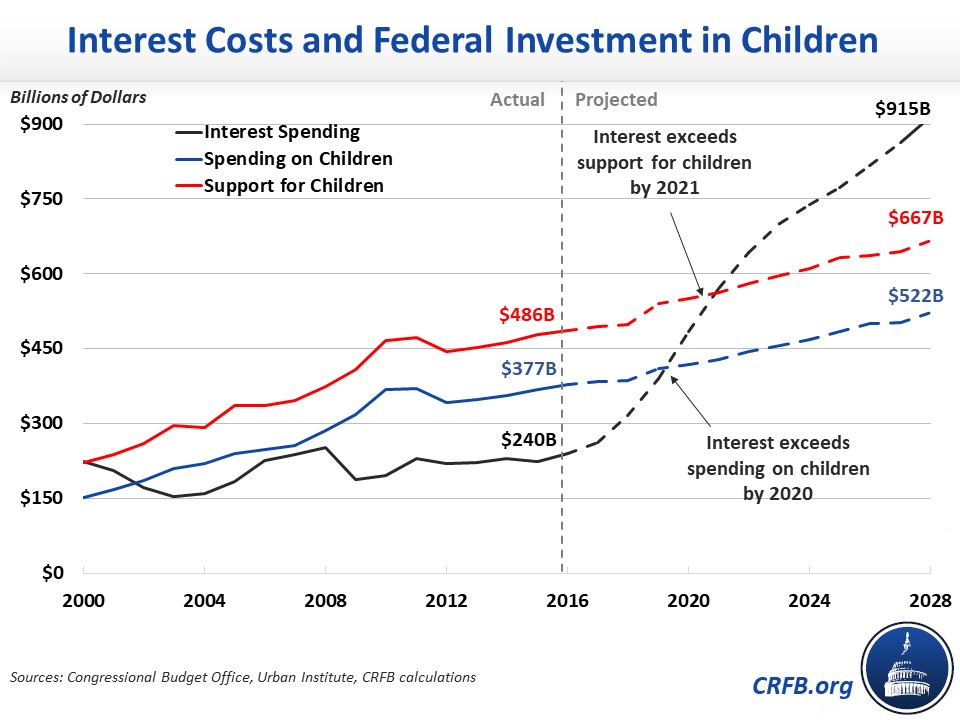
13. Policymakers are Prioritizing the Past Over the Future
This year, we published several papers in our Budgeting for the Next Generation project. Instead of leaving future generations better off, we’re leaving them with a stack of large bills. Interest payments on the debt are expected to exceed federal spending on children by 2020 and all federal support for children (including tax expenditures and spending) by 2021. That means we’ll soon be spending more financing the consumption of past generations than investing in our future.
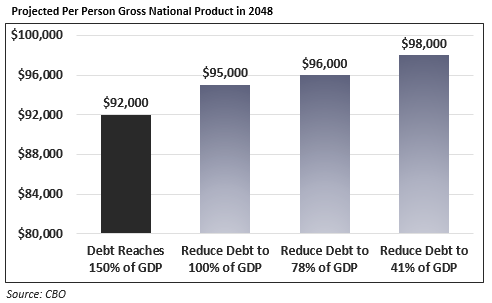
14. Reducing Debt Would Increase the Size of the Economy
One consequence of a rising national debt is that it crowds out productive investment, which in turn slows income growth. The corollary is that lower debt can actually boost income growth. CBO estimates that if debt were reduced to its historic average of about 41 percent of GDP by 2048, per-capita GNP (a rough parallel for average income) would be about $6,000 (6.5 percent) higher than under current law. Simply holding debt at current levels would boost income per person by $4,000 per year in 2048.