The COVID-19 Recession Is Unfolding Faster than the Great Recession – and So Is the Response
We have published an abbreviated update of this analysis, incorporating additional legislation, updated cost estimates, and new economic projections. We now find the COVID-19 response to be larger than the response to the Great Recession as a percentage of five-year GDP.
The current economic contraction caused by the novel coronavirus (COVID-19) pandemic appears to be larger than the Great Recession and is unfolding much more quickly. Over the last four weeks, 22 million people have filed for unemployment benefits – the same number that filed over the entire year of 2008. Social distancing and Shelter-in-Place measures have halted a substantial share of economic activity, leading to economic declines that would normally unfold over months to instead happen in days.
The response, too, has been far more rapid. We estimate that the three pieces of legislation enacted so far to combat the COVID-19 crisis will cost roughly $2.3 trillion through 2024 – roughly the same size as all stimulus legislation enacted during the Great Recession and subsequent recovery. Importantly, the fiscal response to the Great Recession spanned five years, while roughly 90 percent of the spending and revenue loss from COVID-19-related legislation so far will be spent over the next six months.

This blog post is a product of the COVID Money Tracker, a new initiative of the Committee for a Responsible Federal Budget focused on identifying and tracking the disbursement of the trillions being poured into the economy to combat the crisis through legislative, administrative, and Federal Reserve actions.
Comparing the Recessions
The current economic contraction has been much sharper and more sudden than any we have seen before. In fact, the economic impact of COVID-19 has been more akin to a major natural disaster than a typical recession. In a natural disaster, an entirely external threat arrives suddenly and with little warning, bringing an abrupt and widespread cessation of economic activity as businesses close, services become restricted, and people largely shelter-in-place. After the imminent threat has passed, people reemerge and the economy can recover and rebuild – sometimes quickly, other times slowly.
In contrast, the Great Recession of 2007-2009 unfolded over years, and took many more years to recover. The bursting of the housing market bubble set off a credit crisis, which quickly swept through the entire financial industry due to an unsafe amount of systemic risk. Unemployment numbers grew gradually as the recession was prolonged by a persistent lack of confidence in the economy on the part of consumers.
Our current crisis has been dramatically more sudden in nature than the previous one.
In 2008 and 2009, about 52 million people claimed unemployment benefits at some point – an average of roughly 500,000 per week. Because many were able to find new work over that time period, the unemployment rate peaked at 10 percent in October of 2009. By comparison, 22 million Americans have filed for unemployment benefits over just the past four weeks – an average of more than 5 million per week – and few have found new jobs. Experts believe the unemployment rate for this quarter to total somewhere between 13 and 20 percent, levels that have not been seen in American history outside of the Great Depression.
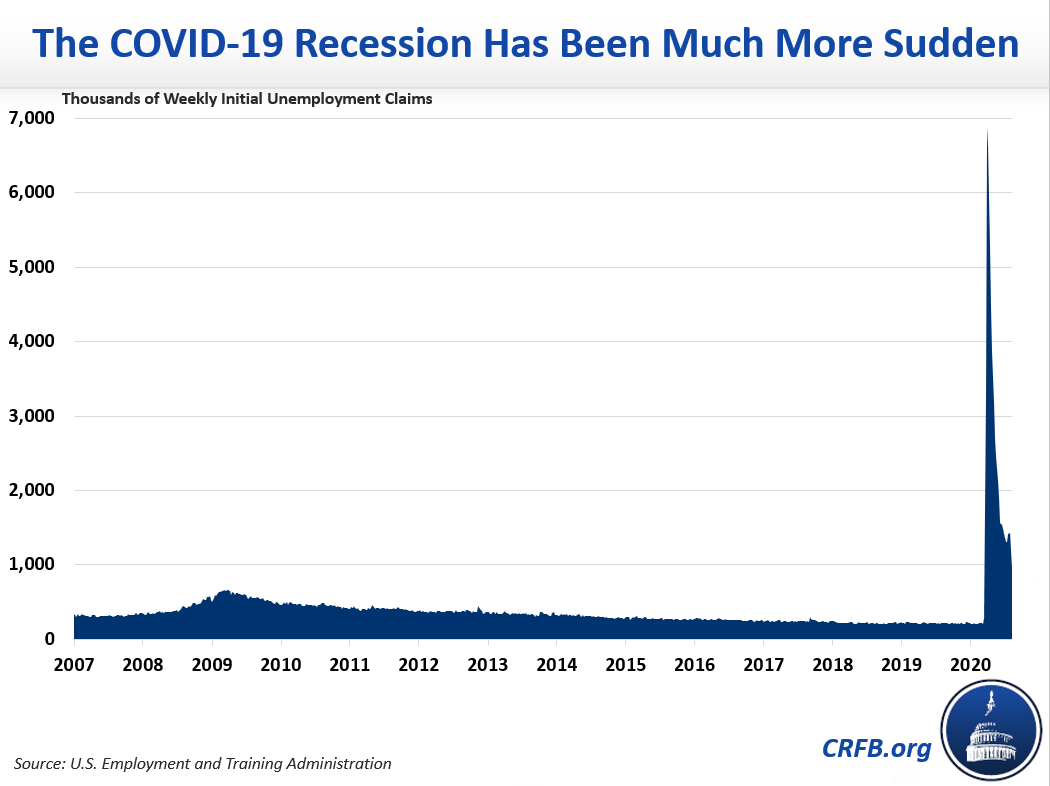
Similarly, Gross Domestic Product (GDP) during the Great Recession fell by a total of 4.3 percent between the peak in December of 2007 and the trough in June of 2009. CBO expects GDP to fall by 7 percent or more just this quarter.
Comparing Fiscal Responses
So far, the federal government has spent about as much to support the economy during the current crisis as it did during the Great Recession – but at a much faster pace.
Between 2008 and 2012, the federal government enacted roughly $1.8 trillion of fiscal stimulus and other economic support (we tracked these and other measures at Stimulus.org). By comparison, we estimate legislation enacted to combat the current crisis will cost roughly $2.3 trillion over the next five years. As a share of five-year GDP, these figures come to 2.4 percent and 2.0 percent, respectively.
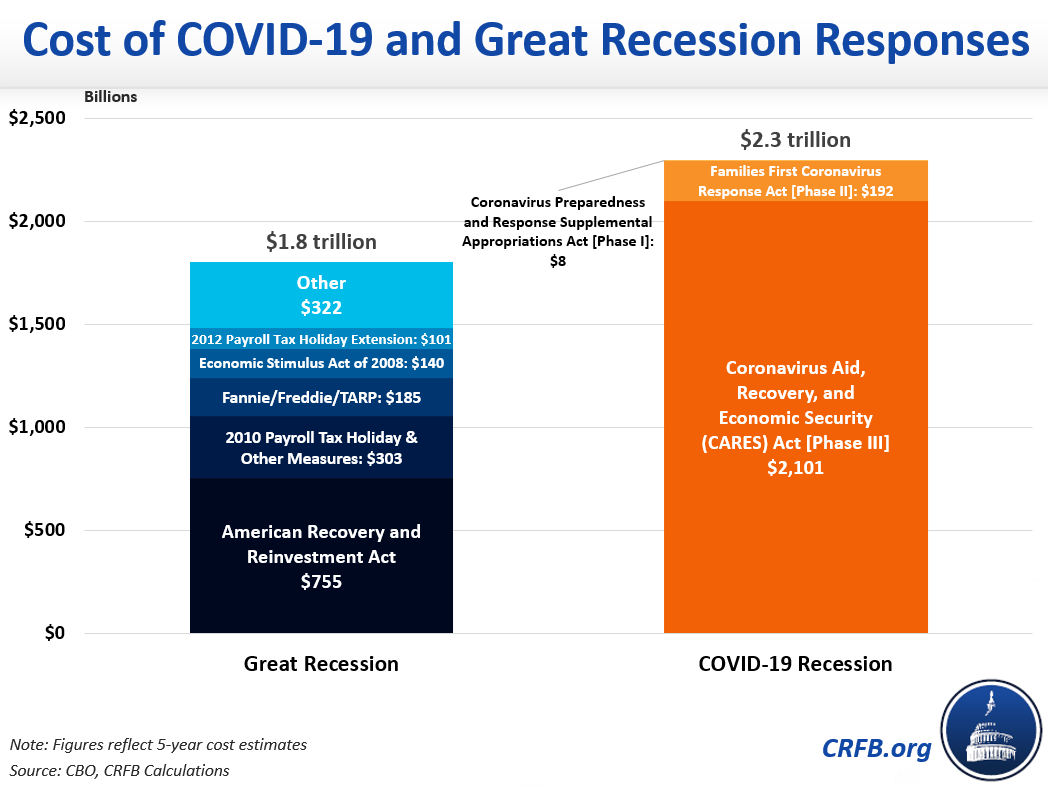
Economic stimulus during the Great Recession began in February 2008, when lawmakers issued roughly $150 billion of rebate checks. The largest bill did not come until 12 months later in February 2009, when policymakers enacted the American Recovery and Reinvestment Act (ARRA), which included nearly $800 billion in tax credits, infrastructure spending, an expansion of unemployment benefits and food stamps (SNAP), subsidies to purchase health insurance for those who had lost their jobs, significant aid to states, tax cuts, and other measures. Lawmakers enacted a series of extensions and additions in subsequent months and years, including a 2 percent payroll tax holiday for 2011 and 2012. They also put in place the Troubled Asset Relief Program (TARP), which provided $444 billion of loans, assets purchases, and other support to the financial sector and broader economy at a net cost of $49 billion over five years and $31 billion over ten. Finally, lawmakers put Fannie Mae and Freddie Mac into conservatorship and injected those entities with $200 billion – at a net cost of $136 billion over five years and a net savings of $72 billion over a decade.
This time around, the federal government has responded in a much more expedient and dramatic fashion, passing more than $2.3 trillion in new stimulus measures over the course of just a few weeks. These measures have included direct payments to individuals, a significant expansion of unemployment benefits, loans and grants to businesses for the purpose of maintaining payroll, as well as aid to states and specific allocations to various industries (see our summary table of the CARES Act).
While the overall size of the support is similar, current measures are far more front-loaded.
In the first year of the Great Recession, the federal government provided just $160 billion of stimulus, or just over 1 percent of GDP. From the second through fifth year, the total amount of stimulus provided ranged from 2 to 4 percent of GDP. Compare that to this year, in which we estimate the federal government will provide nearly $2.1 trillion in fiscal support (based on legislation enacted thus far) – more than 10 percent of GDP. That fiscal support will fall to below 3 percent of GDP next year and turn negative in subsequent years under current law.
In other words, policymakers have provided a similar amount of fiscal support today as they did during the Great Recession – but most will be spent over 6 months, rather than 5 years.
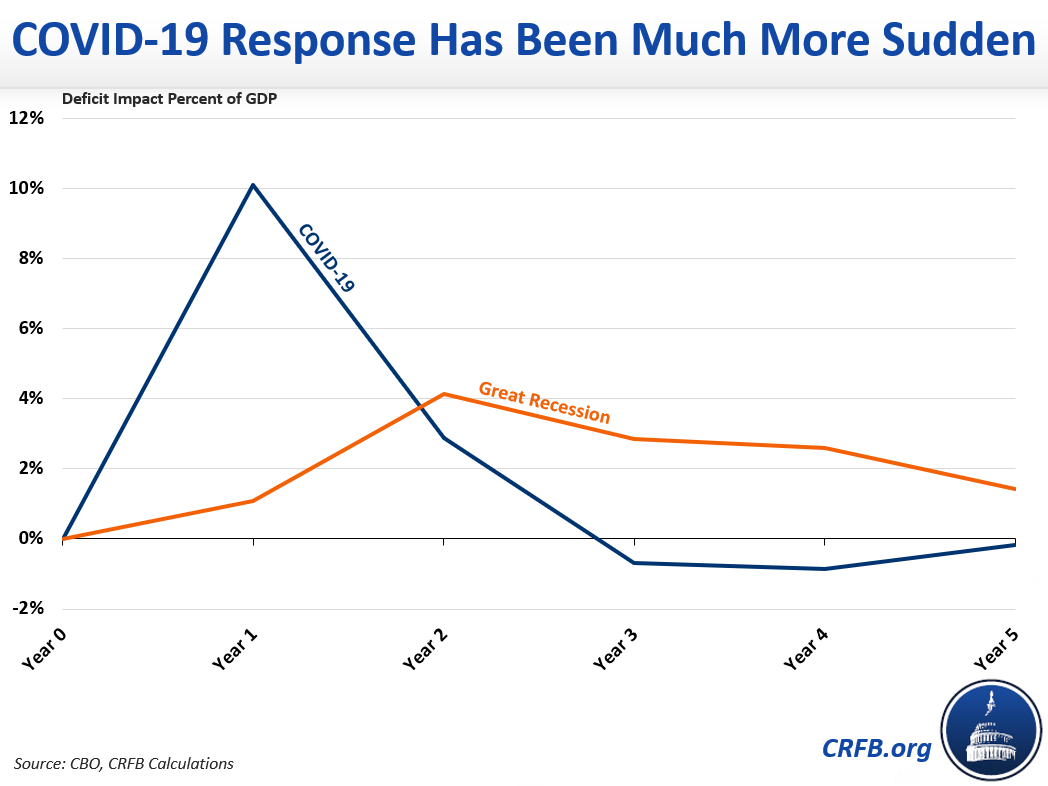
Given that the current public health crisis and recession is likely to last longer than a few months and lawmakers are already talking about more relief measures, total fiscal support is likely to be higher in 2021 and beyond than our current projections. But like the economic downturn itself, fiscal support so far is heavily front-loaded to the first year of the crisis.
