Time to Fix Medicaid Financing Schemes
Medicaid is currently the largest health care program in the United States, covering 93 million lower-income adults and children and accounting for one in every six dollars spent in the health care system. Although Medicaid is jointly financed by states and the federal government, federal contributions alone totaled $592 billion in 2022 and are expected to cost $6.8 trillion over the next decade. That makes Medicaid the fourth largest federal budget item, comprising almost a tenth of the budget.
States are responsible for managing their Medicaid programs and receive federal matching funds for expenditures based on a formula tied to a state’s per capita income. That formula, the federal medical assistance percentage (FMAP) currently covers between 50 to 83 percent of states’ Medicaid costs. If a state expanded their Medicaid program under the Patient Protection and Affordable Care Act (ACA), the federal government covers 90 percent of costs for that population.
While the matching funds are intended to cover state Medicaid costs, states have developed creative financing schemes to boost their effective matching rate and reduce the share of state general fund contributions to Medicaid financing. Through the use of revenue streams like provider taxes and intergovernmental transfers combined with various forms of supplemental payments to providers, this subversion of the matching formula has increased federal spending and increased health care costs, leading to uneven allocations of funding across states, while also leaving fewer resources available for needed reforms.
In this paper, we explain that:
- Medicaid costs are substantial
- States inflate their federal Medicaid matches with creative financing schemes
- These creative financing schemes can take several forms
- Restricting financing schemes can generate substantial budgetary savings
Given the strong financial position of most states and the weak position of the federal government, now would be an ideal time to begin tamping down on state efforts to arbitrarily boost their federal funding.
In future analyses, we will delve deeper into key Medicaid reforms to realign the incentives of state governments to ensure they are prudent stewards of federal Medicaid dollars, while encouraging states to obtain better value for the money spent through the program.
Medicaid Costs are Substantial
The Congressional Budget Office (CBO) projects federal Medicaid spending will be more than twice as large in 2033 as it was prior to the pandemic, growing from $409 billion in Fiscal Year (FY) 2019 to $879 billion by 2033.
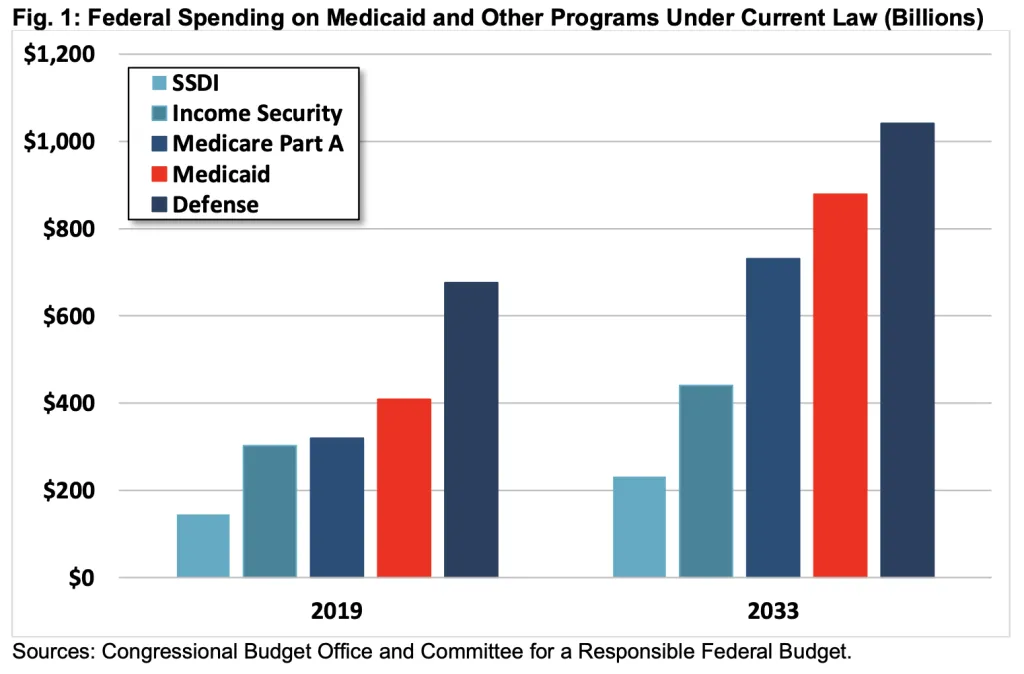
To put the cost of the Medicaid program in context, it is the fourth largest federal government program, behind Social Security, Medicare, and defense. By 2033, federal Medicaid spending will cost nearly as much as all defense spending, more than Medicare Part A, twice as much as all other income security programs combined, and nearly four times as much as the Social Security Disability Insurance (SSDI) program. Spending on Medicaid is projected to be nearly two-thirds larger than corporate income tax collections, and more than twice as large as the cost of extending the 2017 tax cuts.
As a share of the economy, Medicaid costs were 1.9 percent of GDP in 2019 and are projected to reach 2.2 percent by 2033. Importantly, Medicaid costs have temporarily spiked over the past three years – peaking at 2.4 percent of GDP in 2022 ($592 billion) because of pandemic-related measures that dramatically increased Medicaid enrollment and financial aid to states via Medicaid financing. Between February 2020 and December 2022, Medicaid enrollment increased by 21 million people, a 30 percent increase.
States Use Creative Financing to Inflate Their Federal Match
Under the FMAP formula, the federal government matches 50 to 83 percent of most state Medicaid expenditures along with 90 percent of spending on the ACA expansion population. The post-expansion average for the total federal match is about 63 percent – though it has been closer to 75 percent recently due to an enhanced match temporarily authorized during the pandemic.1
However, since the turn of the century, states have increasingly utilized various financing schemes to increase federal matching and inflate expenditures.2 The Government Accountability Office (GAO) and the Medicaid and CHIP Payment and Access Commission (MACPAC) have both estimated that the “real FMAP,” averages around 5 percentage points higher after accounting for the impact of financing schemes that shift costs to the federal government. Specifically, MACPAC estimated that in 2018 creative financing shifted federal matching costs 5.4 percentage points higher overall – by up to 2 percentage points for 11 states, 2 to 4 percentage points for 18 states, 4 to 6 percentage points for 12 states, and more than 6 percentage points for 10 states.3
This shift can be seen in the declining use of state general funds to pay for their portion of Medicaid costs, as the use of other funds has increased from around 20 percent to close to 30 percent.4 While using non-general funding could be harmless in principle, in practice this funding is largely used not only to fund Medicaid expenses but also to inflate them. In many cases, what appears to be state funds are instead circular financing schemes that allow for higher reported Medicaid costs and thus enhanced federal payments to states.
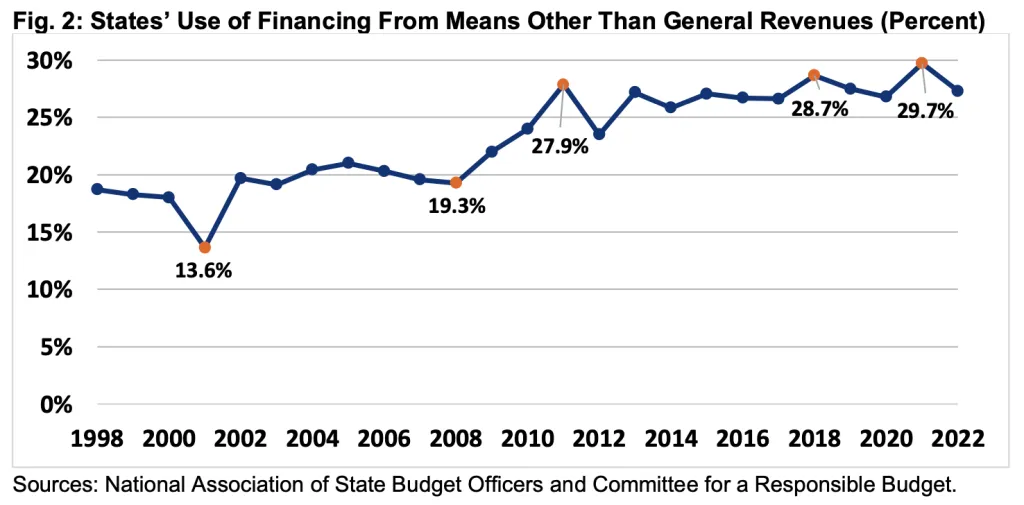
As an example, in 2018, states used provider taxes and local government funds to finance nearly 29 percent of the $224 billion total state share of Medicaid payments, a 7-percentage point increase since 2008.5 States‘ revenue, generated from provider taxes alone, increased from $10 billion in 2008 to $37 billion in 2018, growing from 7 to 17 percent of state Medicaid payments.
Creative Medicaid Financing Arrangements Take Several Forms
States rely on several financing arrangements to maximize their receipt of federal Medicaid funds. In general, these arrangements increase both state revenue and reported cost, thus increasing federal matching funds. The combination of new revenue and increased federal matching funds is then used to maintain or boost net payments to providers and reduce or eliminate state general revenue contribution for those expenditures.
Most of the schemes fall under these categories6 :
- Provider Taxes. These taxes are the largest and most common alternative financing mechanism – used in every state but one. States levy taxes on health care providers to boost Medicaid expenditures – often to the very same providers. Because reported expenditures are split with the federal government based on the state’s matching rate, higher provider taxes and spending at the state level leads to higher federal costs.
- Intergovernmental Transfers (IGTs). State Medicaid agencies sometimes accept transfers of funds from local governments or providers like hospitals or nursing homes owned by local governments. The state then uses those funds, plus a federal match, to pay for services in the original locality or local government-owned service provider.
- Certified Public Expenditures. Local governments or the providers owned by them, can certify Medicaid expenditures with state Medicaid agencies, who then request matching funds from the federal government directly. Those matching funds may then be sent to the local entity in their entirety, or the state can keep a portion.
- Intra-agency Transfers. State agencies that finance Medicaid spending can transfer funds amongst themselves to cover parts of the state Medicaid contribution and receive additional federal matching.
The above financing mechanisms and their federal matching funds are largely funneled into Medicaid “supplemental payments.” In these payments, health care providers receive lump sum money not tied directly to specific services, particularly in traditional fee-for-service (FFS) arrangements. The original intent of the payments was to help states supplement shortfalls in reimbursements for services rendered to Medicaid enrollees and increase beneficiary access to providers. However, they also play a large role in the schemes to increase federal matching.
Of all the Medicaid FFS payments made to hospitals, less than half were base payments for services, meaning the majority were supplemental payments.7 It is clear that some hospitals receive a combination of Medicaid base payments and supplemental payments that far exceed their cost of providing services to Medicaid beneficiaries. Furthermore, with the majority of Medicaid payments shifting from FFS to capitated Managed Care Organizations (MCOs), there is increased opportunity for abuse of payment and financing schemes.8
Restricting Financing Schemes Can Generate Substantial Savings
Creative financing schemes impose a very real cost and an opportunity cost for the federal government. Restricting these schemes, therefore, could generate substantial federal savings.
For example, banning the use of provider taxes alone would save $600 billion over a decade, based on estimates from the Congressional Budget Office. Those taxes are effectively capped at a rate of 6 percent of net patient revenue under current law. Simply reducing that cap to 2.5 percent would save nearly $250 billion. Reducing it to 5 percent would save almost $50 billion.9;
For perspective, the $600 billion from banning provider tax schemes would be enough to:
- Prevent Medicaid costs from growing as a share of the economy beyond 2024;
- Reduce the national debt by 2 percent of GDP by 2033;
- Increase the average federal Medicaid contribution by 9 percent;
- Fund President Biden’s entire Medicaid and ACA agenda, including extending higher subsidies, expanding coverage to those in the “Medicaid gap” in non-expansion states, and funding home- and community-based services; or
- Reduce the corporate tax rate by about 5 percentage points.
Of course, serious reforms would look beyond provider tax rates and consider all financing schemes that allow states to avoid any financing contributions for Medicaid expenditures.
To start, policymakers could focus on transparency. GAO has issued multiple recommendations for CMS to develop more robust data collection processes to ensure states report accurate and complete data on all sources of funds used to finance Medicaid payments; this includes the degree to which health care providers are funding the nonfederal share of the payments they receive. Congress has failed to take meaningful, timely action on these issues, although it did recently include provisions in law to require some specific CMS oversight actions.10
Particularly with this new information, federal policy could better focus on closing various loopholes and restricting – or adjusting for – states’ abilities to boost their Medicaid match.
More could also be done to improve fairness between the states. Although the FMAP formula is supposed to distribute federal resources roughly based on state need, Medicaid financing schemes lead to a distribution of federal funding based on gaming ingenuity instead.
The federal government and states share the responsibility of promoting program integrity, and proper management and function of the Medicaid program is vital to ensure its ability to provide quality and efficient care while using taxpayer dollars appropriately, with minimal waste. The continued proliferation of creative financing schemes, especially when combined with the move towards managed care – which has its own set of oversight challenges when compared to FFS arrangements – opens up a multitude of opportunities for fraud and abuse.
Conclusion
The time is ripe for Medicaid reforms that target these creative financing schemes. State governments have continued to exploit federal matching rules despite being flush with cash.
Over the past three years, state government revenues have surged, as state and local governments have run a combined $4.2 trillion of primary (non-interest) surpluses; this compares to just $1.1 trillion in the three years prior.11
These gains come in part from $1 trillion of federal COVID relief sent to state and local governments, including a 6.2 percent boost in Medicaid matching funds.12
State and local revenue has since flattened, but this is largely because at least 43 states have enacted tax relief over the past two years; revenues still remain well above pre-pandemic levels. States also have robust rainy-day funds. The typical state government now has enough in total balances to fund operations for 126 days, which is about 2.5 times more than the average of 51 days before the pandemic in 2019 and 3.5 times more than the average over the decade prior to the pandemic.13
Furthermore, now is also a good time to put reforms in place that limit states' ability to exploit existing financial mechanisms as the rapid move to managed care has opened up new, and potentially larger, gaming opportunities.
Of course, any policy changes should be made thoughtfully and implemented carefully to give states time to adjust and ensure they can continue to deliver vital Medicaid benefits. But Washington should no longer ignore the use of creative financing schemes that worsen federal deficits, crowd out other priorities, enrich states and providers, reduce fairness, and undermine federal intent. The time is ripe for reforming these mechanisms.
1 Medicaid and CHIP Payment and Access Commission (MACPAC), “The Effect of State Approaches to Medicaid Financing on Federal Medicaid Funding,” November 2021, https://www.macpac.gov/wp-content/uploads/2021/11/The-Effect-of-State-Approaches-to-Medicaid-Financing-on-Federal-Medicaid-Spending.pdf, and Congressional Budget Office (CBO), “Options for Reducing the Deficit, 2023 to 2032, Volume 1: Larger Reductions,” October 2022, https://www.cbo.gov/system/files/2022-12/58164-budget-options-large-effects.pdf.
2 Medicaid and CHIP Payment and Access Commission (MACPAC), “Medicaid Enrollment and Total Spending Levels and Annual Growth,” December 2022, https://www.macpac.gov/news/macpac-releases-2022-edition-of-macstats-medicaid-and-chip-data-book/.
3Data includes Washington, DC as a state. Medicaid and CHIP Payment and Access Commission (MACPAC), “The Effect of State Approaches to Medicaid Financing on Federal Medicaid Funding,” November 2021, https://www.macpac.gov/wp-content/uploads/2021/11/The-Effect-of-State-Approaches-to-Medicaid-Financing-on-Federal-Medicaid-Spending.pdf.
4National Association of State Budget Officers (NASBO), Archive of State Expenditure Report, https://www.nasbo.org/reports-data/state-expenditure-report/state-expen…; see also Medicaid and CHIP Payment and Access Commission (MACPAC), “Health Care-Related Taxes in Medicaid” [Issue Brief], May 2021, https://www.macpac.gov/wp-content/uploads/2020/01/Health-Care-Related-Taxes-in-Medicaid.pdf (Provider taxes as a percentage of states’ nonfederal share of Medicaid financing range from less than 0.5 percent in five states to over 30 percent in at least three states.).
5U.S. Government Accountability Office (GAO), “CMS Needs More Information on States’ Financing and Payment Arrangements to Improve Oversight,” December 2020, Report no. GAO 21-98, p. 22, https://www.gao.gov/assets/gao-21-98.pdf.
6We will write more about these schemes in our next issue brief. See generally U.S. Government Accountability Office (GAO), “Medicaid: Primer on Financing Arrangements,” July 2020, Report no. GAO 21-98, pp. 8, https://www.gao.gov/assets/gao-20-571r.pdf.
7Medicaid and CHIP Payment and Access Commission (MACPAC), “Medicaid Base and Supplemental Payments to Hospitals” [Issue Brief], March 2023, https://www.macpac.gov/wp-content/uploads/2023/03/Medicaid-Base-and-Supplemental-Payments-to-Hospitals-Issue-Brief.pdf.
8While FFS supplemental payments are limited by “Upper Payment Limits,” new types of “directed payments” are being used in Medicaid managed care in similar ways as FFS supplemental payments, but without the limits. See U.S. Government Accountability Office (GAO), “Medicaid: State Directed Payments in Managed Care,” June 2022, Report no. GAO 22-105731, https://www.gao.gov/assets/gao-22-105731.pdf.
9Congressional Budget Office (CBO), “Options for Reducing the Deficit, 2023 to 2032, Volume 1: Larger Reductions,” October 2022, https://www.cbo.gov/system/files/2022-12/58164-budget-options-large-effects.pdf. Additional calculations computed by the Committee for a Responsible Federal Budget. .
10Centers for Medicare & Medicaid Services (CMS), Agency Letter to State Medicaid Directors, “RE: New Supplemental Payment Reporting and Medicaid Disproportionate Share Hospital Requirements under the Consolidated Appropriations Act, 2021,” December 2021, https://www.medicaid.gov/federal-policy-guidance/downloads/smd21006.pdf
11See U.S. Bureau of Economic Analysis, “Table 3.1. Government Current Receipts and Expenditures,” https://www.bea.gov/data/government/receipts-and-expenditures
12Committee for a Responsible Federal Budget. Covid Money Tracker. https://www.covidmoneytracker.org/
13The Pew Charitable Trusts, Fiscal 50: State Trends and Analysis (2023), https://www.pewtrusts.org/en/research-and-analysis/data-visualizations/…, Additional calculations computed by the Committee for a Responsible Federal Budget
Tags
What's Next
-
Image

-
Image

-
Image