Employer Plans in Medicare Advantage: A Flaw in the Quality Bonus System
Employer Group Waiver Plans (EGWPs) are a popular option for unions and employers to provide former workers with retiree health insurance in place of traditional retiree health plans. EGWPs are part of the Medicare Advantage (MA) program and constitute over 17 percent of all MA plans.
These plans are also included in the MA quality bonus program (QBP). The program provides extra payments to MA plans depending on how they fare on an array of performance metrics. The results are also published with the intention of giving beneficiaries information on which plans to shop for based on quality.
However, the inclusion of EGWPs makes little sense given restrictions on beneficiary choice and differences in beneficiary characteristics – which lead to higher average quality ratings and extra QBP spending. More broadly, there is substantial evidence that the QBP fails in its efforts to measure quality or give useful information to MA enrollees, despite the fact that Medicare will spend $15 billion on bonuses in 2024.1
Reforms targeting the interaction between EGWPs and the QBP would save money for the federal government, as would more comprehensive reforms.
Over the next decade (2024-2033), policy options related to Medicare Advantage that:
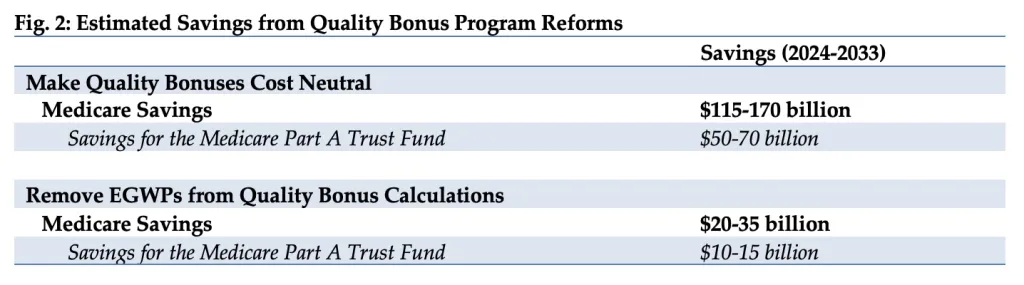
- Fully reform the quality bonus system could reduce Medicare spending by between $115 to $170 billion
- Make EGWPs ineligible for quality bonuses could reduce Medicare spending by $20 to $35 billion
These options would improve the solvency of the Medicare trust fund and reduce the federal budget deficit. They build on previous Health Savers Initiative research on overpayments to MA private insurance plans. Altering MA quality bonus payments and EGWP rules would be sensible steps towards making MA more efficient.
The Health Savers Initiative is a project of the Committee for a Responsible Federal Budget, Arnold Ventures, and West Health, which works to identify bold and concrete policy options to make health care more affordable for the federal government, businesses, and households. This brief presents options meant to be just some of many, but incorporates specifications and savings estimates so policymakers can weigh costs and benefits and gain a better understanding of whatever health savings policies they choose to pursue.
What are Employer Group Waiver Plans (EGWPs)?
EGWPs are retiree health insurance plans that originate from a waiver provision in the Medicare statute that grants the Secretary of Health and Human Services authority to modify MA rules to promote and facilitate employer group plans.
The number of EGWP enrollees has increased from 1.8 million in 2010 to 5.4 million in 2023, and has constituted between 17 and 18 percent of MA enrollees.2 According to KFF, over half of the large employers that offer retiree health insurance offer an MA option, nearly double the amount in 2017.3 Additionally, in almost half of those instances, the only retiree option for health coverage is through the employer’s chosen MA plan.4
The waivers make it easier for employers and unions to provide retiree coverage using the same plans available to active workers, rather than through separate programs that combine traditional fee-for-service (FFS) Medicare coverage with a supplemental policy (such as Medigap or an employer/union-administered supplemental option). Additionally, MA enrollment for the group can be done through a streamlined process as opposed to individual beneficiary enrollment. EGWPs are also not required to participate in the yearly MA open enrollment period.
This flexibility can encourage employers and unions to maintain retiree health benefits when they might otherwise be inclined to drop coverage. The decision to offer EGWPs as retiree health benefits could also be because they are likely lower in cost. For example, the New York City government attempted, but was ultimately blocked from, trying to move retired employees to an EGWP, claiming it would save $600 million-a-year.5 Yet, the lack of transparency into these plans and their costs relative to other retiree health options limits the ability to determine the degree of actual cost savings to businesses. It also makes it difficult to consistently understand the degree to which EGWPs differ in federal budget costs relative to other retiree benefit arrangements in FFS Medicare (like wraparound coverage).6
However, the Medicare Payment Advisory Commission’s (MedPAC’s) most recent estimate, based on 2018 data, suggests that EGWPs increase MA costs by about 1 percent of average FFS spending, which translates into approximately $4.5 billion in 2023.7 This brief focuses on one costly EGWP feature – their impact on MA quality bonuses – and offers some options to reduce those costs.
The backdrop for concern about EGWP costs is that the federal government clearly spends large amounts subsidizing MA plans more generally. Overall, MedPAC estimates 2024 MA payments will be 123 percent of FFS spending – $88 billion higher.8 These overpayments are due to numerous factors, with the largest being risk score gaming from plan diagnostic coding intensity and favorable selection into MA. The Health Savers Initiative calculates that these two phenomena could lead to 2024-2033 MA overpayments totaling between $1.0 trillion and 1.4 trillion.9
EGWP Payments and the Quality Bonus Program (QBP)
In the QBP, the Centers for Medicare and Medicaid Services (CMS) attempts to measure insurance company performance using a set of quality metrics that translate into ratings from 1 to 5 stars. Bonuses are used to reward high performing plans, and the ratings are published for individual MA beneficiaries to use as shopping tool (although as described later, numerous studies have recognized that this information is not very helpful).
For contracts with star ratings at or above 4 stars, plan payments increase by 5 percent (or double that amount in certain counties).10 Plans also get additional “rebates” which vary based on a contract’s star rating – with the highest going to those rated at 4.5 or 5 stars. Notably, there is no actual payment reduction for poorer performing plans.
According to KFF, bonuses totaled about $13 billion in 2023, up from $10 billion in 2022.11 MedPAC estimates bonuses will total at least $15 billion in 2024.12 For EGWPs, bonuses are higher ($460 per enrollee in 2023) compared to MA plans open for general enrollment ($417).13 This reflects overperformance in the quality metrics for EGWPs that are not necessarily driven by the delivery of higher quality care to beneficiaries.
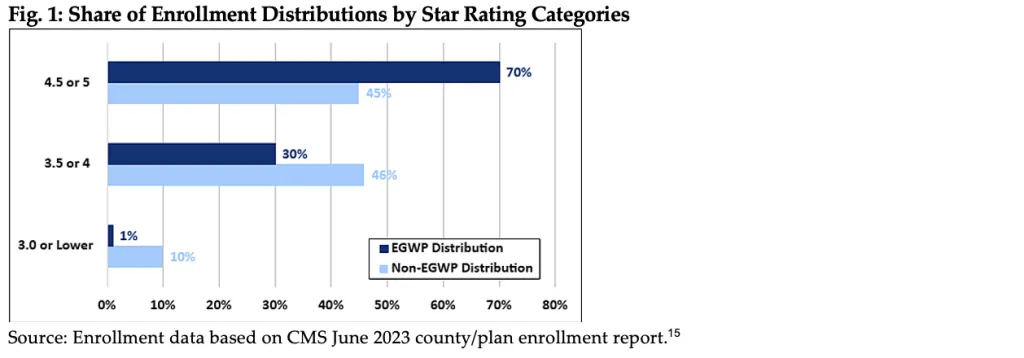
CMS contracts with Medicare Advantage Organizations (MAOs) to offer MA plans. QBP ratings are assigned at this contract level, with the rating being determined by, and then applied to, all plans under that contract across the country – including EGWPs. An MAO may offer only one plan under a contract, as in the case of a health maintenance organization (HMO) that serves only one county and offers only one benefit package to prospective enrollees. Alternatively, an MAO could choose to have a single contract with CMS to offer plans in multiple counties, including a mix of EGWP and non-EGWP plans. Because plan payments vary from county to county, a multi-county contract may have different plans with varying benefits in every county. As of December 2023, there were 774 MA contracts with nearly 7,000 plans, of which 1,669 were EGWPs.14
Contracts with larger shares of EGWP enrollment have higher average star ratings. As seen in Figure 1, a large majority of EGWP enrollees (70 percent) are in plans with a 4.5- or 5-star rating.15 Only a small fraction (1 percent) of EGWP enrollees are in plans rated below 3.5 stars.
It is clear that EGWPs have an advantage when it comes to garnering higher quality ratings. That can be traced to quality metrics used by CMS that reward differences in the demographic characteristics of enrollees (who, for example, all had insurance coverage prior to Medicare entitlement), a healthier population (risk scores are lower in EGWPs than average16), and some consumer satisfaction ratings. Disenrollment rates are also used as a quality metric where EGWPs perform favorably because enrollees frequently lack the option to disenroll, since their employer has typically pre-selected the plan as a means to access retiree health benefits. CMS recognizes that higher ratings can be attributed to population characteristics and not plan performance; accordingly, it uses a categorical adjustment index to correct for population enrollment within an MA contract, but those efforts do not fully even the playing field.17
This “shine” from EGWPs transfers over to non-EGWP plans under the same contract in the form of higher star ratings, which make the non-EGWP plans artificially more appealing to individual consumers. Further, bonus payments allow plans to offer extra benefits, making them even more attractive products. Consequently, ratings are often a product of a strategic combination of plans within contracts to garner bonuses and thereby customers, while providing nominal information to individuals shopping for an MA plan.
The QBP also fails in other ways. Studies have shown that its measurements misalign incentives for investment in behaviors that improve scores without improving clinical quality,18 and contracts with higher Medicare star ratings “have larger racial, ethnic, and socioeconomic disparities in quality."19 Additionally, there exists a wide array of geographic disparities because star ratings are awarded at the contract level, encompassing all plans that serve various regions across the country within those contracts.20 Ultimately, MedPAC has concluded that “the QBP is flawed and does not provide a reliable basis for evaluating quality across MA plans in meaningful ways.”21
Perhaps the most obvious way to point out the failure of the QBP is that in 2023, 85 percent of all MA plans qualified for a quality bonus. Since these bonuses are not budget neutral, “high-performing” plans receive more money, while lower performing plans avoid penalties – establishing an expensive bonus system. Considering the already substantial overpayments to private plans in MA before factoring in quality bonuses, this wasteful system warrants reform. 22
Policy Options to Address the QBP and EGWPs
Generally, any MA-wide reforms which would reduce MA payments would also reduce EGWP payments. The Health Savers Initiative continues to encourage policymakers to address overpayments due to coding intensity and favorable selection that we project to total within the range of $1.0 to $1.4 trillion over ten years. There exist a range of policy options, with a wide range of savings, that could be implemented to correct for these overpayments.
Further measures can be taken to ensure effective use of Medicare program dollars in the EGWP program. In addition to the options below, it is imperative for both CMS and Congress to work to increase EGWP transparency. Because of limited EGWP reporting requirements, there remains a significant lack of understanding regarding the sponsoring employers, plan structures, benefit packages, provider networks, and financial performance.23
Option 1: Switch to Cost-Neutral Quality Bonuses
A full reform of quality bonuses, as has been proposed by MedPAC and others, is the most fiscally responsible and beneficiary-friendly option despite its broader impact beyond EGWPs. While various proposals exist, including specific recommendations from MedPAC, any quality ratings system that remains should ensure that bonuses tied to quality are financed through a budget-neutral redistribution of funds within MA.24 This means that high-performing plans would receive rewards while low-performing plans would face penalties – thus balancing costs – as opposed to the currently one-sided and expensive bonus-only system. (It is worth noting that there are numerous quality incentive programs in FFS Medicare that are budget neutral or that garner cost savings.) Moreover, given the substantial overpayments in MA generally, transitioning to this system would still allow a wide range of plans to receive sufficient payments. This option has the potential to save between $115 to 170 billion over ten years.25
A modest stride toward comprehensive reform, analyzed by MedPAC, would involve limiting star ratings component data to only include measures of health outcome, resulting in savings exceeding $40 billion.26 Eliminating double bonus counties, as estimated by the Congressional Budget Office (CBO), would save over $20 billion.27
Option 2: Make EGWPs Ineligible for Quality Bonus Determinations
An EGWP-specific alternative would involve excluding EGWPs from contracts for the purposes of ratings and quality bonus calculations. As discussed, the specific population characteristics and enrollment rules of EGWPs inflate ratings, but the ratings offer limited assistance to individual MA beneficiaries when selecting plans. It also seems illogical to allow MAOs to strategically amalgamate EGWPs with other publicly available plans to attain higher ratings and bonuses. The policy option to remove EGWPs from the QBP system would save between $20 to 35 billion, based on KFF’s estimates for the percentage of bonus payments allocated to EGWPs.28
A smaller step here would be to further refine CMS’s categorical adjustment index (CAI) which adjusts star ratings for plans with significant enrollment of Medicare-Medicaid dual eligibles or beneficiaries entitled on the basis of disability. EGWPs could be assigned a distinct CAI which would result in further downward adjustments of star ratings, in addition to the indirect downward adjustments already made due to the dual and disabled CAIs. This approach would address the concern raised in CMS and MedPAC research that found EGWP plans have a healthier-than-average population compared to non-EGWP plans.29 (Savings unknown)
Other Problems with EGWPs
There are areas other than in the QBP where the unique features of EGWPs, particularly their lower administrative costs, allow them to cross-subsidize non-employer plans within contracts, leading to higher MA payments. One example of why their administration costs are lower involves lower marketing and beneficiary acquisition costs. EGWPs are offered and sold to a bloc of Medicare beneficiaries, contrasting with the individual market where MAOs face considerably higher costs for marketing and member acquisition.
One option to account for EGWPs lower administrative costs and greater profitability, and the resulting excess Medicare payments, would be to uniformly reduce EGWP payments by 2 percent.30 This discount could promote greater equity between EGWP and regular MA plan payments. We estimate this could save around $15 billion.
Additionally, EGWPs serving as the sole retiree option for health benefits in many cases can lead to continuity-of-care issues and may complicate beneficiaries’ transition to FFS Medicare with Medigap supplemental benefits later in retirement.31 These beneficiary concerns could also provide the impetus needed for policymakers to delve further into these plans.
Conclusion
It is time for policymakers to consider the challenges associated with the QBP system and EGWPs as a way to address Medicare costs and the impending insolvency of the Part A trust fund. Given the large overpayments in MA, reforming this small segment of MA should rebalance incentives and enhance the program’s effectiveness for all beneficiaries, while maintaining the financial incentives for insurance companies to participate in MA.
At the very least, greater attention should be devoted to understanding how these plans integrate within MA and the need for enhanced transparency across all aspects of EGWPs to enable policymakers to better tailor the program for retirees.
1 See Medicare Payment Advisory Commission (MedPAC), “March 2023 Report to the Congress: Medicare Payment Policy,” March 2023, at 349, https://www.medpac.gov/document/march-2023-report-to-the-congress-medicare-payment-policy/ illustrating how EGWPs raise costs.
2 See KFF, “Medicare Advantage in 2023: Enrollment Update and Key Trends,” August 9, 2023, https://www.kff.org/medicare/issue-brief/medicare-advantage-in-2023-enrollment-update-and-key-trends. Group enrollees comprise a third or more of Medicare Advantage enrollees in five states: Alaska (99%), Michigan (40%), New Jersey (34%), Maryland (33%), and West Virginia (33%).
3 Just over 20 percent of large employers offer retiree health insurance. KFF, “Medicare Advantage Has Become More Popular Among the Shrinking Share of Employers That Offer Retiree Health Benefits,” December 15, 2023, https://www.kff.org/medicare/issue-brief/medicare-advantage-coverage-is-rising-for-the-declining-share-of-medicare-beneficiaries-with-retiree-health-benefits/.
4 Mark Miller, "More Retiree Health Plans Move Away from Traditional Medicare,” N.Y. Times, March 10, 2023, https://www.nytimes.com/2023/03/10/business/medicare-advantage-retirement-nyc.html. This limitation of benefit choice can cause some continuity-of-care and provider network issues. The plan may be offered by a different company from the person’s active-worker plan. Also, a retiree’s preferred physicians or facilities might no longer be in-network, leading the retiree pay out of pocket for care or to forgo employer benefits and find an individual MA plan. The other option is to enter Medicare FFS, but that brings an additional complication – if one wants to switch to FFS and pair it with a supplemental Medigap plan, you can be subject to underwriting, higher premiums, or rejection by Medigap plans in most states.
5 Laura Skopec and Stephen Zuckerman, “Medicare Advantage Employer Group Waiver Plans,” Urban Institute, January 10, 2024, https://www.urban.org/research/publication/medicare-advantage-employer-group-waiver-plans.
6 Skopec and Zuckerman, 2024.
7 MedPAC, March 2023, at 349.
8 Stuart Hammond, Andy Johnson, and Luis Serna, “The Medicare Advantage Program: Status Report” [Presentation hosted by the MedPAC], January 12, 2024, https://www.medpac.gov/wp-content/uploads/2023/10/MedPAC-MA-status-report-Jan-2024.pdf.
9 Numbers have been updated since the linked blog post publication to account for new (January 2024) estimated MedPAC projections of the two factors.
10 Technically, the benchmarks on which plans are paid increase, not the payments directly. Double bonuses are awarded in some urban counties with high MA penetration/competition. EGWPs don’t appear to be more (or less) prevalent in double bonus counties, nor is there an EGWP/non-EGWP difference in the distribution of enrollees among the different benchmark quartiles.
11 KFF, “Spending on Medicare Advantage Quality Bonus Payments Will Reach at Least $12.8 Billion in 2023,” August 9, 2023, https://www.kff.org/medicare/issue-brief/spending-on-medicare-advantage-quality-bonus-payments-will-reach-at-least-12-8-billion-in-2023.
12 Hammond, Johnson, and Serna, 2024. With some pandemic policies ending, it’s possible that the number of plans qualifying for bonuses will experience a slight decline over time.
13 KFF, “Spending on Medicare Advantage Quality Bonus Payments,” 2023.
14 The Centers for Medicare and Medicaid Services (CMS) uses an alpha-numeric system to identify contracts and the plans within a contract. The “800 series” of plan numbers (800 through 899) is reserved for EGWP plans. There can also be employer-sponsored enrollees of MA plans that are not 800 series plans, however, it is not clear exactly how many fall into this bucket.
15 Excludes enrollment under 11 in a county/plan combination. About 2.5 percent of EGWP enrollees are thus excluded in the data, based on a comparison with the CMS June 2023 summary MA report. Data are for plans with a 2023 star rating, which for EGWPs includes 99.7 percent of the enrollment included in the county/plan enrollment report.
16 CMS, “Announcement of Calendar Year (CY) 2017 Medicare Advantage Capitation Rates and Medicare Advantage and Part D Payment Policies and Final Call Letter” [Guidance Memorandum], April 4, 2016, https://www.hhs.gov/guidance/document/announcement-calendar-year-cy-2017-medicare-advantage-capitation-rates-and-medicare.
17 Nearly half (46 percent) of all EGWP enrollment is in contracts with EGWP enrollment levels at 75 percent or higher. For such contracts, the enrollment-weighted average star rating is 4.82, whereas in contracts with no EGWP enrollment the comparable number is 3.84.
18 Congressional Budget Office (CBO), “Options for Reducing the Deficit, 2019 to 2028: Reduce Quality Bonus Payments to Medicare Advantage Plans” December 2018, https://www.cbo.gov/budget-options/2018/54737; MedPAC, “June 2019 Report to the Congress: Medicare and the Health Care Delivery System,” June 2019, https://www.medpac.gov/document/http-www-medpac-gov-docs-default-source-reports-jun19_medpac_reporttocongress_sec-pdf.
19 Meyers DJ et al, “Association of Medicare Advantage Star Ratings With Racial, Ethnic, and Socioeconomic Disparities in Quality of Care,” JAMA Health Forum, 2021;2(6):e210793, https://jamanetwork.com/journals/jama-health-forum/fullarticle/2781100.
20 A recent article used an example of a plan’s ranking in Rhode Island being based on a contract with “data from 17 different plans across Massachusetts, Rhode Island, Vermont, Pennsylvania, and New Hampshire.” See Teno JM, Ankuda C, “The Lake Wobegon Effect—Where Every Medicare Advantage Plan Is ‘Above Average’,” JAMA Health Forum 2022;3(10):e224320.
21 MedPAC, March 2023, at 363.
22 It's worth noting that the MA health plan industry likes to argue that the increase in benchmarks for contracts with ratings of 4 stars or higher results in rebates that are a dollar-for-dollar increase in extra benefits for MA enrollees. However, MedPAC has shown that not to be the case. In 2019, for plans changing from non-bonus to bonus status, the majority of the additional payments were allocated to increased benefit costs (paying providers more), administration, or plan profit. See MedPAC, June 2019.
23 For more, see KFF, “Medicare Advantage Has Become More Popular Among the Shrinking Share of Employers That Offer Retiree Health Benefits.”
24 MedPAC, “Chapter 3: Replacing the Medicare Advantage quality bonus program,” in June 2020 Report to the Congress: Medicare and the Health Care Delivery System, June 2020, https://www.medpac.gov/document/http-www-medpac-gov-docs-default-source-reports-jun20_ch3_reporttocongress_sec-pdf.
25 Top of estimate range uses CBO budget options and adjusts baseline from Joe Albanese, “Improving Medicare Through Medicare Advantage,” Paaragon Health Institute, February 2024. Bottom of range is CRFB estimate based on average of KFF numbers from 2022 and 2023 bonuses ($11.5 billion). MedPAC estimate for 2024 is $15 billion.
26 MedPAC, June 2020. Option adjusted by CRFB.
26 MedPAC, June 2020. Option adjusted by CRFB.
27 CBO, “Options for Reducing the Deficit, 2019 to 2028: Reduce Quality Bonus Payments to Medicare Advantage Plans,” December 2018, https://www.cbo.gov/budget-options/2018/54737 (Budget option with adjustment by CRFB).
28 KFF, “Spending on Medicare Advantage Quality Bonus Payments,” 2023.
29 CMS, Guidance Memorandum.
30 In its June, 2021 report to Congress, MedPAC suggested a 2 percent reduction for all MA benchmarks, so this targeted reduction is well within the realm of plausible reforms. MedPAC, “Chapter 1: Rebalancing Medicare Advantage benchmark policy,” in June 2021 Report to the Congress: Medicare and the Health Care Delivery System, June 2021, https://www.medpac.gov/document/http-www-medpac-gov-docs-default-source-reports-jun21_ch1_medpac_report_to_congress_sec-pdf.
31 For more, see KFF, “Medicare Advantage Has Become More Popular Among the Shrinking Share of Employers That Offer Retiree Health Benefits,” 2023.